Abstract
PURPOSE
To study the accuracy and repeatability of anterior, posterior, and net corneal power measured by Fourier-domain optical coherence tomography (OCT).
SETTING
Doheny Eye Institute, Los Angeles, California, USA.
DESIGN
Cross-sectional study.
METHODS
A Fourier-domain OCT system (RTVue) was used to scan normal eyes, eyes after myopic laser in situ keratomileusis (LASIK), and keratoconic eyes. After the corneal surfaces were delineated, the system calculated anterior and posterior corneal powers by curve fitting over the central 3.0 mm diameter area. Net corneal power was calculated using a thick-lens formula. The repeatability of the calculations was evaluated by the pooled standard deviation of 3 measurements from the same visit. The net corneal power values were compared with standard automated keratometry measurements (IOLMaster).
RESULTS
The repeatability of Fourier-domain OCT net corneal power was 0.19 diopters (D), 0.26 D, and 0.30 D in the normal, post-LASIK, and keratoconus groups, respectively. The Fourier-domain OCT net corneal power was significantly lower than keratometry by a mean of −1.21 D, −2.89 D, and −3.07 D, respectively (P<.001). The anterior–posterior curvature ratio was lower in post-LASIK and keratoconic eyes than in normal eyes (P<.001).
CONCLUSIONS
Corneal power measured by Fourier-domain OCT achieved good repeatability in all 3 groups. The repeatability was better than slower time-domain OCT systems. Because Fourier-domain OCT directly measures both anterior and posterior corneal surfaces, it may produce more consistent results than standard keratometry in post-LASIK and keratoconic eyes in which the anterior–posterior corneal curvature ratios are altered by surgery or disease.
Accurate measurement of corneal power is important for various diagnostic and therapeutic applications in ophthalmology. It is commonly measured by manual or automated keratometry (K) or by simulated K values from Placido ring corneal topographers. By measuring the anterior corneal surface, these instruments provide accurate corneal power measurements in normal eyes. They extrapolate the posterior corneal power by assuming a fixed keratometric index. An index of 1.3375 is commonly used to obtain the back vertex power.1 The index is based on the assumption that anterior and posterior curvature has a fixed ratio of 0.883 (Gullstrand 1 schematic eye). It is lower than the corneal refractive index of 1.376 to compensate for the negative power of the posterior corneal surface. This assumption of a fixed ratio, however, is often wrong when used to assess corneas with pathology or after refractive surgery in which the changes in surface curvature mostly occur at the anterior corneal surface. The assumption thus leads to errors in the measurement of corneal power by standard keratometers; this can result in difficulties in applications, such as calculating intraocular lens (IOL) power after refractive surgery.
Direct measurement of both anterior and posterior corneal power is a logical improvement to standard keratometry. It has been made possible by corneal topography systems based on scanning-slit or rotating Scheimpflug camera technologies.2,3 Although optical coherence tomography (OCT) is also capable of directly measuring both corneal surfaces, we found in a previous study4 that it presented practical difficulties. In that study, to obtain corneal power we had to combine time-domain OCT and Placido-ring topography because corneal power measurement based only on OCT scans had poor repeatability.4 The main cause of this limitation was the motion error caused by the slow scanning speed. The purpose of the current study was to evaluate whether the faster Fourier-domain OCT can achieve better accuracy and repeatability in corneal power measurements without the aid of Placido-ring information on the anterior surface.
SUBJECTS AND METHODS
This prospective observational study was performed at Doheny Eye Institute, Los Angeles, California, USA. The Institutional Review Board, University of Southern California, approved the study. All subjects provided informed consent. The treatment of those enrolled in the study was in accordance with the tenets of the Declaration of Helsinki.
Three groups of subjects were evaluated. One group comprised normal subjects with no history of eye surgery; all subjects in this group had a comprehensive examination to exclude eye disease. Another group comprised subjects who had previous uneventful laser in situ keratomileusis (LASIK) for myopia or myopic astigmatism; OCT scanning was performed 2 to 6 months after LASIK. The last group of subjects had keratoconus that was diagnosed based on characteristic computerized topography findings and slitlamp examinations; none had any type of previous eye surgery.
A commercially available Fourier-domain OCT system (RTVue, Optovue, Inc.) with a speed of 26 000 axial scans per second was used in the study. For retinal imaging, the system has an axial resolution in tissue of 5 μm. To image the cornea, a corneal adaptor module was attached to the retinal scanner. The axial resolution for corneal imaging was also 5 μm because it is determined by the coherence length of the light source. The corneal mapping scan pattern consisted of 6.0 mm line scans on 8 meridians centered on the pupil (Figure 1). Each meridional line had 1019 axial scans. The entire scan pattern was completed within 0.32 seconds. The pupil was not dilated before OCT scans. During the scanning, the room lights were on. The subjects were asked to look straight ahead and fixate on the blue light that serves as the internal fixation target of the OCT system. The light is coaxial with the optical axis of the OCT system and in this study was projected through the corneal adaptor lens. It appeared to the eye being imaged as a solid, blue circular light straight ahead inside the adaptor lens. The corneal mapping pattern was repeated 3 times in each eye during the same visit.
Figure 1.
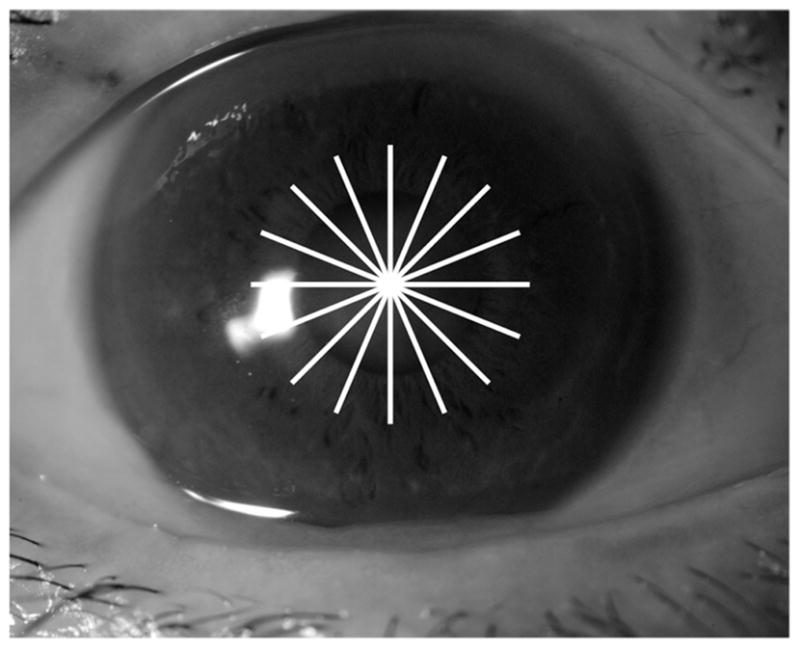
Optical coherence tomography scan pattern for corneal mapping.
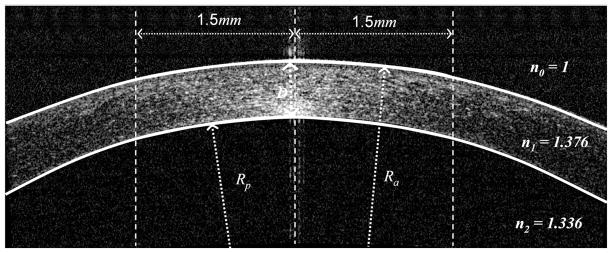
The corneal power was calculated by automated software that was jointly developed by the authors at Optovue, Inc., and the University of Southern California. On each meridional OCT image, the software identified the anterior and posterior corneal boundaries by identifying the signal peaks within each scan (Figure 2). The anterior and posterior curvatures along each meridian were calculated by parabolic fitting over the central 3.0 mm diameter area. The 8 meridional curvatures were then averaged to obtain the anterior and posterior corneal curvatures. The software identified the meridians with excessive motion and excluded them from the averages. The OCT system was calibrated once a month using a ceramic ball with a radius of 7.9328 mm.
Figure 2.
The anterior and posterior corneal powers are calculated by fitting the central 3.0 mm diameter area (D = central corneal thickness; Ra = anterior radius of curvature; Rp = posterior radius of curvature).
The same examiner (A.C.) evaluated the accuracy of computer segmentation by visually inspecting the vertical and horizontal corneal OCT sections with the computer-drawn boundaries overlaid on the corneal image. All scans were inspected, and any segmentation error was noted.
On each meridional scan, the anterior corneal power was calculated by Ka = (n1 − 1)/Ra, where n1 is the refractive index of cornea (1.376) and Ra is anterior radius of curvature within central 3.0 mm area. The posterior corneal power was calculated by Kp = (n2 − n1)/Rp, where n2 is the refractive index of aqueous (1.333) and Rp is the posterior radius of curvature within central 3.0 mm area. The net corneal power was calculated by K = Ka + Kp − D × Ka × Kp/n1, where D is the central corneal thickness. The overall anterior, posterior, and net powers of the cornea were obtained by averaging over the 8 meridians.
To decrease measurement error caused by eye motion during scanning, the system saved 5 consecutive pachymetry scans automatically each time the operator clicked the save button. The 2 scans with the maximum and minimum net corneal power were discarded. The anterior, posterior, and net corneal powers of the other 3 pachymetry scans were averaged for the final results. The corneal powers measured by Fourier-domain OCT were compared with those of standard keratometry. For normal and post-LASIK eyes, automated keratometry (IOLMaster, Carl Zeiss Meditec) was used as the standard. For keratoconic eyes, the simulated K value from Placido-ring topography (Orbscan II, Bausch & Lomb) was used as the standard. Both devices use a keratometric index of 1.3375 to compute the K power. Therefore, to obtain the anterior power measurement, the K power was multiplied by 0.376/0.3375.
Pooled standard deviation of repeated measurements was used to evaluate repeatability. Paired t tests and Bland-Altman plots5,6 were used to evaluate the agreement between Fourier-domain OCT corneal power measurements and standard keratometry measurements. Statistical analysis was performed using Excel software (Microsoft Corp.).
RESULTS
The study included 38 normal eyes of 26 subjects, 13 post-myopic LASIK eyes of 11 subjects, and 16 keratoconic eyes of 12 subjects. The mean myopic treatment in the LASIK group was −6.86 diopters (D) ± 2.97 (SD) (range −3.00 to −12.46 D) spherical equivalent. In the keratoconus group, 3 eyes had apical scars, 2 eyes had Vogt striae, and the remainder had a clear cornea.
Visual inspection of all 825 OCT corneal scans did not show visible computer segmentation errors in the central 3.0 mm area. Figure 3 shows examples of computer segmentation results in the 3 groups of subjects.
Figure 3.
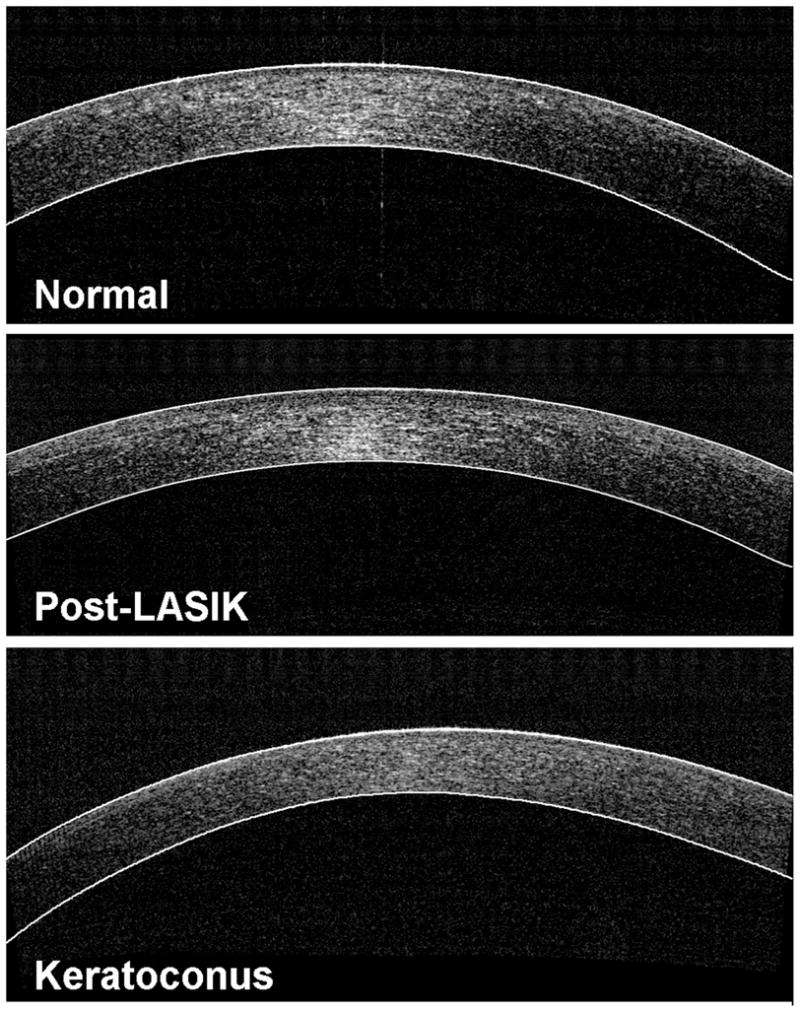
Examples of computer segmentation results in the 3 groups of eyes (LASIK = laser in situ keratomileusis).
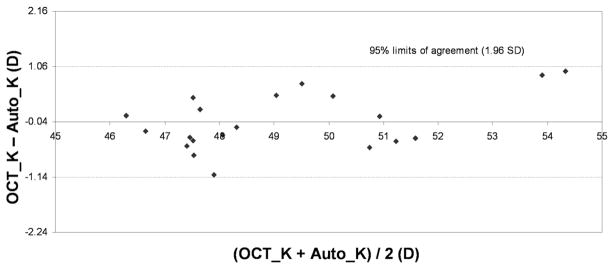
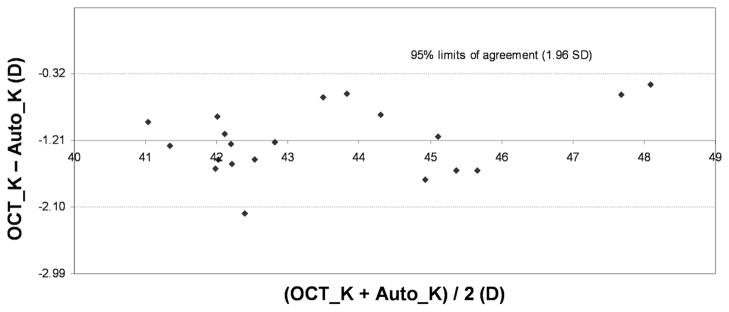
Table 1 shows the corneal measurements by Fourier-domain OCT and standard keratometry. The mean anterior corneal power measured by Fourier-domain OCT was equivalent to standard K values in the normal and keratoconus groups but was statistically significantly lower (−1.01 D) than in the post-LASIK group. The Fourier-domain OCT net corneal power was statistically significantly lower than the standard keratometry value in all 3 groups (−1.21 D normal, −2.89 D post-LASIK, −3.07 D keratoconic). There were moderate individual variations in the differences between Fourier-domain OCT and standard keratometry in anterior power (Figure 4) and net power (Figure 5), which is shown by the Bland-Altman plots of the normal group. In all 3 groups, the anterior–posterior curvature ratio measured by Fourier-domain OCT was significantly lower than the 0.883 value assumed in standard keratometry.
Table 1.
Comparison of corneal powers measured by OCT and conventional keratometry.
| Group/Method | Mean ± SD |
|||
|---|---|---|---|---|
| Anterior Power (D) | Posterior Power (D) | Net Power (D) | Anterior/Posterior Curvature Ratio | |
| Normal (n = 20) | ||||
| Auto-K | 48.94 ± 2.18 | — | 43.73 ± 1.95 | 0.883 |
| OCT-K | 48.90 ± 1.27 | −6.23 ± 0.37 | 42.52 ± 1.15 | 0.836 ± 0.016 |
| P value* | .46 | — | .001 | .001 |
| Post-LASIK (n = 13) | ||||
| Auto-K | 42.44 ± 3.78 | — | 38.13 ± 3.23 | 0.883 |
| OCT-K | 41.43 ± 4.25 | −6.13 ± 0.25 | 35.24 ± 4.15 | 0.720 ± 0.054 |
| P value* | .005 | — | .001 | .001 |
| Keratoconus (n = 16) | ||||
| Sim-K | 56.60 ± 8.28 | — | 50.81 ± 7.43 | 0.883 |
| OCT-K | 55.70 ± 6.74 | −8.10 ± 1.60 | 47.74 ± 5.30 | 0.741 ± 0.058 |
| P value* | .16 | — | .001 | .001 |
Auto-K = automated keratometry; n = eyes; LASIK = laser in situ keratomileusis; OCT-K = corneal power measured by optical coherence tomography; Sim-K = simulated keratometry from Placido-ring topography
Paired t test between corneal power measured by optical coherence tomography and automated keratometry or simulated keratometry from Placido-ring topography.
Figure 4.
Agreement between anterior corneal powers measured by Fourier-domain OCT (OCT_K) and standard automated keratometry (Auto_K) in normal eyes.
Figure 5.
Agreement between net corneal power measured by Fourier-domain OCT (OCT_K) and standard automated keratometry (Auto_K) in normal eyes.
The Fourier-domain OCT anterior and net corneal powers in the post-LASIK and keratoconus groups were statistically significantly different from those in the normal group (P<.001) (Table 1). The mean posterior corneal power in the keratoconus group was more negative than in normal eyes (P<.001). Post-LASIK eyes and normal eyes had similar posterior powers (P = .38). The anterior–posterior corneal curvature ratio was lower in the post-LASIK and keratoconic groups than in the normal group (P<.001).
Table 2 show the intravisit repeatability of Fourier-domain OCT corneal power measurements. The repeatability was slightly worse in the post-LASIK and keratoconus groups than in the normal group.
Table 2.
Repeatability of OCT corneal power measurements.
| Group | Eyes (n) | Power (D) |
||
|---|---|---|---|---|
| Anterior | Posterior | Net | ||
| Normal | 38 | 0.19 | 0.02 | 0.19 |
| Post-LASIK | 13 | 0.27 | 0.02 | 0.25 |
| Keratoconus | 16 | 0.35 | 0.09 | 0.30 |
LASIK = laser in situ keratomileusis
DISCUSSION
In Fourier-domain OCT corneal mapping, corneal surface elevation profiles are very sensitive to eye movement. According to the Munnerlyn formula,7 for example, a 10 μm axial sag error within the central 3.0 mm diameter could produce an anterior corneal power calculation error of approximately 3.0 D. This was the primary reason for the poor repeatability of corneal power measurements by the lower-speed time-domain OCT system.4 A previous study by our group4 used a time-domain OCT system with a scanning speed of 2000 axial scans per second; the repeatability of direct net corneal power measurements was 0.71 D in normal eyes. By combining time-domain OCT pachymetry and Placido-ring topography, we were able to obtain composite power measurements with an acceptable repeatability of 0.24 D for net corneal power. However, it was awkward clinically to combine information from 2 unconnected machines. Therefore, we hoped that the development of significantly faster Fourier-domain OCT technology would facilitate direct, precise corneal power measurements.
The Fourier-domain OCT system used in this study has a scanning speed of 26 000 axial scans per second, 13 times faster than the speed of the time-domain OCT system used in our previous study.4 With less motion errors, the Fourier-domain OCT system directly measured net corneal power almost 4 times more precisely than time-domain OCT in normal eyes. In fact, direct measurement by Fourier-domain OCT was more precise than the combination of time-domain OCT and Placido-ring topography in normal eyes.
We compared the accuracy of Fourier-domain OCT measurement and standard keratometry measurement of anterior corneal shape. The anterior corneal power measurements by the 2 methods agreed well on the average, which was reassuring. There was still a considerable range of differences between the 2 methods for individual eyes. The differences were not due to error in the computerized detection of anterior and posterior corneal boundaries because our visual inspection showed the software to be accurate. The individual difference might be due to some basic differences between the 2 methods. Standard keratometry measures the slope of the cornea over an annular area (or a portion of) centered on the vertex, while Fourier-domain OCT measures the curvature of the cornea over a circular area centered on the pupil. These 2 methods should yield the same results if the cornea is perfectly spherical; however, any deviation from sphericity could produce measurement differences. Further investigations are needed to elucidate the source and implications of these differences.
In normal eyes, the repeatability of Fourier-domain OCT net corneal power measurements was slightly worse than manual keratometry measurements but was comparable with measurements by autokeratometry and simulated keratometry. The repeatability of corneal power of a Bausch & Lomb manual keratometer was reported to be approximately 0.08 D.8,9 For automated keratometry (IOLMaster), the repeatability was approximately 0.14 D.9,10 The simulated K values of a Scheimpflug imaging system (Pentacam, Oculus Optikgerate GmbH) are reported to have a repeatability of 0.10 D11 to 0.14 D.12 We did not find previous literature on the repeatability of standard keratometry and simulated keratometry in post-LASIK or keratoconus eyes. The Fourier-domain OCT net power measurement variability was negligibly small compared with the difference between Fourier-domain OCT and standard keratometry.
The net corneal power from Fourier-domain OCT was, on average, 1.21 D lower than that of standard keratometry in the normal group. This discrepancy could be attributed to 2 factors, both of which are related to the keratometric index of 1.3375. First, the standard keratometry power is defined for the back vertex of the cornea1 and the Fourier-domain OCT net corneal power for the second principal plane of the cornea, which is slightly anterior to the front vertex. That makes the Fourier-domain OCT net power roughly 0.8 D lower than the standard keratometry power. Second, the keratometric index is based on Gullstrand 1 schematic eye, which assumes an anterior corneal radius of 7.7 mm and a posterior radius of 6.8 mm. Thus, the anterior–posterior corneal curvature ratio is 6.8/7.7, or 0.883. The Fourier-domain OCT data in our present study found the average ratio in normal eyes to be significantly lower, accounting for the remaining difference. Because standard IOL power formulas (eg, Hoffer Q, Holladay II, SRK/T) are calibrated for standard keratometry, the offset of 1.21 D should be added to the Fourier-domain OCT net corneal power before plugging it into standard IOL power formulas.
In post-LASIK and keratoconus eyes, the difference between Fourier-domain OCT net power and standard keratometry power was even greater than in normal eyes. Two factors contributed to this. First, the anterior corneal power measured by Fourier-domain OCT was lower than that measured by standard keratometry. This was mostly likely due to the higher weight of the central region in our Fourier-domain OCT corneal power algorithm. The LASIK patients in this study all had myopic correction, which resulted in an oblate cornea that was flatter in the center than in the periphery.7 Keratoconic corneas tend to have the greatest curvature inferotemporally rather than at the very center.13,14 Second, both myopic LASIK and keratoconus lower the anterior–posterior curvature ratio because of central thinning. Thus, these corneas deviate even further from the ratio assumed by the keratometric index. Standard keratometry overestimates corneal power after myopic LASIK, which, in turn results in hyperopic surprises after cataract surgery.15–17 Our results confirm that this error in standard keratometry is mostly the result of the altered anterior–posterior corneal curvature ratio.1 Because Fourier-domain OCT can directly measure both anterior and posterior corneal curvatures, it may be a more valid instrument for use in post-LASIK and keratoconic eyes, which have lower than normal anterior–posterior curvature ratios.
The finding that keratoconic eyes had lower anterior–posterior curvature ratios may have diagnostic implications. At present, we use computerized corneal topography to detect the increased and distorted anterior corneal surface in keratoconus. Our finding suggests that the alteration in the posterior curvature is even greater. Thus, Fourier-domain OCT measurement of posterior corneal curvature and topography may enhance detection of forme fruste keratoconus.
There are 2 possible landmarks for centering the OCT corneal mapping scan: the pupil and the corneal vertex. We chose the pupil because its position could not be altered by surgery (eg, LASIK, photorefractive keratectomy, phototherapeutic keratectomy), by disease (eg, keratoconus), or by corneal scarring. Thus, Fourier-domain OCT scans can be taken at different times to be registered correctly. Pupil centration is also used in laser vision correction, another application for Fourier-domain OCT corneal measurements. We had a theoretical concern that pupil position might not be as repeatably established as the corneal vertex. However, our results show that pupil centration can provide repeatable corneal power measurements. Therefore, we recommend using pupil centration for all Fourier-domain OCT corneal mapping scans unless the pupil is pathologically eccentric.
One limitation of our method is that the OCT net corneal power was measured over a fixed analytic zone of 3.0 mm in diameter. It was a reasonable choice because the size is comparable to that of standard keratometry and simulated keratometry. In addition, we found that the OCT net corneal power within the 3.0 mm area accurately tracked post-LASIK refractive changes.4 It is also reported to provide accurate corneal power input for IOL power calculations for cataract patients without previous refractive surgery.18 The optimal analytic zone for calculating true corneal power, however, may vary by pupil size as well as by higher-order aberrations. In the future, OCT corneal power measurement might be further improved by ray-tracing calculations that take pupil size and higher-order corneal aberrations into account.
We used the parabolic fitting approach in the current study because the parabolic surface has a simple correspondence to focusing power. Therefore, parabolic fitting is a simple and robust way to extract the average focusing power of the central cornea. Parabolic fitting, however, smoothes the detailed topographic information. Therefore, a different approach is needed to provide a corneal topography map from the OCT images. A topography software will require motion compensation, interpolation, and surface reconstruction algorithms. We are developing topography software and will report the results separately.
Optical coherence tomography is not the only instrument that can directly measure the curvatures of both the anterior and posterior corneal surfaces. Slit-scanning instruments such as the Orbscan II, Pentacam, and the Galilei dual Scheimpflug camera (Ziemer Group) also have that capability. However, the Fourier-domain OCT system is faster with higher resolution. At a reasonable working distance, the 5 μm resolution of the Fourier-domain OCT device is much higher than that possible with slit scanning. Thus, the = Fourier-domain OCT system gives more accurate corneal thickness measurements than the Orbscan II in the presence of corneal haze or opacity.19–22 Theoretically, the higher resolution may also translate to higher accuracy in corneal power measurements. The current Fourier-domain OCT system mapped the cornea in 0.32 second, compared with 1.0 to 2.0 seconds with the slit-scanning devices. Comparative studies are needed to evaluate whether these technical advantages translate to better accuracy in corneal power measurement in the clinical setting.
It would be interesting to know whether the precision of Fourier-domain OCT corneal power measurement is limited by its speed or spatial resolution. The relationship between the repeatability of net corneal power compared with anterior power offers a clue. If speed were limiting the precision, the predominant cause of curvature variability would corneal movement during the scan. If centration were limiting the precision, the predominant cause of curvature variability would be the different centration between scans. In either case, because the anterior cornea and posterior cornea move together, the resulting error would have opposite signs that would partially offset each other because the anterior corneal boundary has positive power and the posterior cornea has negative power. Therefore the net corneal power should have less variability than the anterior corneal power. On the other hand, if spatial resolution were limiting precision, the anterior and posterior curvature measurement errors should be dominated by segmentation errors in the anterior and posterior corneal boundaries. These 2 variances would be independent and additive. In this case, the variance in the net corneal power would be greater than both the variance in the anterior–posterior corneal power. Our intravisit repeatability results suggest that speed or centration, not resolution, limited the precision of the Fourier-domain OCT system we used. Faster Fourier-domain OCT technology has been evaluated,23,24 and it might improve the precision of corneal measurements in the future.
At 26 000 axial scans per second and 5 μm, Fourier-domain OCT is fast enough to obtain direct corneal power measurement with acceptable repeatability. Because the technology does not rely on an assumed fixed geometric relationship between the anterior surface and the posterior surface, it may be a more robust method for measuring corneal power that is accurate in surgically modified (post-LASIK) eyes and pathologically distorted (keratoconus) eyes. It may have application in IOL power calculation and refractive surgical planning. Further clinical studies are needed to validate each application.
Acknowledgments
Supported by National Institutes of Health, Bethesda, Maryland, grants R01 EY018184 and P30 EY03040; a grant from Optovue, Inc.; and the Charles C. Manger III, MD Chair in Corneal Laser Surgery endowment (held by Dr. Huang).
Footnotes
Financial disclosures: Drs. Tang, Li, and Huang receive grant support from and Dr. Huang has received patent royalty, stock options, and travel support from Optovue, Inc. Dr. Huang receives patent royalty from the Massachusetts Institute of Technology related to optical coherence tomography technology licensed to Carl Zeiss Meditec, Inc. Dr. Chen is an employee of Optovue, Inc.
Publisher's Disclaimer: This is a PDF file of an unedited manuscript that has been accepted for publication. As a service to our customers we are providing this early version of the manuscript. The manuscript will undergo copyediting, typesetting, and review of the resulting proof before it is published in its final citable form. Please note that during the production process errors may be discovered which could affect the content, and all legal disclaimers that apply to the journal pertain.
References
- 1.Norrby S. Pentacam keratometry and IOL power calculation [letter] J Cataract Refract Surg. 2008;34:3. doi: 10.1016/j.jcrs.2007.08.015. reply by E Borasio, 4. [DOI] [PubMed] [Google Scholar]
- 2.Sónego-Krone S, López-Moreno G, Beaujon-Balbi OV, Arce CG, Schor P, Campos M. A direct method to measure the power of the central cornea after myopic laser in situ keratomileusis. [Accessed August 16, 2010];Arch Ophthalmol. 2004 122:159–166. doi: 10.1001/archopht.122.2.159. Available at: http://archopht.ama-assn.org/cgi/reprint/122/2/159.pdf. [DOI] [PubMed]
- 3.Srivannaboon S, Reinstein DZ, Sutton HFS, Holland SP. Accuracy of Orbscan total optical power maps in detecting refractive change after myopic laser in situ keratomileusis. J Cataract Refract Surg. 1999;25:1596–1599. doi: 10.1016/s0886-3350(99)00286-2. [DOI] [PubMed] [Google Scholar]
- 4.Tang M, Li Y, Avila M, Huang D. Measuring total corneal power before and after laser in situ keratomileusis with high-speed optical coherence tomography. J Cataract Refract Surg. 2006;32:1843–1850. doi: 10.1016/j.jcrs.2006.04.046. [DOI] [PMC free article] [PubMed] [Google Scholar]
- 5.Bland JM, Altman DG. Statistical methods for assessing agreement between two methods of clinical measurement. [Accessed August 16, 2010];Lancet. 1986 1:307–310. Available at: http://www-users.york.ac.uk/~mb55/meas/ba.pdf. [PubMed]
- 6.Bland JM, Altman DG. Measuring agreement in method comparison studies. Stat Methods Med Res. 1999;8:135–160. doi: 10.1177/096228029900800204. [DOI] [PubMed] [Google Scholar]
- 7.Munnerlyn CR, Koons SJ, Marshall J. Photorefractive keratectomy: a technique for laser refractive surgery. J Cataract Refract Surg. 1988;14:46–52. doi: 10.1016/s0886-3350(88)80063-4. [DOI] [PubMed] [Google Scholar]
- 8.Hannush SB, Crawford SL, Waring GO, III, Gemmill MC, Lynn MJ, Nizam A. Reproducibility of normal corneal power measurements with a keratometer, photokeratoscope, and video imaging system. [Accessed August 16, 2010];Arch Ophthalmol. 1990 108:539–544. doi: 10.1001/archopht.1990.01070060087055. Available at: http://archopht.ama-assn.org/cgi/reprint/108/4/539. [DOI] [PubMed]
- 9.Shirayama M, Wang L, Weikert MP, Koch DD. Comparison of corneal powers obtained from 4 different devices. Am J Ophthalmol. 2009;148:528–535. doi: 10.1016/j.ajo.2009.04.028. [DOI] [PubMed] [Google Scholar]
- 10.Vogel A, Dick HB, Krummenauer F. Reproducibility of optical biometry using partial coherence interferometry; intraobserver and interobserver reliability. J Cataract Refract Surg. 2001;27:1961–1968. doi: 10.1016/s0886-3350(01)01214-7. [DOI] [PubMed] [Google Scholar]
- 11.Chen D, Lam AKC. Reliability and repeatability of the Pentacam on corneal curvatures. Clin Exp Optom. 2009;92:110–118. doi: 10.1111/j.1444-0938.2008.00336.x. [DOI] [PubMed] [Google Scholar]
- 12.Shankar H, Taranath D, Santhirathelagan CT, Pesudovs K. Anterior segment biometry with the Pentacam: comprehensive assessment of repeatability of automated measurements. J Cataract Refract Surg. 2008;34:103–113. doi: 10.1016/j.jcrs.2007.09.013. [DOI] [PubMed] [Google Scholar]
- 13.Tang M, Shekhar R, Miranda D, Huang D. Characteristics of keratoconus and pellucid marginal degeneration in mean curvature maps. Am J Ophthalmol. 2005;140:993–1001. doi: 10.1016/j.ajo.2005.06.026. [DOI] [PubMed] [Google Scholar]
- 14.Rabinowitz YS, Yang H, Brickman Y, Akkina J, Riley C, Rotter JI, Elashoff J. Videokeratography database of normal human corneas. [Accessed August 16, 2010];Br J Ophthalmol. 1996 80:610–616. doi: 10.1136/bjo.80.7.610. Available at: http://www.ncbi.nlm.nih.gov/pmc/articles/PMC505554/pdf/brjopthal00007-0030.pdf. [DOI] [PMC free article] [PubMed]
- 15.Seitz B, Langenbucher A, Nguyen NX, Kus MM, Küchle M. Underestimation of intraocular lens power for cataract surgery after myopic photorefractive keratectomy. Ophthalmology. 1999;106:693–702. doi: 10.1016/S0161-6420(99)90153-7. [DOI] [PubMed] [Google Scholar]
- 16.Hamed AM, Wang L, Misra M, Koch DD. A comparative analysis of five methods of determining corneal refractive power in eyes that have undergone myopic laser in situ keratomileusis. Ophthalmology. 2002;109:651–658. doi: 10.1016/s0161-6420(01)01001-6. [DOI] [PubMed] [Google Scholar]
- 17.Odenthal MTP, Eggink CA, Melles G, Pameyer JH, Geerards AJM, Beekhuis WH. Clinical and theoretical results of intraocular lens power calculation for cataract surgery after photorefractive keratectomy for myopia. Arch Ophthalmol. 2002;120:431–438. doi: 10.1001/archopht.120.4.431. [DOI] [PubMed] [Google Scholar]
- 18.Tang M, Li Y, Huang D. An intraocular lens power calculation formula based on optical coherence tomography: a pilot study. J Refract Surg. 2010;26:430–437. doi: 10.3928/1081597X-20090710-02. [DOI] [PMC free article] [PubMed] [Google Scholar]
- 19.Boscia F, La Tegola MG, Alessio G, Sborgia C. Accuracy of Orbscan optical pachymetry in corneas with haze. J Cataract Refract Surg. 2002;28:253–258. doi: 10.1016/s0886-3350(01)01162-2. [DOI] [PubMed] [Google Scholar]
- 20.Khurana RN, Li Y, Tang M, Lai MM, Huang D. High-speed optical coherence tomography of corneal opacities. Ophthalmology. 2007;114:1278–1285. doi: 10.1016/j.ophtha.2006.10.033. [DOI] [PubMed] [Google Scholar]
- 21.Kim SW, Byun YJ, Kim EK, Kim T-I. Central corneal thickness measurements in unoperated eyes and eyes after PRK for myopia using Pentacam, Orbscan II, and ultrasonic pachymetry. J Refract Surg. 2007;23:888–894. doi: 10.3928/1081-597X-20071101-04. [DOI] [PubMed] [Google Scholar]
- 22.Prisant O, Calderon N, Chastang P, Gatinel D, Hoang-Xuan T. Reliability of pachymetric measurements using Orbscan after excimer refractive surgery. Ophthalmology. 2003;110:511–515. doi: 10.1016/S0161-6420(02)01298-8. [DOI] [PubMed] [Google Scholar]
- 23.Potsaid B, Gorczynska I, Srinivasan VJ, Chen Y, Jiang J, Cable A, Fujimoto JG. Ultrahigh speed spectral/Fourier domain OCT ophthalmic imaging at 70,000 to 312,500 axial scans per second. [Accessed August 16, 2010];Opt Express. 2008 16:15149–15169. doi: 10.1364/oe.16.015149. Available at: http://www.opticsinfobase.org/view_article.cfm?gotourl=http%3A%2F%2Fwww%2Eopticsinfobase%2Eorg%2FDirectPDFAccess%2FE028A839%2DC655%2D2F11%2D8895E4C94790EE74%5F171960%2Epdf%3Fda%3D1%26id%3D171960%26seq%3D0%26mobile%3Dno&org. [DOI] [PMC free article] [PubMed]
- 24.Srinivasan VJ, Adler DC, Chen Y, Gorczynska I, Huber R, Duker JS, Schuman JS, Fujimoto JG. Ultrahigh-speed optical coherence tomography for three-dimensional and en face imaging of the retina and optic nerve head. [Accessed August 16, 2010];Invest Ophthalmol Vis Sci. 2008 49:5103–5110. doi: 10.1167/iovs.08-2127. Available at: http://www.iovs.org/cgi/reprint/49/11/5103. [DOI] [PMC free article] [PubMed]


