Abstract
Perceptual decision making is a complex process that requires multiple computations, including the accumulation of sensory evidence and an ongoing evaluation of the accumulation process to use for prediction and adjustment. Implementing these computations likely involves interactions among many brain regions. For perceptual decisions linked to oculomotor actions, neural correlates of sensory evidence accumulation have been identified in several cortical areas, including the frontal eye field and lateral intraparietal area, and one of their direct, subcortical targets, the superior colliculus. These structures are also connected indirectly, via the basal ganglia. The basal ganglia pathway has been theorized to contribute to perceptual decision making, but the nature of this contribution has yet to be examined directly. Here we show that in monkeys performing a reaction-time visual motion direction-discrimination task, neurons in a primary input structure of the basal ganglia, the caudate nucleus, encode three aspects of decision making: evidence accumulation, evaluation, and choice biases. These results indicate that the basal ganglia pathway can provide important signals to influence and assess perceptual decisions that guide oculomotor behavior.
Introduction
To form perceptual decisions, the brain must evaluate how incoming sensory information supports or opposes the alternative hypotheses under consideration (Gold and Shadlen, 2007). Under certain conditions, this process involves the temporal accumulation of sensory evidence, correlates of which have been identified in several brain regions, including the lateral intraparietal area (LIP) and frontal eye field (FEF) of cortex and downstream superior colliculus (SC) in the brainstem (Shadlen et al., 1996; Horwitz and Newsome, 1999; Kim and Shadlen, 1999; Shadlen and Newsome, 2001; Huk and Shadlen, 2005). However, evidence accumulation alone is insufficient to account for effective and flexible decision making, which also depends on other factors like preferences and expectations. Little is known about how and where in the brain these multiple factors are integrated to shape decision making.
In this study we examined the role of the basal ganglia pathway in this integrative process. The basal ganglia provide an indirect link between cortical (LIP, FEF) and brainstem (SC) structures that encode evidence accumulation for saccadic decisions and thus are well positioned to contribute to this visuomotor decision process. Its specific computational roles in the decision process have been hypothesized but not yet verified experimentally (Lo and Wang, 2006; Bogacz and Gurney, 2007). Within this pathway, we targeted the caudate nucleus, which provides evaluative signals and reward-driven biases to influence associative learning and reward-modulated behaviors in monkeys performing saccade tasks with simple, suprathreshold stimuli (for review, see Hikosaka et al., 2006; Nakamura and Hikosaka, 2006a,b; Williams and Eskandar, 2006; Lau and Glimcher, 2007, 2008).
We focused on three distinct computational elements that contribute to flexible decision making (Gold and Shadlen, 2007). The first is evidence accumulation, which reflects the strength of the sensory evidence, the time elapsed during the decision process, and the final choice (Roitman and Shadlen, 2002; Smith and Ratcliff, 2004). The second is an ongoing estimate of confidence in or expectations about impending reward delivery or other outcomes (Sutton and Barto, 1998; Kepecs et al., 2008; Kiani and Shadlen, 2009). This kind of evaluative quantity can be used to terminate or adjust the decision process and should reflect the quality of the evidence but not necessarily the particular choice. The third element uses the ongoing evaluation of the decision process and other task-related factors to influence choice behavior, for example by introducing a bias into the initial or final value of the accumulation process (Carpenter and Williams, 1995; Voss et al., 2004; Bogacz et al., 2006; Diederich and Busemeyer, 2006).
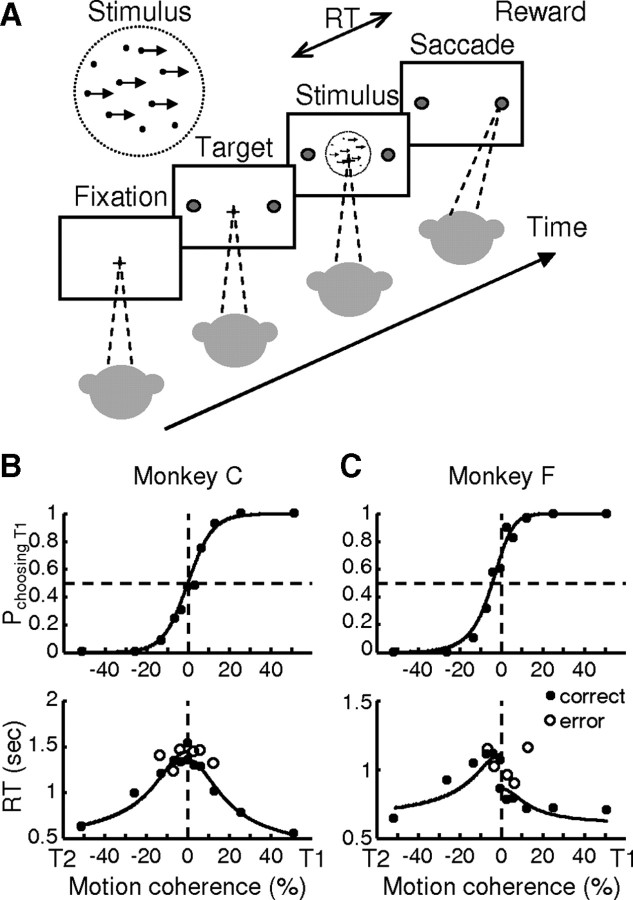
We recorded from individual caudate neurons in monkeys performing a reaction-time (RT) version of a random-dot motion direction-discrimination task (Fig. 1A). We found that caudate encodes all three computational elements described above. These novel results suggest that the basal ganglia play a variety of roles in promoting effective and flexible visual-oculomotor decisions, by providing necessary signals to evaluate and influence the decision process.
Figure 1.
Behavioral task and performance. A, The monkey decides the direction of random-dot motion and then responds immediately by making a saccade to one of two choice targets. Saccades to the target in the direction of coherent motion (assigned randomly for 0% coherence) are followed by juice reward. B, C, Example psychometric (top) and chronometric (bottom) functions from a single session for monkey C (B) and monkey F (C). Psychometric functions are plotted as the fraction of trials in which the monkey chose the T1 target as a function of signed coherence, where positive coherence indicates motion toward T1. Chronometric functions are plotted as the mean RT, measured as the time between motion stimulus onset and saccade onset, for saccades toward each target, separated by correct (filled symbols) and error (open symbols) trials. Solid curves are simultaneous fits of both functions to a drift-diffusion model with asymmetric bounds.
Materials and Methods
Two adult male rhesus monkeys (Macaca mulatta) were used. All training, surgery, and experimental procedures were in accordance with the National Institutes of Health Guide for the Care and Use of Laboratory Animals and were approved by the University of Pennsylvania Institutional Animal Care and Use Committee.
Behavioral tasks.
The motion discrimination (dots) task (Fig. 1A) has been described in detail previously (Roitman and Shadlen, 2002). Briefly, after the monkey fixated for a random time (between 0.3 and 3.0 s and between 0.4 and 2.5 s for monkeys C and F, respectively, picked from a truncated exponential distribution to minimize anticipation of the end of this period), the fixation point dimmed and the motion stimulus, a random-dot kinematogram, was shown in a 5° aperture centered on the fixation point, with a fixed velocity of 6°/s. Motion strength of the stimulus was specified as the percentage of dots moving coherently in one direction (coherence). Six levels of coherence (0, 3.2, 6.4, 12.8, 25.6, or 51.2%) and two motion directions were randomly interleaved. The monkey was rewarded with a drop of juice for making a saccadic eye movement and then maintaining fixation for >400 ms on the target in the direction of coherent motion (or chosen at random on 0% coherence trials) at any time following the stimulus onset. The stimulus was immediately turned off when the monkey's gaze left the fixation window (4° and 3.5° diameter for monkey C and F, respectively). Error feedback was given by extinguishing the error target while simultaneously turning on the correct target, followed by no reward and a time-out of 4–8 s. For monkey C, a minimum of 1.5 s from stimulus onset to reward delivery was imposed to discourage attempts to get rewarded quickly by simply guessing. For monkey F, no minimal stimulus–reward delay was needed. Eye position was monitored using a video-based system (ASL) sampled at 240 Hz.
We used a standard memory-guided saccade (MGS) task to search for neurons and test for any relationship in caudate activity between the MGS and dots tasks. For the MGS task, the monkey fixated for 500–1000 ms, after which a peripheral cue was flashed for 100 ms at one of eight possible locations. The monkey maintained fixation until the fixation point was turned off (GO) ∼600–1000 ms after cue onset and was rewarded with a drop of juice 400 ms after a correct saccade to the memorized cue location.
Electrophysiology.
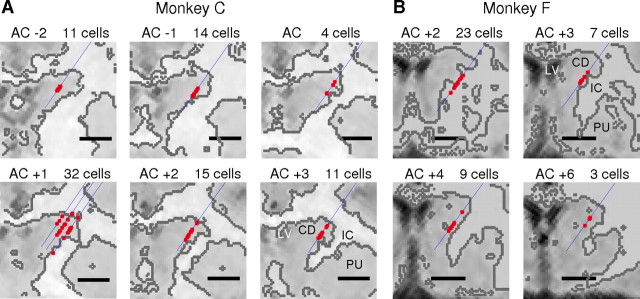
Each monkey was implanted with a head holder and recording cylinder that provided access to the right caudate. Before recordings began, magnetic resonance images (MRIs) were taken of each monkey's head, using an enclosed tube that was filled with a copper-sulfate solution and placed inside the recording cylinder to enhance brightness. Based on the location and orientation of the recording cylinder relative to the brain, the depth and grid coordinates of each recording site were converted to coordinates on the MRI (Fig. 2). For better visualization of the lateral boundary of caudate, MR images were thresholded at mean intensity + 0.4 SD and edges were identified in the binary images using the MATLAB image processing toolbox.
Figure 2.
A, B, MR localization of recording sites for neurons included in the analysis. MR images of the coronal plane for monkey C (A) and monkey F (B), with blue lines illustrating estimated electrode tracks and red circles illustrating estimated locations of recording sites for neurons included in the analysis. The anterior–posterior positions of the images relative to the anterior commissure (AC) are indicated by the numbers on the top left (in millimeters, positive: anterior; negative: posterior). The numbers at the top right of each panel indicate the number of cells recorded along the tracks shown. Scale bar, 5 mm. Gray outlines indicate estimated boundary between gray and white matter (see Materials and Methods). CD, Caudate; IC, internal capsule; LV, lateral ventricle; PU, putamen.
Neural activity was recorded using glass-coated tungsten electrodes (Alpha-Omega) and sorted off-line (Plexon). The caudate was identified based on estimated locations based on MRIs (Fig. 2) and characteristic low background activity at >10 mm below the dural surface. We recorded only from putative projection neurons (also called phasically active neurons, or PANs), which we identified by their low spontaneous activity and activation in bursts of spikes (Hikosaka et al., 1989). We searched for caudate neurons while the monkeys performed the dots task (monkey F) and/or MGS task (monkey C). We attempted to record from all cells that showed modulated activity, identified by visual inspection of ∼10–20 trials, on the dots task. For monkey C, the direction axis for the dots task was determined by finding the target location that elicited the largest responses, assessed qualitatively, on both the MGS task and different configurations of the dots task. For monkey F, the direction axis was always directly horizontal. Only cells with stable recordings of more than five correct trials per condition were included in the analyses below. In a subset of sessions, we also recorded the same neurons on the MGS task, with either the eight possible cue locations or only two cue locations identical to the choice target locations in the dots task.
Behavioral data analysis.
We measured RT as the time from stimulus onset to saccade onset. Saccade onset was identified offline with respect to velocity (>40°/s) and acceleration (>8000°/s2). We fit choice (T1 or T2) and RT data as functions of signed motion coherence (Coh, positive for toward T1, negative for toward T2) simultaneously to a drift-diffusion model (Palmer et al., 2005; Hanks et al., 2006). According to this model, momentary motion evidence is assumed to follow a Gaussian distribution  (μ, 1), the mean of which, μ, scales with coherence: μ = k × Coh, where k is a fit parameter that governs the coherence-dependent drift. A decision variable is computed as the temporal accumulation of this momentary motion evidence. A decision (T1 or T2) is reached when the value of the decision variable reaches a decision bound (+A or −B, respectively). Decision time is defined as the interval between stimulus onset and crossing of either decision bound. RT is the sum of decision time and nondecision time (T01 for a T1 choice and T02 for a T2 choice, each of which is a free parameter in the model). Within this framework, the probability of choosing T1 (i.e., the probability that the decision variable reaches bound +A first) is (e2μB − 1)/(e2μB − e−2μA). The average decision time is [(A + B)/μ]coth(μ(A + B)) − (B/μ)coth(μB) for T1 decisions and [(A + B)/μ]coth(μ(A + B)) − (A/μ)coth(μA) for T2 decisions. Best-fit parameters (A, B, k, T01, and T02) were obtained using maximum-likelihood methods. Threshold was estimated from the choice function as one-half the difference in coherence corresponding to 25 and 75% T1 choices (Klein, 2001). Bias was defined as the percentage coherence corresponding to 50% T1 choices.
Neural data analysis.
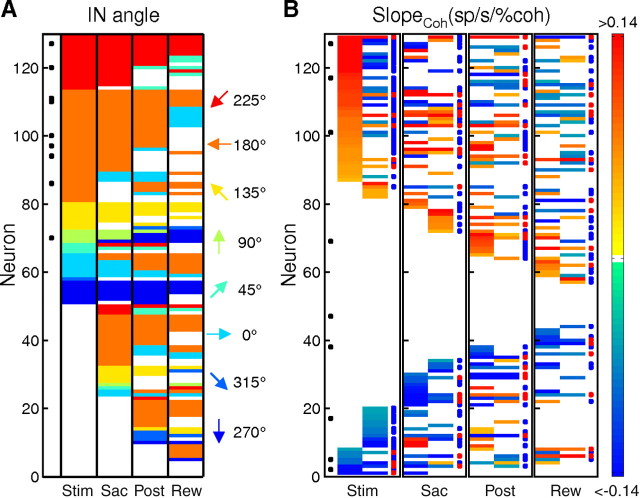
For each neuron, we computed the average firing rates in five task epochs: from 300 ms before stimulus onset to 150 ms after stimulus onset (“Pre”); from 200 ms after stimulus onset to 100 ms before the median RT at 51.2% coherence for a given session (“Stim”) (note that this epoch was fixed across trials for a given neuron, but could vary across neurons); from 200 ms before to 100 ms after saccade onset (“Sac”); from 100 to 500 ms after saccade onset (“Post”); and from reward onset to 500 ms afterward (“Rew”). For activity in each epoch except Pre, we examined the choice and coherence dependence of spike rate from correct trials with nonzero coherence. If there was significant choice dependence (Wilcoxon rank-sum test for H0: equal median spike rates in the given epoch from correct trials corresponding to the two choices, p < 0.05), the choice associated with larger median activity was designated IN and the other OUT. For choice-independent activity, we arbitrarily assigned the choice associated with contralateral or up target as the IN choice and the other as the OUT choice, for display purposes only. An additional analysis tested for coherence dependence by computing a linear regression, with the coherence level and a constant term as the regressors, separately for IN and OUT choices. The significance of the coherence dependence was assessed using an F test (H0: slope = 0, p < 0.05). The slope values from the linear regression and their significance were used to categorize response types (Fig. 3B).
Figure 3.
Summary of modulation by choice (A) and coherence (B) across epochs in the population of 129 neurons. Each row represents a single neuron across epochs. Activity in different task epochs was tested separately. Neurons are sorted separately in A and B, as described below. A, Colors represent IN target location of cells showing choice-dependent activity (see color scale to the right). For each neuron, only two motion directions were used and saccade targets corresponded to the motion directions. IN target refers to the preferred target location of the two alternatives. White entries indicate no choice dependence (Wilcoxon rank-sum test, p ≥ 0.05). Neurons are sorted by direction preference in successive epochs. Black circles in the leftmost column indicate cells with bias activity. B, Colors represent the slope of coherence modulation based on a linear regression (see color scale to the right). Positive/negative values imply increasing/decreasing neural responses as a function of coherence. White indicates no significant coherence modulation (F test, p ≥ 0.05). For each epoch, the left and right vertical columns represent IN and OUT choices, respectively. Neurons are sorted by slope values of successive columns in descending order. Black circles in the Stim epoch indicate cells with bias activity during the Pre epoch. Blue and red circles at the right identify evidence accumulation and evaluation activity for each epoch, respectively.
Based on these results, we categorized the activity after stimulus onset into two types. Evidence accumulation activity depended on choice and was modulated by coherence with different signs for the two choices (Fig. 3B, blue circles). Evaluation activity was modulated by coherence with the same sign for the two choices (Fig. 3B, red circles). Evaluation activity may show additional choice modulation such that the average activity across coherence levels and consequently the strength of coherence modulation may still depend on choice. Note that these definitions were used for convenience in referring to the different response patterns but are not meant to imply exclusive functional associations. We used the sign, instead of the strength, of coherence modulation in these definitions because the majority of caudate activity depended on choice in a manner that affected the coherence modulation (choice-sensitive coherence modulation was observed in 150/152 epochs with evidence accumulation activity and 54/70 epochs with evaluation activity; F test comparing nested linear models with choice-dependent and choice-independent coherence modulation, p < 0.05).
For each neuron with evidence accumulation activity in the Stim epoch, we tested for choice dependence (significant difference between IN and OUT trials) in 100 ms sliding windows at 10 ms steps starting at stimulus onset. We estimated the onset of choice-dependent activity, tchoice, as the beginning of the first 100 ms window showing significant choice dependence (Wilcoxon rank-sum test, p < 0.05). We computed the unfiltered spike-density function between 200 ms before tchoice and median saccade reaction time, excluding activity 100 ms before saccade onset and onward in each trial. We identified the time of highest/lowest activity, tpeak, for IN/OUT choice trials using a running average of the spike density function (10 ms running window). With the same running average, we measured the rate of change during the Stim epoch by estimating the slope between tchoice and tpeak. The slope of rate of change was computed using a linear regression with coherence level and a constant term as the regressors.
We defined bias activity as activity in the Pre epoch that was predictive of monkey's choice, in a way consistent with the choice preference of that neuron's activity during the Stim epoch (Fig. 3A,B, black circles). To identify bias activity, we focused on cells with choice-dependent activity in the Stim epoch. For each cell, we combined 3.2% and 6.4% coherence trials and grouped them by choice. We estimated how well the Pre epoch firing rate in single low-coherence trials could predict monkey's subsequent choice, by computing a receiver operating characteristic (ROC)-based predictive index (Kim and Shadlen, 1999). We tested whether this predictive index was significantly greater than 0.5, based on the 95% confidence interval estimated using a bootstrap method with 2000 iterations. Bias activity was defined as Pre epoch activity with a predictive index significantly greater than 0.5.
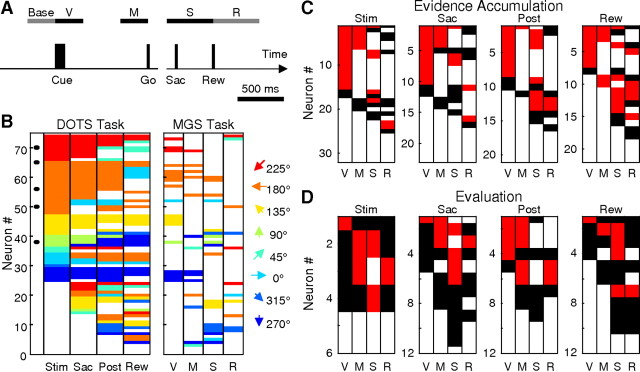
For the MGS task, we computed the average firing rates in four task epochs (see Fig. 12A, below): visual response (V, 0–300 ms after cue onset), memory period (M, 300 to 0 ms before GO signal), saccade response (S, −100–400 ms around saccade onset), and reward response (R, 500 ms after reward onset). Task-modulated activity was defined as activity different from baseline (Base, 300 ms before cue onset; Wilcoxon rank-sum test, p < 0.05). Directional selectivity was assessed using activity associated with the same two directions as in the dots task (Wilcoxon rank-sum test, H0: equal medians for the two directions, p < 0.05).
Figure 12.
Caudate activity is task dependent. A, Timeline of the MGS task and epochs used for analysis. B, Comparison of preferred target direction for the dots (left) and MGS (right) tasks. Each row represents the same neuron across panels. Same conventions as Figure 3A. Only neurons that were recorded in both tasks are included. C, Summary of response profiles on the MGS task for neurons with evidence accumulation activity on the dots task. The four panels depict activity of neurons with evidence accumulation activity for four epochs of the dots task, as indicated above. Within each panel, each row represents a single neuron, and each column represents one of the four epochs of the MGS task as in A. White, Activity not different from baseline (Wilcoxon rank-sum test, p ≥ 0.05); black, activity different from baseline, but not direction selective (Wilcoxon rank-sum test, p ≥ 0.05); red, direction selective. D, Summary of response profiles on the MGS task for neurons with evaluation activity on the dots task. The same conventions are used as in C.
Results
We trained two monkeys on the dots task (Fig. 1A) (Roitman and Shadlen, 2002). For both monkeys, performance accuracy and RT changed systematically as a function of motion strength (coherence) (Fig. 1B,C). At 51.2% coherence, both monkeys nearly always made the correct choice with the shortest mean RT. At lower coherences, the probability of choosing the correct target decreased, while mean RT increased. Both the psychometric and chronometric functions were well described by a drift-diffusion model with asymmetric bounds (Fig. 1B,C) (Palmer et al., 2005; Hanks et al., 2006). In general, the fits indicated low thresholds for both monkeys and a slight bias toward T1 (rightward direction) for monkey F (Table 1).
Table 1.
Summary of behavioral measures during recording sessions
| T1 Angle | Threshold (%coh) | Bias (%coh) | A | B | k | T01 (ms) | T02 (ms) |
|---|---|---|---|---|---|---|---|
| Monkey C | |||||||
| 0° | 10.38 | −0.543 | 30.07 | 26.76 | 0.283 | 374.6 | 314.3 |
| 11.04 | 0.557 | 34.40 | 30.34 | 0.306 | 436.6 | 369.4 | |
| 12.67 | 1.301 | 38.67 | 32.83 | 0.335 | 517.3 | 461.2 | |
| 45° | 10.72 | −0.537 | 28.12 | 27.58 | 0.284 | 363.4 | 337.1 |
| 12.13 | 0.027 | 32.73 | 31.95 | 0.302 | 387.1 | 362.3 | |
| 12.90 | 0.720 | 34.15 | 33.97 | 0.316 | 438.2 | 428.8 | |
| 90° | 10.24 | −2.525 | 19.81 | 31.84 | 0.269 | 330.0 | 326.9 |
| 12.26 | −1.237 | 25.10 | 34.99 | 0.339 | 376.2 | 374.6 | |
| 12.97 | −0.068 | 32.84 | 41.11 | 0.349 | 444.2 | 423.3 | |
| −45° | 11.02 | 1.246 | 32.92 | 21.22 | 0.267 | 373.1 | 359.7 |
| 12.69 | 2.458 | 36.32 | 22.97 | 0.285 | 406.7 | 385.3 | |
| 13.46 | 4.241 | 49.44 | 27.55 | 0.335 | 446.7 | 415.4 | |
| Monkey F | |||||||
| 0° | 12.62 | −5.670 | 11.19 | 24.29 | 0.399 | 520.6 | 530.0 |
| 13.91 | −4.194 | 13.08 | 27.35 | 0.441 | 554.8 | 585.4 | |
| 15.29 | −3.583 | 15.12 | 30.52 | 0.507 | 609.4 | 634.6 |
Discrimination threshold was quantified as half of the difference in motion strength corresponding to 75% and 25% T1 choices. Bias was quantified as the signed motion strength giving rise to 50% T1 choices. Negative values imply a bias towards the T1 choice. Bold items indicate that the bias was significantly different from zero (two-sided sign test, p < 0.05). The other five columns are the fit parameters of the drift-diffusion model (see Materials and Methods). Data in each column for each angle are presented as 25th/50th/75th percentiles across sessions.
To determine the caudate's role in perceptual decisions about motion direction, we examined 129 putative projection neurons whose activity was modulated during the dots task (n = 87 and 42 from monkeys C and F, respectively). These neurons showed a diversity of response properties with respect to motion strength, choice, and the timing of task-related activation. Most neurons were sensitive to choice in at least one task epoch (the presence of at least one nonwhite entry for almost all cells in Fig. 3A). Choice-dependent activity was more likely to be larger for choices associated with target locations contralateral to the recording sites (the dominance of warm- over cool-color entries in Fig. 3A). Most neurons were also sensitive to motion strength in at least one task epoch (the presence of at least one nonwhite entry for almost all cells in Fig. 3B). The sign and strength of coherence modulation, quantified as the sign of the slope value from a linear regression of average firing rate with coherence as the regressor and visually represented by different colors (Fig. 3B), varied from cell to cell (in rows), between trials with different choices for the same cell (first and second columns in the same panel), and across epochs within the same cell (across panels).
Of these diverse responses, we focused on three types of activity that relate to three computational elements necessary for effective perceptual decision making: evidence accumulation, evaluation, and choice bias. For all subsequent analyses, data are combined from the two monkeys, in which we found similar frequencies of occurrence of each response type: Fisher's exact test, p = 0.1116 and 0.1781 for the first two types of activity, respectively, and very low numbers of occurrence for bias activity in both monkeys.
Evidence accumulation: neural activity modulated by motion strength and choice
The first type of task-dependent caudate activity was modulated by both choice and motion strength, including choice-dependent modulation by motion strength (Fig. 3B, blue circles). This activity was evident in several task epochs, from after stimulus onset to after reward delivery, for different subsets of neurons. This activity likely contributes to generating the current decision and possibly choice-specific evaluation.
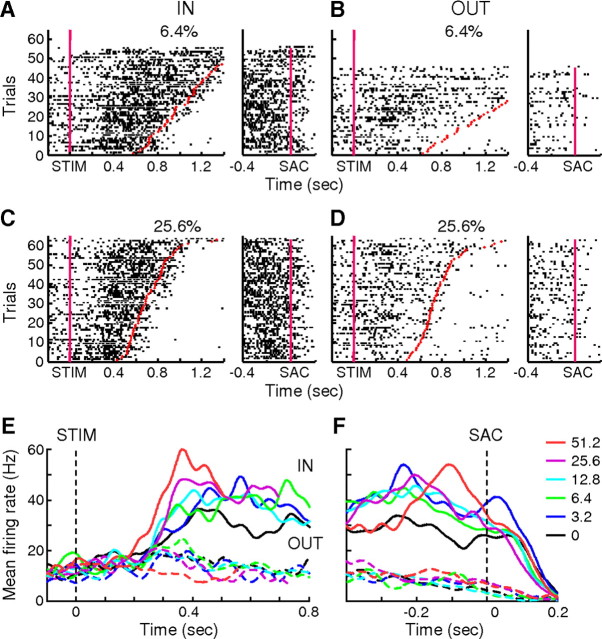
An example neuron with evidence accumulation activity in the Stim epoch is shown in Figure 4. When aligned on stimulus onset, the neuron's activity was larger when the visual motion was leftward than when the motion was rightward (Wilcoxon rank-sum test, H0: equal median responses for the two directions, p < 0.0001). Thus for this cell in the Stim epoch, trials in which the monkey correctly chose the left choice target were designated as IN trials, and trials in which monkey correctly chose the right choice target were designated as OUT trials. When collapsed across coherence levels, the activity began to differentiate between IN and OUT trials soon after stimulus onset (tchoice = 210 ms). On IN trials, the activity tended to build up more rapidly for higher coherences (Fig. 4E, solid lines) (linear regression slope of the rate of rise in activity vs coherence = 3.24 spikes/s2/%coh, H0: slope = 0, F = 7.87, p = 0.0025; slope of a linear regression of average firing rate during the Stim epoch vs coherence = 0.31 spikes/s/%coh, H0: slope = 0, F = 19.09, p < 0.0001). In contrast, on OUT trials, activity was less extensively modulated but tended to be smaller for higher coherences (Fig. 4E, dashed lines) (slope of a linear regression of average firing rate vs coherence = −0.14 spikes/s/%coh, F = 8.00, p = 0.005). When aligned on saccade onset, the neuron's activity did not converge to any particular value for either type of trials (Fig. 4F).
Figure 4.
Example neuron with evidence accumulation activity. A–D, Spike raster plots for correct trials with IN (see text; A, C) and OUT (B, D) choices at 6.4% (A, B) and 25.6% (C, D) coherence. For each panel, the left plot is aligned on motion stimulus onset, and the right plot is aligned on saccade onset. Trials are sorted by RT. Red markers indicate saccade onset. Note that the plots were truncated at 1.4 s after stimulus onset, and saccades occurred after this time in the top few trials in A and B. E, F, Spike-density functions (Gaussian kernel, σ = 20 ms) aligned on motion stimulus (E) and saccade (F) onset. Solid lines, IN trials; dashed lines, OUT trials. Colors correspond to different coherence levels, as indicated in F. Only correct trials were included. In E, spikes after 100 ms before saccade onset were excluded, and the spike-density functions were truncated at the median RT for each coherence level.
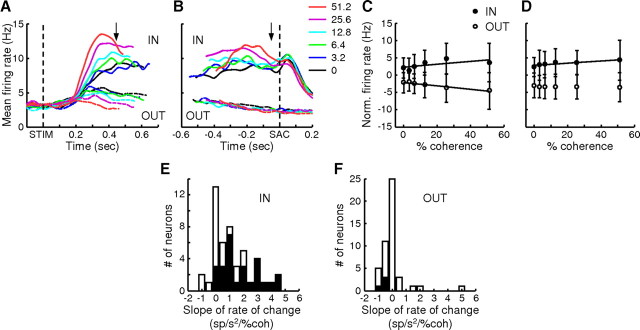
Across the population, 47 neurons (n = 37 and 10 for monkeys C and F, respectively) showed evidence accumulation activity in the Stim epoch (Fig. 5). Their activity became selective for choice with a median latency (tchoice) of 170 ms (interquartile range, or IQR: 142.5–225 ms) after stimulus onset. This latency is slightly shorter than comparable data from area LIP, and, also unlike LIP neurons, these caudate neurons did not show a noticeable dip in activity after stimulus onset (Roitman and Shadlen, 2002). Consistent with how these neurons were selected, the average firing rate during a 100 ms window before the median RT for each coherence level was positively modulated by coherence on IN trials and negatively modulated on OUT trials (slopes = 0.042 and −0.05 spikes/s/%coh, F = 8.90 and 15.85, p = 0.0031 and 0.0001, respectively) (Fig. 5C). In addition, the time course of activity on IN trials showed gradual, coherence-dependent changes, consistent with temporal accumulation of evidence. Across neurons, the rate of change of activity during the Stim epoch on IN trials was positively modulated by coherence with a median slope of 0.79 spikes/s2/%coh (two-sided sign test, p < 0.0001) (Fig. 5E). When tested in individual neurons, this effect was also significant in 26 out of 47 neurons with evidence accumulation activity in the Stim epoch. For OUT trials, the rate of change tended to be negatively modulated by coherence (median slope = −0.09 spikes/s2/%coh, p = 0.018), but the effects were variable and reached significance for only four neurons (Fig. 5F).
Figure 5.
Population summary of neurons with evidence accumulation activity. A, Population average of activity aligned on stimulus onset for correct trials (n = 47). Data for each choice (solid lines, IN trials; dashed lines, OUT trials) and coherence level (colors; see inset in B) were truncated at the median value of the mean RT measured under those conditions for all cells. Activity after 100 ms preceding saccade onset was excluded. B, Population average of activity aligned on saccade onset, plotted as in A. Activity within 200 ms of stimulus onset was excluded. C, D, Population average (mean ± SEM) of normalized firing rate as a function of coherence in 100 ms windows before the median RT (arrow in A, which indicates only an approximate time because of session-by-session variability in mean RT) and before saccade onset (arrow in B), respectively. For each neuron, the firing rate in an epoch was normalized by the average rate across all trial conditions in the same epoch. Filled circles, IN trials; open circles, OUT trials. Lines are linear fits with slopes that were significantly different from zero (p < 0.05). E, F, Histograms of the slope of the rate of change in activity during motion viewing for IN (E) and OUT (F) trials. Solid bars, F test, H0: slope = 0, p < 0.05.
According to the drift-diffusion model, incoming motion information and noise together govern the rate of rise of the decision variable, which, in turn, determines RT (Gold and Shadlen, 2007). Thus, the model predicts that for IN trials, the rate of rise should be inversely related to RT, regardless of coherence, and directly related to motion strength, but only insofar as coherence is related to RT. Evidence accumulation activity in caudate was roughly consistent with these predictions. Specifically, when tested separately for each coherence, evidence accumulation activity during the Stim epoch was negatively correlated with RT on IN trials and positively correlated with RT on OUT trials, for all but the highest coherence [which had a more restricted range of RTs (Table 2)]. Moreover, when tested separately for restricted ranges of RTs, the activity was not correlated with coherence, with a single exception for IN trials with long RTs (Table 3). Thus, the sensitivity of evidence accumulation activity to coherence and RT was consistent with a role in decision formation and not simply a reflection of motion stimulus itself.
Table 2.
Summary statistics of regression analyses on average spike rate in the Stim epoch as a function of RT at different coherence levels
| %Coherence | Slope (IN) | p value | Slope (OUT) | p value |
|---|---|---|---|---|
| 3.2 | −3.2893 | 0.0003 | −0.1431 | 0.0114 |
| −1.1682 | 0.6784 | |||
| −0.0151 | 3.2178 | |||
| 6.4 | −6.7167 | <0.0001 | 0.0406 | 0.0001 |
| −2.3962 | 1.5034 | |||
| −0.4519 | 4.3676 | |||
| 12.8 | −6.1534 | <0.0001 | 0.0107 | 0.0002 |
| −3.3326 | 1.2861 | |||
| −1.0527 | 2.8467 | |||
| 25.6 | −7.7495 | <0.0001 | −0.5121 | 0.2327 |
| −3.1566 | 0.5035 | |||
| −1.1720 | 4.2784 | |||
| 51.2 | −5.2061 | 0.1038 | −1.1507 | 0.4408 |
| −0.6361 | 0.1980 | |||
| 2.6834 | 3.8204 |
Data in “Slope (IN)” and “Slope (OUT)” columns are in units of spikes/s2 and presented as 25th/50th/75th percentiles across neurons. p values are from two-sided sign test (H0: slope = 0). Bold items: p < 0.05.
Table 3.
Summary statistics of regression analyses on average spike rate in the Stim epoch as a function of coherence for trials with different RTs
| RT groups (ms) | Slope (IN) | p value | Slope (OUT) | p value |
|---|---|---|---|---|
| 500–700 | −0.0375 | 0.766 | −0.0201 | 0.8776 |
| 0.0053 | 0 | |||
| 0.044 | 0.0171 | |||
| 700–900 | −0.0142 | 0.0541 | −0.0303 | 0.6516 |
| 0.0365 | −0.0054 | |||
| 0.0779 | 0.0112 | |||
| 900–1100 | −0.0991 | 1 | −0.0786 | 0.4408 |
| 0.0089 | −0.0063 | |||
| 0.0661 | 0.0923 | |||
| 1100–1300 | −0.0342 | 0.0895 | −0.1269 | 0.2153 |
| 0.0766 | −0.0356 | |||
| 0.1759 | 0.0163 | |||
| 1300–1500 | −0.3505 | 0.0347 | −0.0765 | 0.5572 |
| −0.0435 | −0.0084 | |||
| 0.0992 | 0.1167 |
Data in “Slope (IN)” and “Slope (OUT)” columns are in units of spikes/s/%coh and presented as 25th/50th/75th percentiles across neurons. p values are from two-sided sign test (H0: slope = 0). Bold items: p < 0.05.
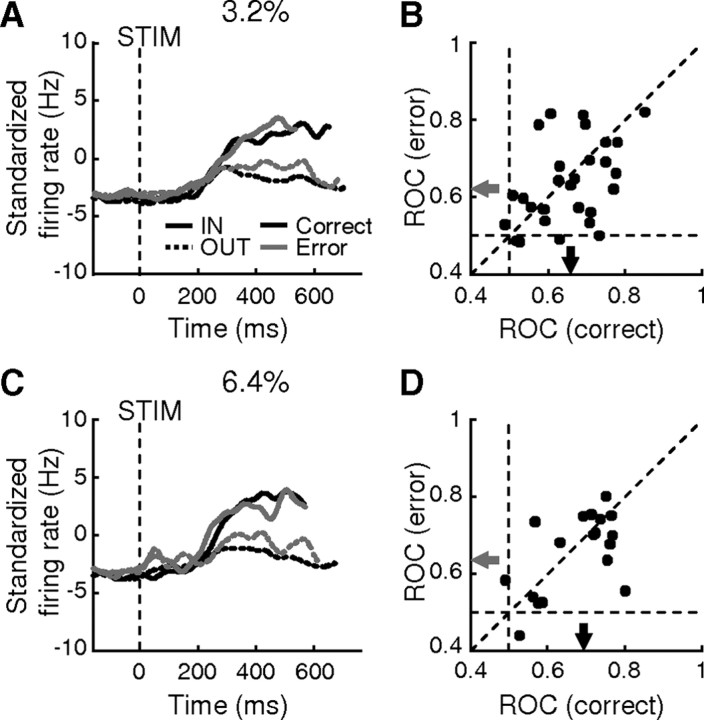
Consistent with this idea, evidence accumulation activity tended to reflect the direction of the monkey's choice and not simply the direction of the motion stimulus, which differed on error trials (Fig. 6). When the monkey chose the IN target (Fig. 6A,C, solid lines), activity was high regardless of whether the stimulus was moving toward (black lines, corresponding to correct trials) or away from (gray lines, error trials) that target. In contrast, when the monkey chose the OUT target (dashed lines), activity was lower regardless of whether the actual stimulus direction was toward (black lines, correct trials) or away from (gray lines, error trials) that target. To quantify these observations, we computed an ROC index comparing activity for IN versus OUT trials in a 400 ms window, separately for individual cells and for correct and error trials (using only trials with 3.2% or 6.4% coherence, which provided sufficient numbers of error trials). The value of this index tended to be >0.5, implying that for both correct and error trials, responses were greater for IN than for OUT choices (Fig. 6B,D). Furthermore, the value of the ROC index tended to be smaller on error than on correct trials (Fig. 6B,D) (Wilcoxon paired signed rank test, H0: equal median, p = 0.0265 and 0.0002, for 3.2% and 6.4% coherence, respectively), which is consistent with the idea that the evidence that drives the decision variable in a drift-diffusion-type process tends to be noisier and therefore weaker on error trials.
Figure 6.
Comparison of evidence accumulation activity for error and correct trials with weak motion strength. A, C, Population average of activity from 32 neurons with positive slopeIN for correct (black) and error (gray) trials. Solid lines, IN choices; dashed lines, OUT choices. Data were truncated at the median value of the mean RT measured under each condition for each neuron and standardized by subtracting the average firing rate 200–600 ms after stimulus onset for all trials for each neuron. B, D, Scatter plot of the ROC indices for 3.2% (B) and 6.4% (D) coherence trials. The ROC index was computed comparing the average firing rate 200–600 ms after stimulus onset, excluding activity within 100 ms of saccade onset, for IN versus OUT choices. Values >0.5 indicate greater responses for IN choices. Arrows indicate median values for correct (black) and error (gray) trials. Note that there are fewer data points in D because of fewer sessions with sufficient number of error trials at 6.4% coherence.
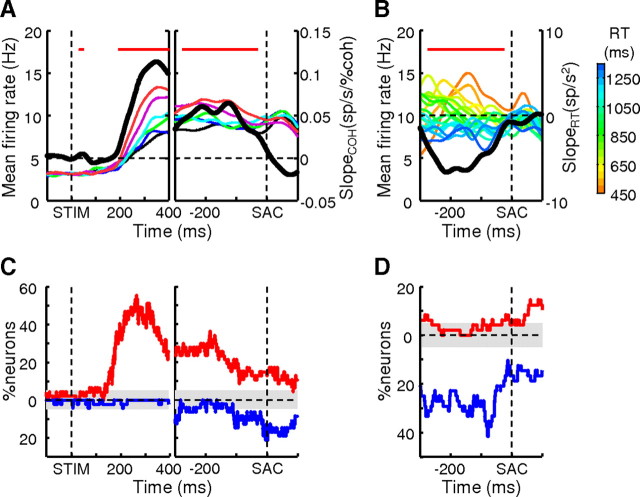
Unlike the drift-diffusion models or LIP activity just before saccade onset, however, the average activity of these caudate neurons did not appear to rise to a common value just before saccade onset (Ratcliff and Rouder, 1998; Roitman and Shadlen, 2002). This observation was confirmed by several quantitative measures. First, population activity in the Sac epoch remained weakly modulated by coherence for IN trials (slope = 0.03 spikes/s/%coh, F = 5.04, p = 0.026; for OUT trials: slope = −0.0065 spikes/s/%coh, F = 0.28, p = 0.60) (Fig. 5B,D). Second, activity of both the population and individual neurons tended to be positively modulated by coherence throughout the Stim epoch, regardless of whether the data were aligned to stimulus or saccade onset (Fig. 7A,C). The drift-diffusion model, on the contrary, predicts that activity at higher coherences rises faster to the bound, resulting in a positive correlation with activity when aligned to stimulus onset but a negative correlation with activity when aligned to response onset [for an example of neural activity reaching a bound, see Roitman and Shadlen (2002), their Fig. 8A]. Third, we conducted the same analyses but with data grouped by RT, not coherence. We found a primarily negative relationship between RT (which is inversely related to coherence) and Stim epoch activity aligned to response onset, contrary to the model prediction (Fig. 7B,D). Fourth, to detect the presence of a bound crossing in the activity of individual neurons, we used the following criteria: a negative slope in the relationship between coherence and neuronal activity at −300 to −200 ms relative to saccade onset and zero slope at −100 to 0 ms relative to saccade onset. Only 4 out of 47 neurons met these criteria, not significantly above a 5% chance level (binomial cumulative probability, p = 0.0845). Thus, although a subset of caudate neurons reflected the process of evidence accumulation, they did not appear to reflect the commitment to a categorical decision (i.e., threshold crossing), as has been reported for other brain areas like LIP and FEF (Hanes and Schall, 1996; Roitman and Shadlen, 2002).
Figure 7.
Evidence accumulation activity in the Stim epoch did not converge at a decision bound. A, Regression slope values (thick black lines, right axes) of population average spike density function (color lines, see legends in Fig. 5B, left axes, σ = 20 ms) aligned on stimulus (left panel) and saccade (right panel) onset, with coherence as the regressor for each 1 ms time bin. Colors indicate coherence levels. Red bars on top indicate time bins in which t test of H0: slope = 0 returned p < 0.05. B, Regression slope values of population average activity aligned on saccade onset, with RT as the regressor. Colors indicate the starting value of each RT bin (bin size 50 ms). The same conventions are used as in A. C, Percentage of neurons with a significant slope from the regression with coherence in the given time bin. Red, Positive slopes; blue, negative slopes; gray areas indicate 5% (chance level for p = 0.05). D, Percentage of neurons with a significant slope from regression with RT in the given time bin. The same conventions are used as in C.
Figure 8.
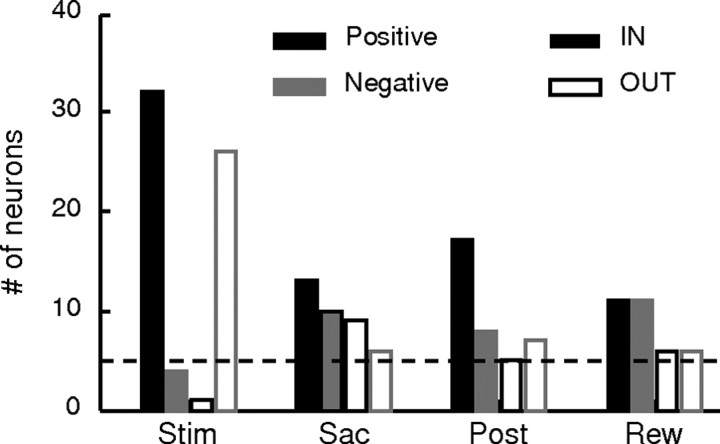
Histogram of neurons showing evidence accumulation activity for each task epoch. Dashed line indicates 5%.
We also observed evidence accumulation activity (i.e., coherence and choice dependent) in the Sac, Post, and Rew epochs in 76 neurons (n = 54 and 22 for monkeys C and F, respectively) (Figs. 3B, 8). In our sample, across all epochs, positive modulation was more prevalent on IN trials and negative modulation was more prevalent on OUT trials (χ2 test, p = 0.0001 and 0.0031 for IN and OUT trials, respectively). Within the Stim and Post epochs, positive modulation was more prevalent on IN trials than on OUT trials (χ2 test, p < 0.0001 and p = 0.0076, respectively), whereas in the Sac and Rew epochs, the balance between positive and negative modulation was similar for both choices (p = 0.73 and p = 1.00, respectively). Thus, even after the decision was formed, the caudate continued to encode both the decision and the strength of the sensory evidence used to form the decision, until after the trial outcome was completed.
Evaluation: neural activity modulated by motion strength similarly for both choices
The second type of activity was also modulated by coherence, but unlike the first type, had similar coherence modulation for the two choices. This activity also appeared in several task epochs, from motion viewing to reward delivery. This activity likely contributes to predicting and evaluating outcomes, possibly independent of choice.
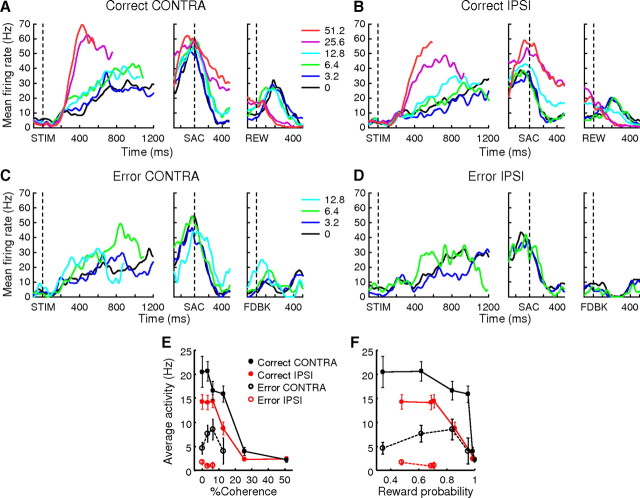
An example neuron is shown in Figure 9. This neuron was responsive from soon after stimulus onset until after reward delivery. On correct trials (Fig. 9A,B), Stim, Sac, and Rew epoch activity was slightly larger for contralateral than for ipsilateral choices (two-sided rank sum test, H0: equal median responses for the two choices, p < 0.0001), but not during the Post epoch (p = 0.09). Stim epoch activity was modulated positively by coherence for both contralateral and ipsilateral choices (slope = 0.59 and 0.43 spikes/s/% coh, H0: slope = 0, F = 103.70 and 121.24, respectively, p < 0.0001). This choice-independent, positive coherence modulation continued through the time of the saccade (slope = 0.18 and 0.45 spikes/s/% coh, F = 7.65 and 65.70, p = 0.0061 and p < 0.0001 for the two choices, respectively) and into the postsaccade period (slope = 0.60 and 0.52 spikes/s/% coh, F = 154.24 and 121.78 for the two choices, respectively, p < 0.0001). After reward onset, the sign of coherence modulation reversed, with stronger responses on low-coherence trials (slope = −0.25 and −0.14 spikes/s/% coh, F = 120.85 and 69.38 for the two choices, respectively, p < 0.0001) (Fig. 9E).
Figure 9.
Example neuron with evaluation activity. A–D, Spike-density functions (Gaussian kernel, σ = 20 ms) for correct (A, B) and error (C, D) trials for CONTRA (A, C) and IPSI (B, D) choices. Colors indicate coherence (see inset in A). For each panel, the three plots show activity aligned on onsets of motion stimulus, saccade, and either reward (REW) or error feedback (FDBK), respectively. E, F, Average activity of the example neuron in the 150–400 ms window after reward/error feedback (mean ± SEM) as a function of percentage coherence (E) and reward probability estimated from monkey's behavior (F) in the recording session.
This coherence-dependent activity at the end of the trial (in the Rew epoch) reflected both the predicted and actual outcome. For correct (rewarded) trials, this activity was inversely related to the probability of reward, computed from the coherence-dependent performance in the same recording session (Fig. 9F). The activity for error trials was comparable to the activity on correct trials in the Stim and Sac epochs (Fig. 9C,D). However, after visual error feedback indicating that no reward would be delivered, activity was briefly suppressed. The relationship between postfeedback activity and motion coherence/reward probability was not consistent (Fig. 9E,F, open symbols), possibly due to smaller number of error trials and/or floor effect. Nevertheless, these features are consistent with a representation of reward prediction error: reward expectation was computed during motion viewing based on the strength of the sensory evidence, maintained during the delay after a decision was made, and then compared to the actual outcome (Sutton and Barto, 1998).
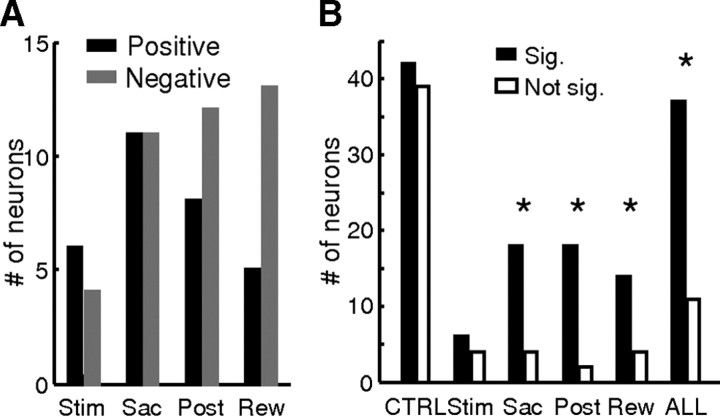
Across the population, 48 neurons (n = 36 and 12 for monkeys C and F, respectively) showed evaluation activity, in a single or multiple task epochs, with the exact pattern varying considerably (Fig. 3B, red circles). Both positive and negative coherence modulations were observed with similar overall prevalence across task epochs (n = 30 and 40, respectively) (Fig. 10A). However, the distribution of each kind of modulation in particular task epochs differed (χ2 test, p = 0.028): positive modulation was observed slightly more frequently in the Stim epoch, whereas negative modulation was observed more frequently in the Post and Rew epochs.
Figure 10.
Population summary of evaluation activity. A, Histogram of neurons with evaluation activity in different task epochs. B, Number of neurons responding significantly differently (solid bars) and not differently (open bars) to outcome-indicating cues (reward onset for correct trials and feedback onset for error trials, Wilcoxon rank-sum test, p < 0.05). CTRL, Neurons without evaluation activity; Stim, Sac, Post, and Rew, neurons with evaluation activity in the corresponding epoch. ALL, Neurons with evaluation activity in any epoch. *The proportion of significant neurons differs from CTRL (χ2 test, p < 0.05).
Consistent with a possible evaluative role, neurons with this kind of activity tended to respond differently to the actual feedback (correct or error) received at the end of the trial (Fig. 10B). To control for possible differential responses due to more trivial reasons, such as licking, auditory solenoid/tone onset, and the presence of return saccades, we compared the proportion of neurons with a significant difference between reward and feedback responses between two groups: those with evaluation activity (ALL) and those without evaluation activity (CTRL). This analysis revealed a significantly larger proportion of neurons with evaluation activity showing different reward and feedback responses (χ2 test, p = 0.0005). The proportion was also significantly larger if we limited our analysis to neurons with evaluation activity only in the Sac, Post, or Rew epochs (p = 0.0049, 0.0006, and 0.0277, respectively).
Bias: neural activity before motion onset that is predictive of choice
The third type of activity emerged before motion stimulus onset and was predictive of monkey's choice, especially when motion evidence was weak. This activity likely represents an initial choice bias that combines with incoming sensory evidence to form a decision.
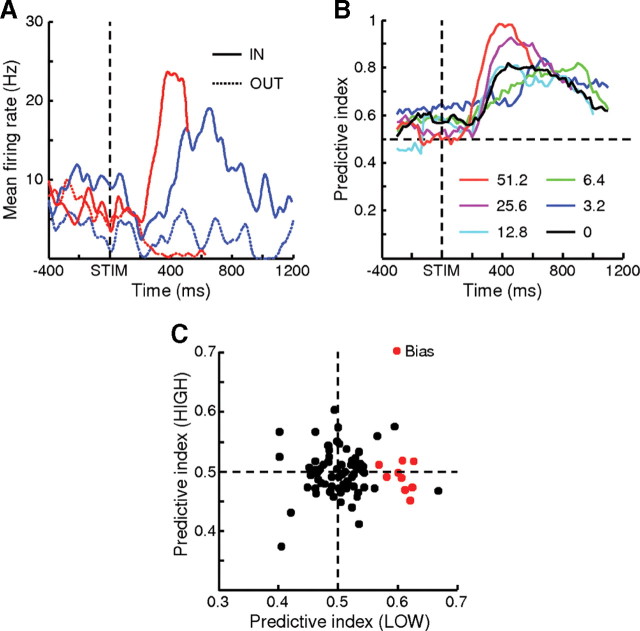
An example neuron with bias activity is shown in Figure 11, A and B. This neuron was classified as exhibiting evidence accumulation activity in the Stim epoch. Here we show that its activity before motion onset (in the Pre epoch) was also choice dependent. On 3.2% coherence trials (Fig. 11A, blue), the neuron tended to be more active when monkey ultimately chose the IN choice target than when he chose the OUT choice target (compare solid and dotted blue lines). In other words, on trials in which prestimulus activity of this neuron was high, the monkey was predisposed to make an IN choice. In contrast, prestimulus activity did not distinguish between choices on high-coherence trials (Fig. 11A, red). Thus, when sorted by choice, Pre epoch activity on trials in which weak sensory evidence was presented tended to be higher when the monkey ultimately made an IN choice versus an OUT choice.
Figure 11.
Bias activity. A, Activity of an example neuron before and during motion viewing on correct trials. For clarity, only 3.2% (blue) and 51.2% (red) coherence are shown. Note that the activity before stimulus onset was different between trials with different final choices (solid vs dashed lines) at 3.2% coherence, but not at 51.2% coherence. B, Predictive index of the example neuron's activity, computed separately for different coherence (colors, as indicated) in sliding 200 ms bins (20 ms steps). Values >0.5 indicate that the neural activity was predictive of the monkey's choice. Activity was aligned to stimulus onset. C, Scatter plot of predictive indices for low- (3.2% and 6.4%) versus high- (25.6% and 51.2%) coherence trials, computed using the average spike rate in the Pre epoch. Red symbols indicate cells with bias activity.
To assess quantitatively the Pre epoch activity's choice selectivity, we computed an ROC-based predictive index (Fig. 11B). For this quantity, a value of 0.5 implies that the activity is not predictive of the monkey's choice (e.g., at stimulus onset on 51.2% coherence trials). A value of 1.0 implies that the activity fully predicts the monkey's choice (e.g., before saccade onset on 51.2% coherence trials). Consistent with a representation of choice bias, the Pre epoch activity of the example neuron had predictive indices larger than 0.5 for low-coherence trials (0–12.8% coherence, bootstrap method, p < 0.05). In contrast, predictive indices were ∼0.5 for high-coherence trials, in which the strong motion evidence dominates the decision process and thus overwhelms any relationship between prestimulus activity and the monkey's final choice. The average predictive index in the 400 ms window before stimulus onset was negatively related to coherence (slope from a linear regression with coherence as the regressor = −0.0021/%coh, H0: slope = 0, F = 10.84, p = 0.046).
In our samples, 79 neurons showed statistically significant choice-dependent activity in the Stim epoch, out of which 9 neurons had a predictive index in the Pre epoch that was significantly greater than 0.5 on trials with low, but not high, coherence (5 in monkey C and 4 in monkey F, bootstrap method, p < 0.05) (Figs. 3, 11C). Although these neurons were encountered infrequently (11%), their occurrences were significantly above a 5% chance level (binomial cumulative probability, p = 0.006). Furthermore, six of these neurons also showed evidence accumulation activity in the Stim epoch (Fig. 3B), supporting the idea that the bias activity contributes to actual decision formation. The remaining three neurons showed choice-dependent, but not coherence-modulated, activity in the Stim epoch. None showed evaluation activity in any epoch.
Caudate activity is task dependent
In LIP, the only other neural structure examined with the RT version of the dots task used here, neural activity reflecting evidence accumulation was observed exclusively in neurons with memory-period activity during a MGS task (Roitman and Shadlen, 2002). In other words, for LIP, neural responses on the MGS task are highly predictive of neural responses on the dots task. We did not observe such a tight link for caudate neurons.
On the contrary, we found that caudate activity can differ considerably between the two tasks. We encountered a substantial number of neurons that responded on only one task. In monkey C, for which the MGS task was also used to search for neurons, we encountered 11 neurons with activity that was modulated on the MGS, but not dots, task. Of the 74 neurons that were recorded on both tasks, 15 neurons showed modulated activity on the dots, but not the MGS, task. Of the 59 neurons modulated on both tasks, 41 had responses that were selective for the spatial location of the saccade target. In most of these cases, the spatial preferences tended to be congruent across tasks. For example, the choice target/motion direction associated with larger activity in the Stim epoch of the dots task also tended to elicit larger responses during the visual (“V”) epoch of the MGS task (Fig. 12B, similar colors in the two corresponding columns).
We found no clear relationship between particular patterns of activation on the MGS task and evidence-accumulation and evaluation activity on the dots task. Figure 12, C and D, shows response profiles from the MGS task plotted separately for neurons with the two types of activity in different dots task epochs. In this display, direction-modulated activity is shown in red and task-modulated but nondirectional activity is shown in black. Rows with only white entries across columns visually represent a subset of cells that were modulated on the dots, but not the MGS, task. The ratio of red-to-black entries visually represents the prevalence of spatial selectivity in task-modulated activity. This ratio tended to be higher for neurons with evidence accumulation activity (1.6, 1.3, 1.6, and 2.2 for epochs V, M, S, and R, respectively) (Fig. 12C) than for neurons with evaluation activity (0.7, 0.5, 1.0, and 0.4, respectively) (Fig. 12D), suggesting that the former neuron group was more likely to show spatially selective activity on the MGS task. Beyond this general trend, there was no other clear pattern to the relationship between MGS responses and dots responses, consistent with a previous report of the context dependence of caudate activity (Hikosaka et al., 1989).
Distribution of neurons in caudate
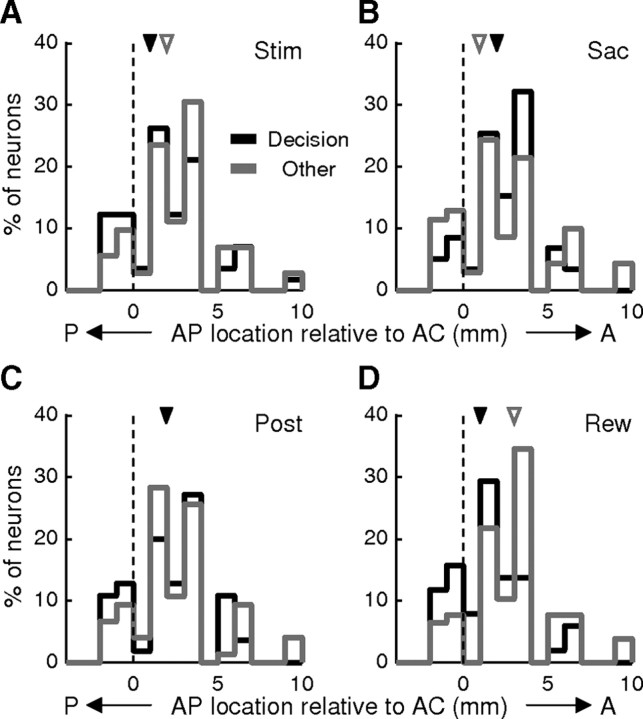
The caudate receives inputs from multiple cortical areas, including LIP, FEF, and SEF (Stanton et al., 1988; Saint-Cyr et al., 1990; Parthasarathy et al., 1992; Calzavara et al., 2007). The terminal fields of these inputs cover partially overlapping regions within the caudate, but with a coarse topographical pattern along the anterior–posterior (AP) axis. We examined whether our neuronal data were sensitive to this topography by comparing spatial distributions of recording sites corresponding to two groups of neurons: those with either evidence accumulation or evaluation activity, versus those without either category of activity (Fig. 13). We found that these distributions almost completely overlapped for the Stim, Sac, and Post epochs. In contrast, decision-related activity during the Rew epoch was observed in neurons located slightly more posterior than neurons without such activity, but the distributions still overlapped strongly (Fig. 13D) (median: AC+1 and AC+3, respectively; Wilcoxon rank sum test, p = 0.0004). The median AP locations associated with evidence accumulation and evaluation activity across epochs were not significantly different (data not shown, Wilcoxon rank sum test, p = 0.2146). Thus, evidence accumulation and evaluation activity was present in neurons distributed widely along the AP axis.
Figure 13.
Distribution of neurons along the AP axis. A–D, Histograms of AP locations for neurons relative to the anterior commissure (AC) with decision-related activity (black) and those without decision-related activity (gray) in the Stim (A), Sac (B), Post (C), and Rew (D) epochs. Triangles indicate the median values.
Discussion
We trained two monkeys to perform a direction-discrimination task that required them to decide the direction of random-dot motion and indicate their decision with a saccadic eye movement. As has been reported previously, their behavior was well described by a model of decision making that assumes sensory evidence is accumulated over time until reaching a fixed bound (Palmer et al., 2005; Hanks et al., 2006). Correlates of certain aspects of this decision process have been identified in single-neuron activity in several parts of the brain involved in preparing the saccadic response, including areas LIP and FEF in cortex and the SC in the brainstem. Here we show that the caudate nucleus, a primary input structure to an important basal ganglia pathway that connects these cortical and subcortical brain regions, encodes an even broader diversity of decision-related signals.
For convenience, we categorized these decision-related signals into three types. “Evidence accumulation” activity was modulated by both choice and motion strength and was, at least in part, consistent with a process of converting the incoming sensory evidence into a categorical choice. “Evaluation” activity was modulated by motion strength similarly for the two choices, consistent with an ongoing measure of choice confidence or reward prediction. “Bias” activity emerged before motion stimulus onset, predicted the monkey's final choice when motion evidence was weak, and likely reflected a choice bias. These diverse types of activity suggest that the basal ganglia pathway can provide necessary signals for integrating sensory and nonsensory factors to facilitate flexible decision making.
Evidence accumulation activity during the Stim epoch showed several similarities with previously demonstrated neural correlates of evidence accumulation in LIP, FEF, and SC (Shadlen et al., 1996; Horwitz and Newsome, 1999; Kim and Shadlen, 1999; Shadlen and Newsome, 2001). All showed spatial selectivity, positive modulation by motion strength on IN choice trials, and negative modulation on OUT choice trials. The relative roles of these different brain regions in this process are not yet understood, at least in part because they have not all been tested under identical conditions. Accordingly, in this study we used a reaction-time task to facilitate direct comparisons with data from LIP measured in monkeys performing the same task (Roitman and Shadlen, 2002). The most striking difference we found was the nature of evidence accumulation activity just before saccade onset. In LIP, decision-related activity tends to reach a common level at this time, independent of the strength of evidence or amount of time used to form the decision. In contrast, caudate activity did not converge to a particular activity level and instead tended to peak during the Stim epoch, well before saccade onset, then maintained coherence modulation until the saccade. In the accumulation-to-bound framework, the common, peak activity level in LIP before saccade onset was interpreted as a neural representation of a decision bound associated with the IN choice, which when reached represented a commitment to this choice. The lack of a similar bound suggests that caudate does not encode the commitment to a decision, despite possibly contributing to the evidence-accumulation process via the basal ganglia pathway to downstream SC. Activity in FEF and SC has not yet been tested under comparable conditions.
The coherence-dependent responses we found likely play evaluative roles in the goal-directed decision process. In a positive reinforcement-based paradigm like we used, evaluation likely encodes reward expectation or uncertainty (Sutton and Barto, 1998; Fiorillo et al., 2003; Kepecs et al., 2008; Kiani and Shadlen, 2009). Using experimental paradigms with explicit manipulations of the association of suprathreshold visual stimuli, actions, and reward outcomes, previous studies of oculomotor caudate have demonstrated two neural representations of reward expectation, one sensitive and the other insensitive to the spatial location of the visual and/or saccade target (Kawagoe et al., 1998, 2004; Ding and Hikosaka, 2006; Lau and Glimcher, 2008). Evidence accumulation and evaluation activity in our study are reminiscent of these two forms of reward expectation signals, respectively. Extending these previous results, we show for the first time that these evaluation signals can be derived from mappings between reward outcome and uncertain sensory inputs. The diverse timing of evidence accumulation and evaluation activity throughout a trial suggests that information about the accumulated sensory evidence is monitored and evaluated continuously. Such information could be provided by cortical regions such as LIP, FEF, and other parts of the prefrontal cortex, all of which project directly to caudate (Stanton et al., 1988; Saint-Cyr et al., 1990; Parthasarathy et al., 1992; Calzavara et al., 2007). It would be interesting to examine these structures at the same time to elucidate the temporal relationship between their task-driven responses.
The bias activity represents a correlate of perceptual choice bias at the single-neuron level. In a simple accumulation-to-bound model with two alternatives, choice behavior is typically governed by three parameters: the starting value at the onset of accumulation, the rate of accumulation, and the height of the decision bounds (adjustments of which can, under some conditions, be equivalent to adjustments of the starting value). Changes in these parameters have been used to explain speed–accuracy tradeoffs and some reward-biased decisions (Reddi and Carpenter, 2000; Voss et al., 2004; Palmer et al., 2005; Diederich and Busemeyer, 2006; Feng et al., 2009). Bias activity in caudate, emerging before motion stimulus onset, can be thought of as representing a nonzero starting value at the onset of accumulation. This mechanism effectively reduces the amount of the evidence needed to reach one decision bound, while increasing the amount of evidence needed to reach the other bound, thereby creating a choice bias.
This signal may be related to previous reports of bias-related activity in caudate and FEF that are present before an unequivocal reward-predicting cue (Coe et al., 2002; Lauwereyns et al., 2002a,b; Ding and Hikosaka, 2006), or to activity in SC and FEF that reflects preparation for a saccade that will occur with a certain probability (Basso and Wurtz, 1997; Dorris and Munoz, 1998). We extended these results by showing that such activity can be present when a noisy sensory cue must be used to predict reward, implying interactions between perceptual decision-making and reward-prediction processes. Because our task used equal reward for all correct decisions and balanced presentation of motion stimuli with different directions, maintaining a choice bias was not an optimal strategy, which likely contributed to the low occurrences of bias-encoding neurons in our sample. Examination of the bias-related signals under conditions that induce stronger behavioral biases, for example, with unequal rewards (Feng et al., 2009; Rorie et al., 2010) or prior probability, could help to elucidate how the brain optimizes the decision process and whether different factors bias decisions by common mechanisms.
In summary, we observed single-neuron activity in caudate that encodes multiple computations related to perceptual decision making: evidence accumulation for a choice, evaluation of the quality of evidence, and a bias in the initial state of the decision process. These results suggest that interactions between both sensory and nonsensory factors used to generate and evaluate perceptual decisions might involve both the corticofugal and corticobasal ganglia pathways. The two parallel pathways could serve synergistically to shape and maintain a decision process that is appropriate to help achieve particular behavioral goals.
Footnotes
This work was supported by the National Institutes of Health (K99EY018042 to L.D.) and the McKnight Endowment Fund for Neuroscience, Sloan Foundation, and Burroughs-Wellcome Fund (J.I.G.). We thank Jeff Law, Matt Nassar, Takahiro Doi, and Okihide Hikosaka for helpful advice and comments; Rishi Kalwani for assistance with MR images; Benjamin Heasly for hardware and software support; Timothy Hanks and Michael Shadlen for assistance with the drift-diffusion model; Jamie Roitman for advice on behavioral training; and Jean Zweigle for excellent animal care.
References
- Basso MA, Wurtz RH. Modulation of neuronal activity by target uncertainty. Nature. 1997;389:66–69. doi: 10.1038/37975. [DOI] [PubMed] [Google Scholar]
- Bogacz R, Gurney K. The basal ganglia and cortex implement optimal decision making between alternative actions. Neural Comput. 2007;19:442–477. doi: 10.1162/neco.2007.19.2.442. [DOI] [PubMed] [Google Scholar]
- Bogacz R, Brown E, Moehlis J, Holmes P, Cohen JD. The physics of optimal decision making: a formal analysis of models of performance in two-alternative forced-choice tasks. Psychol Rev. 2006;113:700–765. doi: 10.1037/0033-295X.113.4.700. [DOI] [PubMed] [Google Scholar]
- Calzavara R, Mailly P, Haber SN. Relationship between the corticostriatal terminals from areas 9 and 46, and those from area 8A, dorsal and rostral premotor cortex and area 24c: an anatomical substrate for cognition to action. Eur J Neurosci. 2007;26:2005–2024. doi: 10.1111/j.1460-9568.2007.05825.x. [DOI] [PMC free article] [PubMed] [Google Scholar]
- Carpenter RH, Williams ML. Neural computation of log likelihood in control of saccadic eye movements. Nature. 1995;377:59–62. doi: 10.1038/377059a0. [DOI] [PubMed] [Google Scholar]
- Coe B, Tomihara K, Matsuzawa M, Hikosaka O. Visual and anticipatory bias in three cortical eye fields of the monkey during an adaptive decision-making task. J Neurosci. 2002;22:5081–5090. doi: 10.1523/JNEUROSCI.22-12-05081.2002. [DOI] [PMC free article] [PubMed] [Google Scholar]
- Diederich A, Busemeyer JR. Modeling the effects of payoff on response bias in a perceptual discrimination task: bound-change, drift-rate-change, or two-stage-processing hypothesis. Percept Psychophys. 2006;68:194–207. doi: 10.3758/bf03193669. [DOI] [PubMed] [Google Scholar]
- Ding L, Hikosaka O. Comparison of reward modulation in the frontal eye field and caudate of the macaque. J Neurosci. 2006;26:6695–6703. doi: 10.1523/JNEUROSCI.0836-06.2006. [DOI] [PMC free article] [PubMed] [Google Scholar]
- Dorris MC, Munoz DP. Saccadic probability influences motor preparation signals and time to saccadic initiation. J Neurosci. 1998;18:7015–7026. doi: 10.1523/JNEUROSCI.18-17-07015.1998. [DOI] [PMC free article] [PubMed] [Google Scholar]
- Feng S, Holmes P, Rorie A, Newsome WT. Can monkeys choose optimally when faced with noisy stimuli and unequal rewards? PLoS Comput Biol. 2009;5:e1000284. doi: 10.1371/journal.pcbi.1000284. [DOI] [PMC free article] [PubMed] [Google Scholar]
- Fiorillo CD, Tobler PN, Schultz W. Discrete coding of reward probability and uncertainty by dopamine neurons. Science. 2003;299:1898–1902. doi: 10.1126/science.1077349. [DOI] [PubMed] [Google Scholar]
- Gold JI, Shadlen MN. The neural basis of decision making. Annu Rev Neurosci. 2007;30:535–574. doi: 10.1146/annurev.neuro.29.051605.113038. [DOI] [PubMed] [Google Scholar]
- Hanes DP, Schall JD. Neural control of voluntary movement initiation. Science. 1996;274:427–430. doi: 10.1126/science.274.5286.427. [DOI] [PubMed] [Google Scholar]
- Hanks TD, Ditterich J, Shadlen MN. Microstimulation of macaque area LIP affects decision-making in a motion discrimination task. Nat Neurosci. 2006;9:682–689. doi: 10.1038/nn1683. [DOI] [PMC free article] [PubMed] [Google Scholar]
- Hikosaka O, Sakamoto M, Usui S. Functional properties of monkey caudate neurons. I. Activities related to saccadic eye movements. J Neurophysiol. 1989;61:780–798. doi: 10.1152/jn.1989.61.4.780. [DOI] [PubMed] [Google Scholar]
- Hikosaka O, Nakamura K, Nakahara H. Basal ganglia orient eyes to reward. J Neurophysiol. 2006;95:567–584. doi: 10.1152/jn.00458.2005. [DOI] [PubMed] [Google Scholar]
- Horwitz GD, Newsome WT. Separate signals for target selection and movement specification in the superior colliculus. Science. 1999;284:1158–1161. doi: 10.1126/science.284.5417.1158. [DOI] [PubMed] [Google Scholar]
- Huk AC, Shadlen MN. Neural activity in macaque parietal cortex reflects temporal integration of visual motion signals during perceptual decision making. J Neurosci. 2005;25:10420–10436. doi: 10.1523/JNEUROSCI.4684-04.2005. [DOI] [PMC free article] [PubMed] [Google Scholar]
- Kawagoe R, Takikawa Y, Hikosaka O. Expectation of reward modulates cognitive signals in the basal ganglia. Nat Neurosci. 1998;1:411–416. doi: 10.1038/1625. [DOI] [PubMed] [Google Scholar]
- Kawagoe R, Takikawa Y, Hikosaka O. Reward-predicting activity of dopamine and caudate neurons—a possible mechanism of motivational control of saccadic eye movement. J Neurophysiol. 2004;91:1013–1024. doi: 10.1152/jn.00721.2003. [DOI] [PubMed] [Google Scholar]
- Kepecs A, Uchida N, Zariwala HA, Mainen ZF. Neural correlates, computation and behavioural impact of decision confidence. Nature. 2008;455:227–231. doi: 10.1038/nature07200. [DOI] [PubMed] [Google Scholar]
- Kiani R, Shadlen MN. Representation of confidence associated with a decision by neurons in the parietal cortex. Science. 2009;324:759–764. doi: 10.1126/science.1169405. [DOI] [PMC free article] [PubMed] [Google Scholar]
- Kim JN, Shadlen MN. Neural correlates of a decision in the dorsolateral prefrontal cortex of the macaque. Nat Neurosci. 1999;2:176–185. doi: 10.1038/5739. [DOI] [PubMed] [Google Scholar]
- Klein SA. Measuring, estimating, and understanding the psychometric function: a commentary. Percept Psychophys. 2001;63:1421–1455. doi: 10.3758/bf03194552. [DOI] [PubMed] [Google Scholar]
- Lau B, Glimcher PW. Action and outcome encoding in the primate caudate nucleus. J Neurosci. 2007;27:14502–14514. doi: 10.1523/JNEUROSCI.3060-07.2007. [DOI] [PMC free article] [PubMed] [Google Scholar]
- Lau B, Glimcher PW. Value representations in the primate striatum during matching behavior. Neuron. 2008;58:451–463. doi: 10.1016/j.neuron.2008.02.021. [DOI] [PMC free article] [PubMed] [Google Scholar]
- Lauwereyns J, Takikawa Y, Kawagoe R, Kobayashi S, Koizumi M, Coe B, Sakagami M, Hikosaka O. Feature-based anticipation of cues that predict reward in monkey caudate nucleus. Neuron. 2002a;33:463–473. doi: 10.1016/s0896-6273(02)00571-8. [DOI] [PubMed] [Google Scholar]
- Lauwereyns J, Watanabe K, Coe B, Hikosaka O. A neural correlate of response bias in monkey caudate nucleus. Nature. 2002b;418:413–417. doi: 10.1038/nature00892. [DOI] [PubMed] [Google Scholar]
- Lo CC, Wang XJ. Cortico-basal ganglia circuit mechanism for a decision threshold in reaction time tasks. Nat Neurosci. 2006;9:956–963. doi: 10.1038/nn1722. [DOI] [PubMed] [Google Scholar]
- Nakamura K, Hikosaka O. Role of dopamine in the primate caudate nucleus in reward modulation of saccades. J Neurosci. 2006a;26:5360–5369. doi: 10.1523/JNEUROSCI.4853-05.2006. [DOI] [PMC free article] [PubMed] [Google Scholar]
- Nakamura K, Hikosaka O. Facilitation of saccadic eye movements by postsaccadic electrical stimulation in the primate caudate. J Neurosci. 2006b;26:12885–12895. doi: 10.1523/JNEUROSCI.3688-06.2006. [DOI] [PMC free article] [PubMed] [Google Scholar]
- Palmer J, Huk AC, Shadlen MN. The effect of stimulus strength on the speed and accuracy of a perceptual decision. J Vis. 2005;5:376–404. doi: 10.1167/5.5.1. [DOI] [PubMed] [Google Scholar]
- Parthasarathy HB, Schall JD, Graybiel AM. Distributed but convergent ordering of corticostriatal projections: analysis of the frontal eye field and the supplementary eye field in the macaque monkey. J Neurosci. 1992;12:4468–4488. doi: 10.1523/JNEUROSCI.12-11-04468.1992. [DOI] [PMC free article] [PubMed] [Google Scholar]
- Ratcliff R, Rouder JN. Modeling response times for two-choice decisions. Psychol Sci. 1998;9:347–356. [Google Scholar]
- Reddi BA, Carpenter RH. The influence of urgency on decision time. Nat Neurosci. 2000;3:827–830. doi: 10.1038/77739. [DOI] [PubMed] [Google Scholar]
- Roitman JD, Shadlen MN. Response of neurons in the lateral intraparietal area during a combined visual discrimination reaction time task. J Neurosci. 2002;22:9475–9489. doi: 10.1523/JNEUROSCI.22-21-09475.2002. [DOI] [PMC free article] [PubMed] [Google Scholar]
- Rorie AE, Gao J, McClelland JL, Newsome WT. Integration of sensory and reward information during perceptual decision-making in lateral intraparietal cortex (LIP) of the macaque monkey. PLoS One. 2010;5:e9308. doi: 10.1371/journal.pone.0009308. [DOI] [PMC free article] [PubMed] [Google Scholar]
- Saint-Cyr JA, Ungerleider LG, Desimone R. Organization of visual cortical inputs to the striatum and subsequent outputs to the pallido-nigral complex in the monkey. J Comp Neurol. 1990;298:129–156. doi: 10.1002/cne.902980202. [DOI] [PubMed] [Google Scholar]
- Shadlen MN, Newsome WT. Neural basis of a perceptual decision in the parietal cortex (area LIP) of the rhesus monkey. J Neurophysiol. 2001;86:1916–1936. doi: 10.1152/jn.2001.86.4.1916. [DOI] [PubMed] [Google Scholar]
- Shadlen MN, Britten KH, Newsome WT, Movshon JA. A computational analysis of the relationship between neuronal and behavioral responses to visual motion. J Neurosci. 1996;16:1486–1510. doi: 10.1523/JNEUROSCI.16-04-01486.1996. [DOI] [PMC free article] [PubMed] [Google Scholar]
- Smith PL, Ratcliff R. Psychology and neurobiology of simple decisions. Trends Neurosci. 2004;27:161–168. doi: 10.1016/j.tins.2004.01.006. [DOI] [PubMed] [Google Scholar]
- Stanton GB, Goldberg ME, Bruce CJ. Frontal eye field efferents in the macaque monkey: I. Subcortical pathways and topography of striatal and thalamic terminal fields. J Comp Neurol. 1988;271:473–492. doi: 10.1002/cne.902710402. [DOI] [PubMed] [Google Scholar]
- Sutton RS, Barto AG. Reinforcement learning: an introduction. Cambridge, MA: MIT Press; 1998. [Google Scholar]
- Voss A, Rothermund K, Voss J. Interpreting the parameters of the diffusion model: an empirical validation. Mem Cognit. 2004;32:1206–1220. doi: 10.3758/bf03196893. [DOI] [PubMed] [Google Scholar]
- Williams ZM, Eskandar EN. Selective enhancement of associative learning by microstimulation of the anterior caudate. Nat Neurosci. 2006;9:562–568. doi: 10.1038/nn1662. [DOI] [PubMed] [Google Scholar]


