

Abstract
Systematic Monte Carlo simulations of simple lattice models show that the final stage of protein folding is an ordered process where native contacts get locked (i.e., the residues come into contact and remain in contact for the duration of the folding process) in a well-defined order. The detailed study of the folding dynamics of protein-like sequences designed as to exhibit different contact energy distributions, as well as different degrees of sequence optimization (i.e., participation of non-native interactions in the folding process), reveals significant differences in the corresponding locking scenarios—the collection of native contacts and their average locking times, which are largely ascribable to the dynamics of non-native contacts. Furthermore, strong evidence for a positive role played by non-native contacts at an early folding stage was also found. Interestingly, for topologically simple target structures, a positive interplay between native and non-native contacts is observed also toward the end of the folding process, suggesting that non-native contacts may indeed affect the overall folding process. For target models exhibiting clear two-state kinetics, the relation between the nucleation mechanism of folding and the locking scenario is investigated. Our results suggest that the stabilization of the folding transition state can be achieved through the establishment of a very small network of native contacts that are the first to lock during the folding process.
Keywords: Monte Carlo simulation, native geometry, kinetics, folding pathways, non-native interactions
Introduction
Understanding protein folding, the process according to which a linear chain of amino acids acquires its three-dimensional native structure, remains a challenging problem despite more than 70 years of dedicated research.1,2
Classical experimental investigations envisioned a folding pathway as a sequence of transient (partially) folded intermediates that the protein should traverse before arriving at the native state. Although intermediate species appear to be present in the folding of large proteins (>100 amino acids),3 they are not observed in conventional bulk kinetic studies of small, single domain proteins that fold in an apparent two-state manner.4 Nevertheless, the use of hydrogen-exchange (HX) methods5,6 has provided evidence for the existence of hidden intermediates in the folding of small proteins. A prototypical example is that of cytochrome c (∼100 amino acids), which appears to fold in an ordered manner by populating a sequence of five discrete intermediates.7,8 Although HX methods can monitor structural folding events, the so-called FRET methods9 can inspect the folding reaction of individual proteins at a finer level of structural detail by providing quantitative information on intermolecular contacts.10–13 Furthermore, other methods based on fluorescence quenching have been developed that allow measuring the formation rate of individual contacts in proteins.14
Despite such remarkable experimental advances, the direct observation of native and non-native contacts during protein folding has proved a difficult task, and a systematic experimental investigation of intermolecular contact dynamics is not yet possible. Fortunately, computer simulations provide a straightforward way to explore folding pathways at different levels of structural detail, and an atomistically resolved sequence of events leading to the native state can be obtained in computer investigations. Mirny and coworkers were amongst the first to study the ensemble averaged time evolution of probabilities of native and non-native contacts in the folding of 36-mer lattice proteins.15 More recently, and at the coarse level of structure formation defined by contact clusters (e.g., secondary structural elements), sequential folding events have been observed through several simulational frameworks.16–23 Also, at the microstrutural level of individual contact formation, evidence for sequential folding has been reported.24–26 A rather detailed mechanistic description of the folding process based on lattice models was very recently proposed by Gin et al.27 who measured the order according to which the native contacts get “locked” (i.e., formed for the last time during folding before the formation of the native state).
The nucleation mechanism is generally considered the most common form of folding mechanism amongst two-state proteins.28 Accordingly, the rate-limiting step is the formation of a specific subset of native contacts, the so-called folding nucleus (FN), after which the native fold is achieved reproducibly and rapidly.29 Abkevich et al. discussed the relation between nucleation and ordered folding.29 More precisely, they noted that the folding process can be divided into two stages: an initial stochastic stage, where random fluctuations in the denatured state culminate in the formation of the FN, and a postnucleus descent to the native state, which occurs in a highly ordered manner. However, they did not analyze the specific sequence of formation of intermolecular (native and non-native) contacts that occurs upon postnucleus ordering. Furthermore, it has been shown that in some cases the “stochastic” prenucleus stage may also display features of a partially ordered process where certain native and non-native contacts, which facilitate the formation of the FN, may appear in an apparently deterministic manner.19,25
A fundamental issue in the folding arena is that of understanding the role played by non-native interactions in establishing the folding pathway. In the case of large proteins, the formation of non-native contacts often leads to the appearance of kinetic traps, that is, misfolded conformations that inevitably delay the formation of the native fold. Although the role of non-native contacts as folding breakers is commonly accepted, their role as folding helpers lacks consensus. An early lattice investigation by Chan and Dill reported that a nonnative contact help to lower the folding barrier.30 Lattice simulations studies by Li et al.31 provided evidence that non-native interactions play a functional role in the formation of the FN, and a theoretical analysis by Clementi and Plotkin suggested that weak, non-native interactions can actually accelerate folding to the native state.32 More recently, however, Gin et al. reported that the folding mechanism is not biased by non-native interactions.27 This appears to be the case because the order in which the native contacts get locked during folding is robust between interaction potentials, which ignore non-native interactions and potentials that take them into account. However, a more comprehensive analysis should include not only the order but also the timing of locking events because such timing may affect the overall folding rates, which are directly measured in experiments.
Here we carry out such an analysis by performing systematic Monte Carlo simulations of lattice models. The lattice framework is particularly adequate to explore the folding process based on locking events because intermolecular contacts (either native or non-native) are accurately/unambiguously defined on lattice models and, more importantly, it is possible to generate large statistical samples of the whole folding process of many target proteins. Our results reveal a strong preference for a certain temporal ordering of native contact locking during the last stage of folding of large ensembles of runs. Moreover, such ordered folding is particularly clear for the more complex target structures considered here, indicating that native structure plays an important role in determining the course of locking events. We also explore the interplay between the distribution of native contact energies and the dynamics of non-native contacts in establishing the locking order. By addressing the dynamics of non-native contacts in a direct manner, we have found strong evidence for a role played by non-native contacts in shaping the folding process, not only at the late locking stage but also before that. More specifically, we have found that non-native contacts can constrain the formation of native ones—which is especially relevant during the locking stage—but they can also facilitate the establishment of native contacts up to very late in the folding reaction. Thus, our results are complementary to those of Gin and coworkers. Indeed, although the analysis of Gin et al.27 reveals that the intrinsic locking order is insensitive to non-native contacts, our results show that the timing of locking is largely driven by the dynamics of non-native contacts and that non-native contacts do actually play a functional role in the overall folding dynamics.
Finally, we consider the relation between the nucleation mechanism of protein folding and the locking of native contacts. Our analysis suggests that the number of native contacts necessary to stabilize the folding transition state can be very small.
Results
Target structures
The target conformations considered in this study were found by homopolymer collapse.33 The relaxation of a lattice homopolymer (whose energetics is modeled by a contact Hamiltonian) to the lowest energy state was originally used by Abkevich et al.34 as an efficient way to find in a systematic manner kinetically accessible maximally compact cuboids on the lattice.35–37 Two chain lengths are investigated in the present study, namely, L = 36 and L = 48. The contact order parameter CO, measuring the average sequence separation between contacting beads in the native conformation normalized to the chain length,38 is used as an indicator of geometric complexity. In particular, for each considered chain length, we use the relaxation of homopolymers to generate two sets of target structures. One of them, the low-CO set, contains 12 target structures characterized for having a distinctively low CO (∼0.20), whereas the other one, the high-CO set, contains 12 target structures of very high CO (∼0.40). The three-dimensional representation and the contact map of the two model systems with chain length N = 48 that have the lowest (low-CO target) and the highest CO (high-CO target) in our target samples is shown in Figure 1.
Figure 1.

Contact map (top) and three-dimensional representation (bottom) of three target structures investigated in this study that are representative of the two structural classes (high- and low-CO geometries) considered. Each square in the contact map represents a native contact. For maximally compact cuboids with N = 48 beads, there are 57 native contacts. A nonlocal contact between two beads i and j is defined as long range (LR) if their sequence separation is at least 10 units (i.e., |i − j| ≥ 10). Accordingly, the number of LR contacts (black squares) in the low-CO structure is 23 and in the high-CO structure is 33. These numbers of LR contacts correspond to long-range order parameters39 of 0.48 and 0.69, respectively. The (relative) contact orders38 of the selected targets are 0.23 and 0.45. Also show is the circular permutant of the high-CO structure that has the lowest contact order CO = 0.29 and a long-range order of 0.77. In the three-dimensional representation, beads of different colors are used to distinguish between different amino acid species. [Color figure can be viewed in the online issue, which is available at wileyonlinelibrary.com.]
The locking scenario
Existence of sequential order in the final stage of protein folding
We define the locking time of a native contact as the number of MC steps that corresponds to the contact's final formation; from this “instant” onward the contact remains formed until the lattice system reaches its (final) native conformation (similar measures were used in Refs.21 and27). We refer to the collection of the protein's native contacts and their average locking times as the locking scenario. Figure 2 (left) shows the locking scenario displayed by the high-CO target when protein energetics is modeled by the Gō potential (see Models and Methods).40 It is clear that the locking of native contacts occurs in a short time-window toward late folding and, more importantly, it is possible to distinguish the native contacts according to their locking times. In other words, there is a statistical order in the locking of native contacts. We should point out that the locking of native contacts is not a deterministic process (i.e., it is not the same for every folding trajectory). Rather, as in Ref.21, the locking scenarios reflect a strong statistical preference for the corresponding sequence of locking events during folding. Interestingly, there is no relation between the locking order and the contact length (i.e., the amino acids' backbone separation) as local contacts can lock relatively late and nonlocal contacts can lock relatively early. The existence of order in the locking of native contacts is not unique to this particular target structure nor to chain length N = 48. Nevertheless, the results of our high-throughput analysis suggest that it is more conspicuous amongst high-CO structures of large chain length (Supporting Information Figs. S1–S4).
Figure 2.
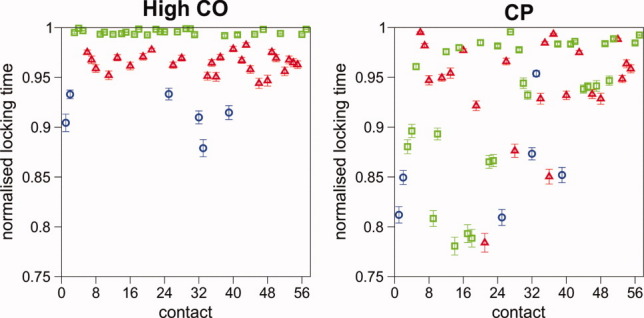
Locking scenarios for the high-CO target (left) and for its circular permutant with lowest CO (right). Amino acid interactions are modeled by the Gō potential. The locking time, tlock, of a native contact is computed as the mean locking time (normalised to the run's FPT) averaged over 500 folding runs. The error bars indicate dispersion in the values of tlock. The native contacts are numbered according to increasing contact length (whenever two contacts correspond to the same sequence separation |i − j| they are ranked in order of increasing sequence location of bead i). Different colors and symbols are used to distinguish contacts within the three locking groups identified for the wild-type high-CO target (blue circles, first group; red triangles, second group; green squares, third group). To highlight the differences between both locking scenarios, the color and symbol code used for the contacts in the wild-type locking scenario is the same as in the permutant's scenario. It is clear that by changing the connectivity of the chain, as keeping the native structure fixed, one can induce a complete change in the locking scenario (i.e., locking order and timing at which locking starts). [Color figure can be viewed in the online issue, which is available at wileyonlinelibrary.com.]
The contact map plays a significant role in establishing the locking scenario
Here we compare the locking scenarios of two target structures that are related by circular permutation. The so-called circular permutation is a protein engineering technique that consists of cutting up the protein's backbone at some selected peptide bond and subsequently linking its original N- and C-terminal parts through a process that leads to minimal modification of the native structure (or to no modification at all when it is preformed on a lattice system). We have constructed all the circular permutants of the high-CO structure and selected the one with the lowest CO (Fig. 1, right). Remarkably, the permutant, termed target CP, displays a completely different locking order of its native contacts (e.g., many native contacts that are the last to lock in the wild-type structure are the first to get locked in the mutant). Moreover, the locking of native contacts starts much earlier in this case (Fig. 2). This observation shows that by changing the protein's backbone connectivity, as keeping the native structure, one induces very significant changes in the order and timing according to which the native contacts get locked during protein folding. Therefore, the contact map plays a significant role in establishing the locking order.
Protein sequence and the modulation of locking scenario
Next we consider how the energetics of native and non-native interactions affects the locking scenario. Specifically, we address the following question: How do the observed locking patterns change if instead of the Gō potential (which assigns the same interaction energy to all native contacts and zero energy to all nonnative contacts) a more realistic sequence-based potential (which includes non-native interactions and uses the Miyazawa-Jernigan (MJ) 35,41 interaction parameters to model the interactions between amino acids) is used to mimic protein energetics? In particular, how do locking scenarios depend on the degree of sequence optimization? To address these questions, we follow Ref.15 and consider two sequences per native geometry (named S1 and S2). These sequences have exactly the same chemical composition (Table I). However, although S1 was prepared via the permutation method,42 S2 was designed using the Z-score optimization method (see Models and Methods).43,44 Except for sequence S2 folding to the low-CO target all the other sequences fold with two-state kinetics (Fig. 3). The fact that S2 folds faster than S1 is indicative that S2 shows indeed a higher degree of sequence optimization. Indeed, non-native contacts are clearly less conspicuous along its folding reaction (Fig. 4).
Table I.
The Different Sequences Investigated in This Study for Each Selected Target with Chain Length N = 48
| Target | Sequence | Hnat | Topt | Log10 MFPT |
|---|---|---|---|---|
| Low-CO | S1: FCPFKYHDKTNDHWFAPFMERNAWHYA HMVLWPIRSRDLWKQSDGDPS | −26.27 | 0.32 | 6.98 ± 0.04 |
| Low–CO | S2: FHNFKNGDRRATSHCHWFWDQSYPWWAMFLAV PISHKDLMRYEDDPPK | −24.37 | 0.29 | 6.42 ± 0.04 |
| Low–CO | Gō | −57.00 | 0.65 | 6.23 ± 0.02 |
| High–CO | S1: QSRMHFKDHINPSPRDGPAFREFVKCKDHSLYH DLYANWPWAFDWTWS | −26.50 | 0.33 | 7.19 ± 0.05 |
| High–CO | S2: PMHFDLKRYADHSYRDQPWFREVLNGKDPSA HTNIHAKCWFMFDWPWS | −24.54 | 0.31 | 6.85 ± 0.05 |
| High–CO | Gō | −57.00 | 0.70 | 6.54 ± 0.03 |
Figure 3.
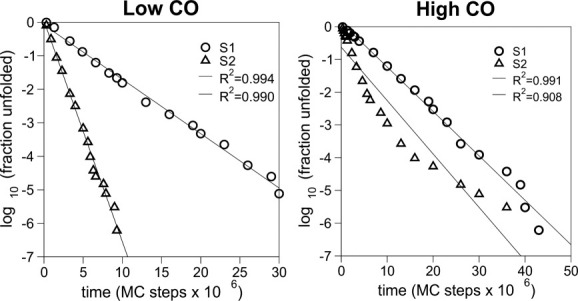
Except for sequence S2 folding to the high-CO target, the other studied sequences fold with single-exponential (i.e., two-state) kinetics.
Figure 4.
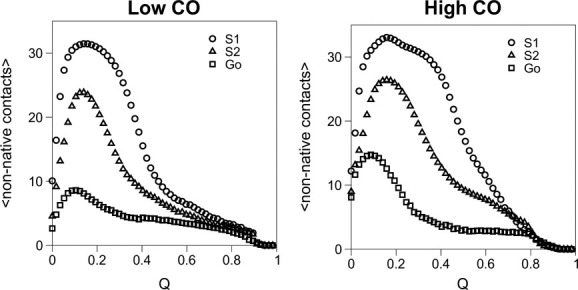
Mean number of non-native contacts (computed over 500 MC runs) formed as a function of the fraction of native contacts, Q, for the low- and high-CO targets. The average number of non-native contacts formed for fraction of native contacts Q is always smaller for sequence S2 than for sequence S1. Clearly, sequence S2 represents a compromise between the Gō sequence and the less optimized sequence S1.
The three locking scenarios display substantial differences in the order and timing of locking, and the variation is enhanced in sequence S1 with respect to the Gō sequence (Fig. 5). In particular, in the less optimized sequence S1, the number of contacts that lock only upon the formation of the native fold is distinctively larger than in sequence S2, and naturally even larger than in the Gō sequence. In part this effect may be due to the ensemble of non-native contacts which by staying formed up to a later stage in the folding process of S1 precludes the definitive formation of the native ones (Supporting Information Fig. S5).
Figure 5.

The locking scenarios of the three sequences studied for the low-CO and high-CO targets. The dotted line represents the mean locking time. As sequence optimization increases from sequence S1 to Gō, the locking of native contacts starts at a considerably earlier stage of the folding process. [Color figure can be viewed in the online issue, which is available at wileyonlinelibrary.com.]
To determine the extent up to which the locking scenario is driven by the distribution of native energies (i.e., the stabilization of native interactions), we computed the average energy per native contact within each group of contacts identified in the locking scenarios of sequences S1 and S2. Not surprisingly, we found that the contacts within the first, and the second groups of locking contacts are (on average) more stable than the last contacts to lock (Supporting Information Table S1). However, a finer analysis of the locking scenarios reveals a rather frail correlation between stability and locking order. Indeed, within sequence S1, and especially for the high-CO target, there is little correlation between stability and locking order within the first 10 locking contacts (r = 0.14 vs. r = 0.52 for the low-CO target). A comparison between sequences S1 and S2 also shows that changes in stability are weekly correlated with locking order, and once again, the correlation is weaker for the more topologically complex target structure (Supporting Information Table S2). Thus, we conclude that the distribution of native interaction energies is not enough to determine the locking scenario of folding.
Interplay between native and non-native contacts during folding
Here we investigate the interplay between native and non-native contacts during the folding process. More precisely, we determine the role played by non-native contacts in shaping the locking scenarios of the target structures here considered.
Identifying the relevant non-native contacts
We have started by selecting from the ensemble of 472 non-native contacts (that can a priori establish in the folding of 48-mers) those that display a non-negligible frequency of occurrence during the folding process; we consider these to be the relevant non-native contacts as these are the ones that may play a systematic role in the folding dynamics. In particular, we have evaluated the frequency of each non-native contact during two periods: between 20% and 80% of the folding time and during the last 20% of the folding time. For the sake of convenience, we shall refer to the former period as the prelocking phase, and by the same token, the latter period is termed the locking phase. We observe that the mean average frequency of non-native contacts is typically low (<0.02) in both considered phases. However, for every system studied, there is a set of non-native contacts that form with a non-negligible frequency (>0.1) during the considered time periods, and the number of these contacts is larger in sequence S1 than in sequence S2. Although for sequence S1 folding to the low-CO structure, native and non-native interactions have—on average—the same stability, in the other three sequence-target pairs considered the non-native interactions are 24–35% less stable than their native counterparts. We note that the vast majority of the high-frequency non-native contacts forming in the locking phase are also present with a non-negligible probability in the prelocking phase (Supporting Information Fig. S6).
Correlation maps between non-native and native contacts
Having identified the relevant non-native contacts, we proceed by determining the correlations between them and each one of the 57 native contacts forming a maximally compact cuboid of chain length N = 48. We compute these correlations during the prelocking phase and during the locking phase as well. The results for low- and high-CO targets are reported in the correlation maps of Figures 6 and 7, respectively, which display the correlation coefficient, ρ, between a native and a non-native contact. The computed correlation coefficient displays negative values, null, and positive values. This means that in some cases the existence of a non-native contact decreases the probability of existence of a native one (negative ρ), whereas in other instances (positive ρ) the opposite scenario holds, that is, the presence of a native contact is facilitated by the coexistence of a non-native one (see Models and methods).
Figure 6.
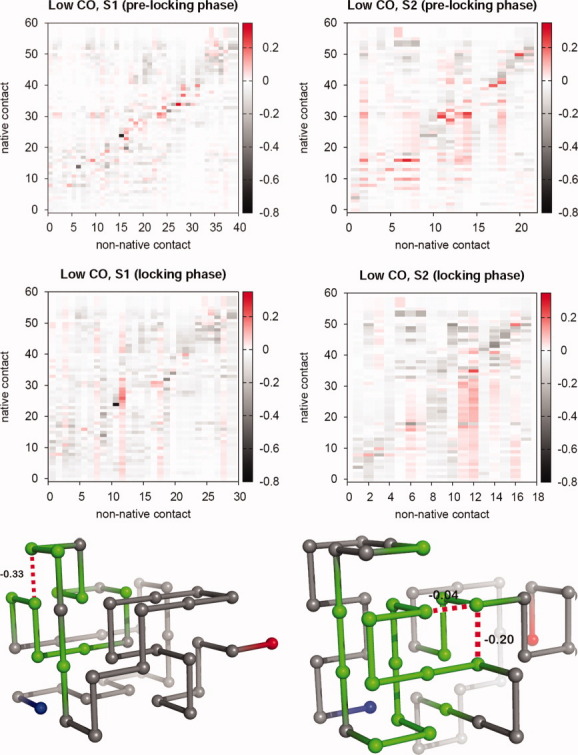
Correlation matrices between the non-native contacts, which are the most frequent during the prelocking phase (corresponding to 20–80% of the folding time) and locking phase (last 20% of the folding time), and the 57 native contacts of the low-CO target. Representative conformations sampled from the locking phase where we have highlighted the non-native contacts (and their interaction energies) and part of the backbone entailing the native contacts for which strong positive correlations were observed with the non-native ones (bottom). [Color figure can be viewed in the online issue, which is available at wileyonlinelibrary.com.]
Figure 7.
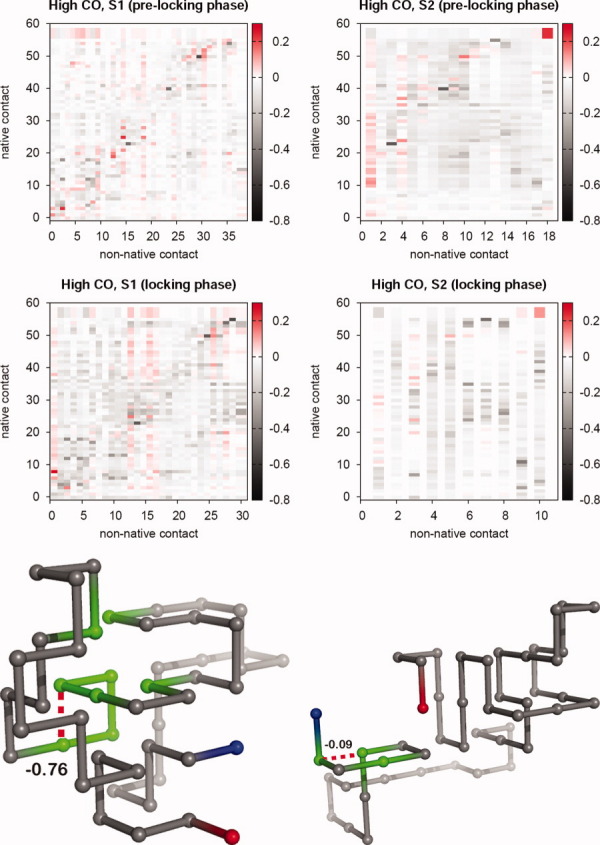
Correlation matrices between the non-native contacts, which are the most frequent during the prelocking phase (corresponding to 20–80% of the folding time) and locking phase (last 20% of the folding time), and the 57 native contacts of the high-CO target. Representative conformations sampled from the locking phase where we have highlighted the non-native contacts (and their interaction energies) and part of the backbone entailing the native contacts for which strong positive correlations were observed with the non-native ones (bottom). [Color figure can be viewed in the online issue, which is available at wileyonlinelibrary.com.]
Several observations can be drawn from the analysis of the reported data. First, the mean correlation coefficient over the ensemble of all the non-native/native contact pairs,  , takes values on the interval
 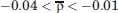 , and we find significant correlations (ρ > 0.1) and significant anticorrelations (ρ < −0.1) in the four studied sequences. Not surprisingly, the negative correlations, which are dominant during the locking phase, tend to occur between contacts that share a bead (e.g., 8–11 and 11–26), or between contacts whose beads are nearest neighbors along the chain (e.g., 21–24 and 20–23). The positive correlations are more ubiquitous during the prelocking phase but, quite remarkably, there is a significant number of strong positive correlations in the locking phase as well (e.g., in the case of sequence S2 folding to low-CO target, 35% of the relevant correlations in the prelocking phase are positive correlations, and during the locking phase this number decreases to a still significant 14%). We have searched for conformations having strongly positively correlated non-native and native contacts simultaneously formed, and we mapped them onto the 3D protein structure. We found that strongly positively correlated non-native and native contacts are clearly localized in a region of the protein structure (Figs. 6 and 7, bottom). Furthermore, we have also noticed that the ensemble of all these strongly correlated contacts persists during a significant simulation time interval. These observations suggest that indeed non-native interactions play a constructive role in folding.
Non-native contacts and the modulation of the locking scenario
We proceed by making a finer analysis of the correlation maps to further interpret the locking scenarios of the model proteins here considered. More specifically, we are interested in determining up to which extent the differences between the locking scenarios of sequences S1 and S2 are ascribable to non-native contacts. It is clear that if the final formation (i.e., locking) of a native contact is conditioned by the definitive rupture (i.e., unlocking) of a certain non-native one, then the specific non-native contact plays a role in establishing the locking scenario. Non-native contacts that are the natural candidates to play a functional role in shaping the locking scenarios are those that establish strong anticorrelations with native ones. To explore this assertion, we have compared the unlocking times and locking times associated with non-native and native contact pairs for which exists significantly strong anticorrelations, and we have found that there is a clear synchrony between them (Supporting Information Tables S3 and S4). Furthermore, for both model systems studied, the observed synchrony is particularly striking in the case of sequence S1, which explains the observed differences in the timing of locking (and in particular, it explains why the locking is shifted toward the formation of the native fold in the less optimized sequence). Perhaps not surprisingly, we have also found that during the locking phase the number of significant anticorrelations decreases from sequence S1–S2 (the case of the high-CO target is particularly illuminating with sequence S2 displaying a very significant decrease of 67% in the number of significantly anticorrelated pairs). Overall, our results thus strongly support the idea that non-native contacts play indeed a determinant role in shaping the locking scenario and therefore the folding process.
The locking scenario and the nucleation mechanism of protein folding
Here we explore the relation between the locking scenario and the nucleation mechanism of protein folding. More precisely, how do the contacts that make up the folding nucleus (FN) map onto the locking scenario?
Identifying the folding nucleus with the Pfold analysis method
We focus on the sequences whose kinetics is clearly single-exponential and we perform the determination of the FN by means of the folding probability Pfold method (see Models and Methods). In particular, we follow Ref.45 in defining the FN as the set of native contacts that exhibit the most dramatic change in the probability of being formed between pre- and transition-state (TS) conformations. These contacts both define and guarantee that the TS is reached. Thus, to determine the FN, we follow the procedure adopted in Ref.46 and start by considering two ensembles of conformations, all of which are selected from independent folding runs. In one of these ensembles, the so-called pre-TS ensemble, each conformation is characterized for having its Pfold within the interval 0 < Pfold < 0.1, whereas in the other, representative of the TS, each conformation has 0.4 < Pfold < 0.6. The TS conformations fold extremely fast, between 1.5 and 2.5 orders of magnitude faster than a random-coil type conformation, which confirms the suitability of the Pfold method as a TS ensemble locator (Supporting Information Fig. S7).
We went on by evaluating the differential probability of each native contact Δp = pTS − pU, where pTS (respectively pU) stand for the probability of contact (native and non-native) formation in the TS (respectively pre-TS) ensemble. The mean averaged value of Δp is rather small, ranging from 0.002 (for sequence S1 of the high-CO target) to 0.005 (for sequence S1 of the low-CO target). For each system studied, we identify the FN as being formed by the 10 native contacts (which represent ca. 20% of the total number of native contacts29) that exhibit the largest Δp. The nuclei contacts thus selected display Δp in the range 0.2 < Δp < 0.5, which is well above the averaged mean. Interestingly, in the case of sequence S1 folding to the low-CO target, there are six non-native contacts (namely, 10:43; 21:42; 25:42; 33:46; 35:46; 36:45) with a considerably large 0.3 < Δp < 0.4 that are not particularly stable (their average mean energy being −0.24). In the other sequences studied we have not found non-native contacts with significant Δp.
Mapping the folding nucleus onto the locking scenario
The contact maps of Figure 8 report the FN of each protein sequence. Our results show that the nuclei contacts are distributed over the three locking groups, being well represented within the group of contacts that locks last (i.e., during the last 2% of the folding time). Not surprisingly, the contacts pertaining to this last group are (on average) up to 60% less stable than the other contacts identified as being part of the FN. These results thus suggest that the stabilization of the TS can be achieved through the formation of a rather small network of native contacts within the FN, which represent between 30% to 40% of the contacts that lock in the first and second groups.
Figure 8.
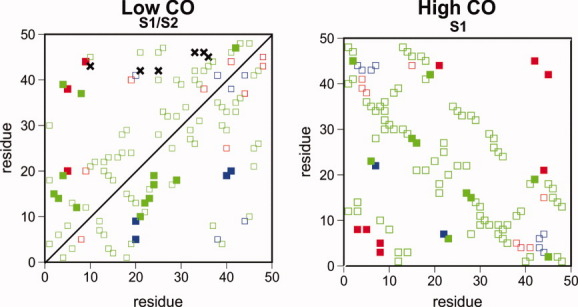
Locking maps showing the set of contacts identified as FN (filled squares) for the low- and high-CO targets. The contacts in the locking maps are colored according to their order of locking (red first, blue second, green last). In the case of the low-CO target, the FN of sequence S1 (S2) is shown above (respectively below) the diagonal. In the FN of sequence S1 of the low-CO target, there are six non-native contacts (marked with crosses) that show a remarkable probability increase (0.3 < Δp < 0.4) between pre- and TS-conformations. [Color figure can be viewed in the online issue, which is available at wileyonlinelibrary.com.]
Discussion
We have explored the folding process of lattice protein systems at the level of individual contact formation. More precisely, we considered a description of folding that is based on measuring the locking time of each native contact, that is, the last time the contact is established before the formation of the native fold. The collection of locking times thus obtained, which we dubbed locking scenario, provides a picture of the folding process and reveals the existence of statistical order, in the form of sequential average locking times, during its last stage (which corresponds to the last 10–20% of the folding time).
The origin of an ordered folding process may reside on the fold's geometry.47 By exhaustively exploring native folds with different geometries, we have found that an ordered folding is more clearly apparent in structures of large geometrical complexity, where the number of nonlocal contacts prevails.
The detailed study presented here of different protein sequences, designed as to encompass different native energy distributions and different degrees of participation of non-native contacts in the folding process, revealed significant differences in the corresponding locking scenarios. Apart from the changes in locking order, the scenarios differ strongly on the timing of locking. Generally, a decrease in sequence optimization shifts the locking of native contacts toward the formation of the native fold. Motivated by this observation, we have thus investigated the interplay between native contact stability and the dynamics of non-native contacts in the formation of the native fold. To this end, we have carefully explored the dynamics of selected non-native contacts, namely those that display a significant frequency of occurrence during the last 20% of the folding time. Despite being less energetically stable than their native counterparts, some non-native contacts compete with the former, and significant anticorrelations were found for pairs of non-native and native contacts. In particular, a clearly defined synchrony was found between the unlocking (i.e., permanent disruption) times of the non-native contacts and the locking times of the native contacts in these anticorrelated pairs. Taking into account the fact that these events typically occur during the last 1–2% of the folding time, one is led to conclude that non-native contacts strongly influence late folding events. Not surprisingly, our results also show that such an influence gets stronger as the sequence's optimization degree decreases.
Interestingly, the correlation analysis also revealed evidence for a positive role played by non-native contacts, which is especially strong at an early folding stage before the starting of locking. It is possible that such non-native interactions can actually speed up the folding reaction by facilitating the formation of the folding nucleus.32 A significant speed up of the folding rate due to non-native interactions was recently reported by Chan and coworkers.48 This investigation combined off-lattice simulations of a coarse-grained model with experimental study and showed that the folding transition state of the Fyn SH3 domain is significantly stabilized by specific hydrophobic non-native interactions establishing between three residues whose beta-carbons are separated by more than 15 Å in the native state. In a subsequent study, Zhang and Chan found evidence for an important role played by specific non-native hydrophobic interactions in modulating the complex folding kinetics of protein Top7.49
A perhaps more surprising result of our study is the observation that strong positive correlations between native and non-native contacts can persist up to a very late stage in the folding reaction, especially in topologically simple target structures.
The summarized results show that the distribution of native energies still plays an important role in modulating the locking scenario. Indeed, we have found that within each locking scenario the native contacts in the first groups are on average more stable than those in last group. However, we have not found significant correlations between the order of locking and stability within the first locking contacts, and therefore, the distribution of native energies does not uniquely determine the locking scenario. Altogether these results suggest that both native and non-native contacts play an equally important role in determining the locking scenario and therefore the folding mechanism.
Our conclusions are complementary to those reported on a recent study by Gin et al.27; in this case, a systematic large-scale comparison of the folding trajectories, described in terms of the intrinsic order of locking events, was performed within Gō-like and sequence-specific potentials. For a fixed native structure, it is observed that Gō and MJ potentials typically yield very similar folding trajectories, whereas different MJ sequences can fold to the native state by following substantially different routes. These observations imply that the order according to which the native structure forms is profoundly insensitive to non-native contacts. In other words, they show that if the structural progression of a polypeptide chain toward the native fold is committed to follow a specific intrinsic order, which is partly dictated by the fold's topological features, then the formation of non-native contacts cannot alter this ordering. It can, however, as we have shown, change the timing of the corresponding structural rearrangements. Therefore, it is the time underlying the order, and not the order itself, that is sensitive to non-native contacts.
Finally, for systems exhibiting two-state kinetics, we have explored how the folding nucleus (FN), determined with the Pfold analysis method, maps onto the locking scenario. We have found no clear preferential distribution of the FN contacts, although they are well represented amongst last group of locking contacts. These FN contacts are typically less stable than those contacts locking earlier, which can be taken as an indication that the stabilization of the folding transition state can be achieved through the establishment of a very small network of native interactions.
Models and Methods
The simple lattice representation
We consider a simple three-dimensional lattice model of a protein molecule with chain length L. In such a minimalist model, amino acids, represented by beads of uniform size, occupy the lattice vertices and the peptide bond that covalently connects amino acids along the polypeptide chain is represented by sticks with uniform (unit) length corresponding to the lattice spacing. To mimic protein energetics, we use the Gō potential40 and the sequence-specific potential (see, e.g., Ref.50).
The Gō potential
In the Gō potential, the energy of a conformation, defined by the set of bead coordinates  , is given by the contact Hamiltonian
| (1) |
where ɛ is the (uniform) interaction energy parameter and the contact function  is unity only if beads i and j form a noncovalent native contact, that is, a contact between a pair of beads that is present in the native structure, and is zero otherwise.
The sequence-based potential
By contrast with the Gō potential, which ignores the protein's primary structure, the sequence-based potential addresses the dependence of folding dynamics on the amino acid sequence by considering interactions between the 20 different amino acids used in the synthesis of real-world proteins. Accordingly, the contact Hamiltonian that defines the energy of a conformation is given by
| (2) |
Where {ηi} represents a specific amino acid sequence, and i stands for the chemical identity of bead i. The interaction parameters ɛ are taken from the 20 × 20 Miyazawa-Jernigan (MJ) matrix.41 An important difference between the Gō and the sequence-based potential is that in the latter both the native and the non-native contacts contribute energetically to the folding process.
Sequence design
The model sequences considered in this study were designed to be “native” (i.e., thermodynamically stable and kinetically accessible) in a preselected target (i.e., native) conformation, which is a maximally compact cuboid. Two design methods were used to generate protein-like sequences. The first method—hereafter termed permutation method—corresponds to the optimization of the energy of the native conformation Hnat, with respect to permutation of sequences with fixed amino acid composition.42 In the second method, commonly known as the Z-score optimization43 one minimizes, instead of the Hnat, its relative value44
| (3) |
where Hav is the average energy of non-native conformations and σ is the standard deviation of the mean contact energy. Hav is estimated as Hav = Nnat × eav, where Nnat is the number of contacts in the native conformation and eav is the mean energy of a contact. To compute eav one considers all topological possible contacts between pairs of beads. These are the contacts between beads of different parity separated by at least three units of backbone distance. Sequences optimized according to the Z-score method show a maximum energy gap between the native state and the mean energy of the set of compact nontarget structures.15
Folding simulation details
To mimic the protein's relaxation toward the native state we use the Metropolis Monte Carlo (MC) algorithm51 together with a local move set that includes corner-flips and end-moves (i.e., displacements of one single bead) and the crankshaft move (which involves the displacement of two beads at the same time).52 A MC simulation starts from a randomly generated unfolded conformation, and the folding dynamics is monitored by following the evolution of the fraction Q of the established native contacts. The number of MC steps required to fold to the native state (i.e., to achieve Q = 1.0) is the first passage time (FPT) and the folding time is computed as the mean FPT of 500 simulations. Except otherwise stated, folding is studied at the so-called optimal folding temperature Topt, the temperature that minimizes the folding time.36,37,53–55 Throughout the article, the temperature (T) is measured in units of ɛ/kB, where kB is the Boltzmann constant.
To evaluate the frequency of a contact (native and non-native), one first computes the mean (averaged) number of times it forms in the course of a MC run (or part of it), and the frequencies thus obtained are then averaged over 500 independent MC runs.
Folding probability calculation
The folding probability, Pfold, of a conformation is defined as the fraction of MC runs which, starting from that conformation, fold before they unfold.47 Because a Pfold calculation amounts to a Bernoulli trial, the relative error resulting from using M runs scales as M−1/2.56 Thus, in order to accurately compute Pfold, we consider 500 MC runs equally divided into five sets of 100 folding simulations. The average value of Pfold is computed for each set, and the mean of all five sets, together with its standard deviation, is evaluated. Each MC run stops when either the native fold (Q = 1.0) or an unfolded conformation is reached. A conformation is deemed unfolded when its fraction of native contacts Q is smaller than a cut-off value QU. To estimate QU, we followed the procedure adopted in our previous studies.50,57
Analysis of correlations between native and non-native contacts
We associate to each native or non-native contact i a random variable Xi that takes the value 1 (respectively 0) if contact i is present (respectively absent) in a conformation. The correlations between native and non-native contacts are measured by the correlation coefficients ρij of Xi and Xj,
| (4) |
where the index i runs over the 472 non-native contacts, the index j runs over the 57 native contacts, and σj denotes the standard deviation of Xj. The averages in Eq. 4 are taken over the conformations generated along a single folding run (or a part of it), and the ρij obtained in this way are averaged over 500 independent runs. The ρij are normalized correlation measures that take values in the interval [−1, 1]. A pair (i, j) of positively (respectively negatively or anti-) correlated contacts means that, with respect to its overall probability in the ensemble of conformations generated along the runs, the native contact j is more (respectively less) likely to be present when the non-native contact i is also formed.
Glossary
Abbreviations:
- CO
contact order
- MC
Monte Carlo
- MCC
maximally compact conformation
- MFPT
mean first passage time
- MJ
Miyazawa-Jernigan.
References
- 1.Dill KA, Ozkan B, Weikl TR, Chodera JD, Voelz VA. The protein folding problem: when will it be solved? Curr Opin Struc Biol. 2007;17:342–346. doi: 10.1016/j.sbi.2007.06.001. [DOI] [PubMed] [Google Scholar]
- 2.Service RF. Problem solved (*sort of) Science. 2008;321:784–786. doi: 10.1126/science.321.5890.784. [DOI] [PubMed] [Google Scholar]
- 3.Brockwell DJ, Radford SE. Intermediates: ubiquitous species on folding energy landscapes? Curr Opin Struct Biol. 2007;17:30–37. doi: 10.1016/j.sbi.2007.01.003. [DOI] [PMC free article] [PubMed] [Google Scholar]
- 4.Jackson SE. How do small single-domain proteins fold? Fold Des. 1998;3:R81–R91. doi: 10.1016/S1359-0278(98)00033-9. [DOI] [PubMed] [Google Scholar]
- 5.Bai Y. Hidden intermediates and Levinthal paradox in the folding of small proteins. Biochem Biophys Res Commun. 2003;305:785–788. doi: 10.1016/s0006-291x(03)00800-3. [DOI] [PubMed] [Google Scholar]
- 6.Englander SW. Protein folding intermediates and pathways studied by hydrogen exchange. Annu Rev Biophys Biomol Struct. 2000;29:213–238. doi: 10.1146/annurev.biophys.29.1.213. [DOI] [PubMed] [Google Scholar]
- 7.Xu Y, Mayne L, Englander SW. Evidence for an unfolding and refolding pathway in cytochrome c. Nature Struct Biol. 1998;5:774–778. doi: 10.1038/1810. [DOI] [PubMed] [Google Scholar]
- 8.Maity H, Maity M, Englander SW. How cytochrome c folds, and why: submolecular foldon units and their stepwise sequential stabilization. J Mol Biol. 2004;343:223–233. doi: 10.1016/j.jmb.2004.08.005. [DOI] [PubMed] [Google Scholar]
- 9.Schuler B, Eaton WA. Protein folding studied by single molecule FRET. Curr Opin Struct Biol. 2008;18:16–26. doi: 10.1016/j.sbi.2007.12.003. [DOI] [PMC free article] [PubMed] [Google Scholar]
- 10.Ha T, Enderle T, Ogletree DF, Chemla DA, Selvin PR, Weiss S. Probing the interaction between two single molecules: fluorescence resonance energy transfer between a single donor and a single acceptor. Proc Natl Acad Sci USA. 1996;93:6264–6268. doi: 10.1073/pnas.93.13.6264. [DOI] [PMC free article] [PubMed] [Google Scholar]
- 11.Schuler B, Lipman EA, Eaton WA. Probing the free-energy surface for protein folding with single-molecule fluorescence spectroscopy. Nature. 2000;419:743–747. doi: 10.1038/nature01060. [DOI] [PubMed] [Google Scholar]
- 12.Magg C, Kubelka J, Holtermann G, Haas E, Schmid FX. Specificity of the initial collapse in the folding of the cold shock protein. J Mol Biol. 2006;360:1067–1080. doi: 10.1016/j.jmb.2006.05.073. [DOI] [PubMed] [Google Scholar]
- 13.Kuzmenkina EV, Heyes CD, Nienhaus GU. Single-molecule Forster resonance energy transfer study of protein dynamics under denaturing conditions. Proc Natl Acad Sci USA. 2005;102:15471–15476. doi: 10.1073/pnas.0507728102. [DOI] [PMC free article] [PubMed] [Google Scholar]
- 14.Buscaglia M, Schuler B, Lapidus LJ, Eaton WA, Hofrichter J. Kinetics of intramolecular contact formation in a denatured protein. J Mol Biol. 2005;332:9–12. doi: 10.1016/s0022-2836(03)00891-x. [DOI] [PubMed] [Google Scholar]
- 15.Mirny LA, Abkevich V, Shakhnovich EI. Universality and diversity of the protein folding scenarios: a comprehensive analysis with the aid of a lattice model. Fold Des. 1996;1:103–116. doi: 10.1016/S1359-0278(96)00019-3. [DOI] [PubMed] [Google Scholar]
- 16.Hoang TX, Cieplak M. Sequencing of folding events in Gō-type proteins. J Chem Phys. 2000;113:8319–8328. [Google Scholar]
- 17.Ferrara P, Caflisch A. Native topology or specific interactions: what is more important for protein folding? J Mol Biol. 2001;306:837–850. doi: 10.1006/jmbi.2000.4400. [DOI] [PubMed] [Google Scholar]
- 18.Seeliger MA, Brewadr SE, Itzhaki LS. Weak cooperativity in the core causes a switch in folding mechanism between two proteins of the cks family. J Mol Biol. 2005;325:189–199. doi: 10.1016/s0022-2836(02)01202-0. [DOI] [PubMed] [Google Scholar]
- 19.Sutto L, Tiana G, Broglia R. Sequence of events in folding mechanism: beyond the Go model. Protein Sci. 2006;15:1638–1652. doi: 10.1110/ps.052056006. [DOI] [PMC free article] [PubMed] [Google Scholar]
- 20.Reich L, Weikl TR. Substructural cooperativity and parallel versus sequential events during protein unfolding. Proteins. 2006;63:1052–1058. doi: 10.1002/prot.20966. [DOI] [PubMed] [Google Scholar]
- 21.Kaya H, Chan HS. Explicit-chain model of native-state hydrogen exchange: implications for event ordering and cooperativity in protein folding. Proteins. 2005;58:31–44. doi: 10.1002/prot.20286. [DOI] [PubMed] [Google Scholar]
- 22.Travasso RDM, Telo de Gama MM, Faisca PFN. Pathways to folding, nucleation events, and native geometry. J Chem Phys. 2007;127:145106. doi: 10.1063/1.2777150. [DOI] [PubMed] [Google Scholar]
- 23.Faisca PFN, Gomes CM. On the relation between native geometry and conformational plasticity. Biophys Chem. 2008;138:99–106. doi: 10.1016/j.bpc.2008.09.006. [DOI] [PubMed] [Google Scholar]
- 24.Tiana G, Broglia RA. Statistical analysis of native contact formation in the folding of designed model proteins. J Chem Phys. 2001;114:2503–2510. [Google Scholar]
- 25.Broglia RA, Tiana G. Hierarchy of events in the folding of model proteins. J Chem Phys. 2001;114:7267–7273. [Google Scholar]
- 26.Garcia LG, Araujo AFP. Folding pathway dependence on energetic frustration and interaction heterogeneity for a three-dimensional hydrophobic protein model. Proteins. 2006;62:46–63. doi: 10.1002/prot.20711. [DOI] [PubMed] [Google Scholar]
- 27.Gin BC, Garrahan JP, Geissler PL. The limited role of nonnative contacts in the folding pathways of a lattice protein. J Mol Biol. 2009;392:1303–1314. doi: 10.1016/j.jmb.2009.06.058. [DOI] [PubMed] [Google Scholar]
- 28.Faisca PFN. The nucleation mechanism of protein folding: a survey of computer simulation studies. J Phys Condens Matter. 2009;21:373102. doi: 10.1088/0953-8984/21/37/373102. [DOI] [PubMed] [Google Scholar]
- 29.Abkevich VI, Gutin AM, Shakhnovich EI. Specific nucleus as the transition state for protein folding: evidence from lattice model. Biochemistry. 1994;33:10026–10036. doi: 10.1021/bi00199a029. [DOI] [PubMed] [Google Scholar]
- 30.Chan HS, Dill KA. Transition states and folding dynamics of proteins and heteropolymers. J Chem Phys. 1994;100:9238–9257. [Google Scholar]
- 31.Li L, Mirny LA, Shakhnovich EI. Kinetics, thermodynamics and evolution of non-native interactions in a protein folding nucleus. Nat Struct Biol. 2000;7:336–342. doi: 10.1038/74111. [DOI] [PubMed] [Google Scholar]
- 32.Clementi C, Plotkin S. The effects of nonnative interactions on protein folding rates: theory and simulation. Protein Sci. 2003;13:1750–1766. doi: 10.1110/ps.03580104. [DOI] [PMC free article] [PubMed] [Google Scholar]
- 33.de Gennes PG. Kinetics of collapse for a flexible coil. J Phys Lett. 1985;46:L-639–L-642. [Google Scholar]
- 34.Abkevich VI, Gutin AM, Shakhnovich EI. Impact of local and non-local interactions on thermodynamics and kinetics of protein folding. J Mol Biol. 1995;252:460–471. doi: 10.1006/jmbi.1995.0511. [DOI] [PubMed] [Google Scholar]
- 35.Faisca PFN, Telo de Gama MM. Native geometry and the dynamics of protein folding. Biophys Chem. 2005;115:169–175. doi: 10.1016/j.bpc.2004.12.022. [DOI] [PubMed] [Google Scholar]
- 36.Faisca PFN, Ball RC. Thermodynamic control and dynamical regimes in protein folding. J Chem Phys. 2002;116:7231–7238. [Google Scholar]
- 37.Faisca PFN, Ball RC. Topological complexity, contact order and protein folding rates. J Chem Phys. 2002;117:8587–8591. [Google Scholar]
- 38.Plaxco KW, Simmons KT, Ruczinski I, Baker D. Topology, stability, sequence and length: defining the determinants of two-state protein folding kinetics. Biochemistry. 2000;39:11177–11183. doi: 10.1021/bi000200n. [DOI] [PubMed] [Google Scholar]
- 39.Gromiha MM, Selvaraj S. Comparison between long-range interactions and contact order in determining the folding rate of two-state folders: application of long-range order to folding rate prediction. J Mol Biol. 2001;310:27–32. doi: 10.1006/jmbi.2001.4775. [DOI] [PubMed] [Google Scholar]
- 40.Go N, Taketomi H. Respective roles of short- and long-range interactions in protein folding. Proc Natl Acad Sci USA. 1978;75:559–563. doi: 10.1073/pnas.75.2.559. [DOI] [PMC free article] [PubMed] [Google Scholar]
- 41.Miyazawa S, Jernigan RL. Estimation of effective interresidue contact energies from protein crystal structures: quasi-chemical approximation. Macromolecules. 1985;18:534–552. [Google Scholar]
- 42.Shakhnovich EI, Gutin AM. Engineering of stable and fast-folding sequences of model proteins. Proc Natl Acad Sci USA. 1993;90:7195–7199. doi: 10.1073/pnas.90.15.7195. [DOI] [PMC free article] [PubMed] [Google Scholar]
- 43.Chiu TL, Goldstein RA. Optimizing potentials for the inverse protein folding problem. Protein Eng. 1998;11:749–752. doi: 10.1093/protein/11.9.749. [DOI] [PubMed] [Google Scholar]
- 44.Shakhnovich EI, Gutin AM. Evolution-like selection of fast-folding model proteins. Proc Natl Acad Sci USA. 1995;92:1282–1286. doi: 10.1073/pnas.92.5.1282. [DOI] [PMC free article] [PubMed] [Google Scholar]
- 45.Ding F, Guo W, Dokholyan NV, Shakhnovich EI, Shea JE. Reconstruction of the src-SH3 protein domain transition state ensemble using multiscale molecular dynamics simulations. J Mol Biol. 2005;350:1035–1050. doi: 10.1016/j.jmb.2005.05.017. [DOI] [PubMed] [Google Scholar]
- 46.Faisca PFN, Travasso RDM, Ball RC, Shakhnovich EI. Identifying critical residues in protein folding: insights from phi-value and Pfold analysis. J Chem Phys. 2008;129:095108. doi: 10.1063/1.2973624. [DOI] [PMC free article] [PubMed] [Google Scholar]
- 47.Du R, Pande V, Shakhnovich EI. On the role of conformational geometry in protein folding. J Chem Phys. 1999;111:10375–10380. [Google Scholar]
- 48.Zarrine-Afsar A, Wallin S, Mirela Neculai A, Neudecker P, Howell PL, Davidson AR, Chan HS. Theoretical and experimental demonstration of the importance of specific nonnative interactions in protein folding. Proc Natl Acad Sci USA. 2008;105:9999–10004. doi: 10.1073/pnas.0801874105. [DOI] [PMC free article] [PubMed] [Google Scholar]
- 49.Zhang Z, Chan HS. Competition between native topology and nonnative interactions in simple and complex folding kinetics of natural and designed proteins. Proc Natl Acad Sci USA. 2010;107:2920–2925. doi: 10.1073/pnas.0911844107. [DOI] [PMC free article] [PubMed] [Google Scholar]
- 50.Shakhnovich EI. Proteins with selected sequences fold into unique native conformation. Phys Rev Lett. 1994;72:3907–3910. doi: 10.1103/PhysRevLett.72.3907. [DOI] [PubMed] [Google Scholar]
- 51.Metropolis N, Rosenbluth AW, Rosenbluth MN, Teller AH, Teller E. Equation of state calculations by fast computing machines. J Chem Phys. 1958;21:1087–1092. [Google Scholar]
- 52.Landau DP, Binder K. A guide to Monte Carlo simulations in statistical physics. Cambridge University Press; 2000. pp. 122–123. [Google Scholar]
- 53.Oliveberg M, Tan Y, Fersht AR. Negative activation enthalpies in the kinetics of protein folding. Proc Natl Acad Sci USA. 1995;92:8926–8929. doi: 10.1073/pnas.92.19.8926. [DOI] [PMC free article] [PubMed] [Google Scholar]
- 54.Gutin A, Sali A, Abkevich V, Karplus M, Shakhnovich EI. Temperature dependence of the folding rate in a simple protein model: search for a “glass” transition. J Chem Phys. 1998;108:6466–6483. [Google Scholar]
- 55.Cieplak M, Hoang TX, Li MS. Scaling of folding properties in simple models of proteins. Phys Rev Lett. 1999;83:1684–1687. [Google Scholar]
- 56.Hubner IA, Shimada J, Shakhnovich EI. Commitment and nucleation in the protein G transition state. J Mol Biol. 2004;336:745–761. doi: 10.1016/j.jmb.2003.12.032. [DOI] [PubMed] [Google Scholar]
- 57.Travasso RDM, Faisca PFN, Telo da Gama MM. Nucleation phenomena in protein folding: the modulating role of protein sequence. J Phys Condens Matter. 2007;19:285212. [Google Scholar]