

Abstract
Prior X-ray crystal structures of rabbit cytochrome P450 2B4 (2B4) in complex with various imidazoles have demonstrated markedly different enzyme conformations depending on the size of the inhibitor occupying the active site. In this study, structures of 2B4 were solved with the antiplatelet drugs clopidogrel and ticlopidine, which were expected to have greater freedom of movement in the binding pocket. Ticlopidine could be modeled into the electron density maps in two distinct orientations, both of which are consistent with metabolic data gathered with other mammalian P450 enzymes. Results of ligand docking and heme-induced NMR relaxation of drug protons showed that ticlopidine was preferentially oriented with the chlorophenyl group closest to the heme. Because of its stereocenter, clopidogrel was easier to fit in the electron density and exhibited a single orientation, which points the chlorophenyl ring toward the heme. The Cα traces of both complexes aligned very well to each other and revealed a compact, closed structure that resembles the conformation observed in two previously solved 2B4 structures with the small molecule inhibitors 4-(4-chlorophenyl)imidazole and 1-(4-chlorophenyl)imidazole. The 2B4 active site is able to accommodate small ligands by moving only a small number of side chains, suggesting that ligand reorientation is energetically favored over protein conformational changes for binding of these similar sized molecules. Adjusting both protein conformation and ligand orientation in the active site gives 2B4 the flexibility to bind to the widest range of molecules, while also being energetically favorable.
Keywords: cytochrome P450 2B4, X-ray crystallography, NMR, ticlopidine, clopidogrel
Many individual cytochromes P450 (P450s) are able to metabolize broad ranges of substrates. Despite sharing a highly conserved fold, different P450s are able to act on molecules of very different sizes and shapes, with remarkable stereo- and regiospecificity. This variability of substrate geometries implies some degree of protein flexibility and adherence to an induced fit model as opposed to the classical lock and key model of one substrate/one enzyme. Over the last decade, a growing list of mammalian P450 crystal structures has confirmed what was already suspected (1-3), namely that the conformations these enzymes exhibit vary based on the identity of the ligands present.
The largest degree of structural flexibility has been observed in a series of crystal structures of rabbit 2B4 in the presence of various imidazole-based inhibitors (4-7). When complexed with the small molecules 4-(4-chlorophenyl)imidazole (4-CPI) or 1-(4-chlorophenyl)imidazole (1-CPI), 2B4 adopts a closed structure. This compact conformation has the B-C loop region close to the active site to allow better packing with the small ligands, and the regions between the F and G helices associate with the N-terminus of the protein. The binding of the larger ligands, bifonazole or 1-(4-phenyl)benzylimidazole (1-PBI), results in pivoting of the F-G region over the I-helix to accommodate the greater inhibitor volumes. The B-C loop also moves in response to the ligands, but in a less predictable fashion. In addition to the B-C and F-G motifs, the 2B4 structures have led to the identification of other plastic regions that are able to reposition secondary structural elements in response to ligand size and shape. However, it was unclear how these structures related to enzyme conformations with pharmaceutically relevant drugs present in the active site. Recent advances in purification and crystallization methods applied to human P450 2B6 (8), with which 2B4 shares 78% sequence identity, have helped broaden the spectrum of ligands available for crystallization of 2B4. In order to explore these new opportunities, we chose to crystallize 2B4 in complex with clopidogrel and ticlopidine, both of which inhibit human 2B6 (9).
Clopidogrel and ticlopidine are both thienopyridine, antiplatelet prodrugs (Fig. 1), which require activation to their thiol metabolites. The active drugs block ADP binding to its platelet receptor, P2Y12, by an irreversible covalent modification of a cysteine residue. This inhibits platelet aggregation and greatly reduces the risk of vascular disease, myocardial infarction, and stroke (10). Combined with an aspirin regimen, both drugs have been shown to enhance the prevention of additional ischemic events in high risk patients (11).
Figure 1.
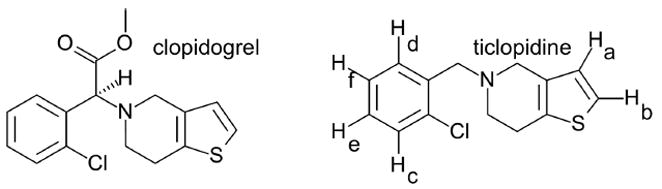
Chemical structures of the antiplatelet prodrugs, clopidogrel and ticlopidine. The ticlopidine structure includes proton labels used for NMR studies as described in Materials and Methods. BKchem version 0.13.0, 2009 (http://bkchem.zirael.org/index.html) was used for drawing chemical structures.
P450-mediated oxidation of ticlopidine and clopidogrel leads to numerous products. In vivo studies have identified three primary means of metabolism for ticlopidine in rats and human resulting from N-dealkylation, N-oxidation and oxidation of the thiophene ring (12, 13). However, in vitro studies have found additional ticlopidine metabolites, including a thiophene-S-oxide dimer formed by 2C19 and 2D6 (14), dihydrothienopyridinium and thienopyridinium species formed by 1A2, 2C9, 2C19, 2D6, and 3A4 (15), and two hydroxyl metabolites formed in rat liver microsomes that occur via epoxidation of the chlorophenyl ring (16). Additionally, oxidation of the thiophene ring of clopidogrel to various compounds has been shown to be catalyzed by 1A2, 2B6, 2C9, 2C19, and 3A4 (17). Presumably, which products are formed is related to the orientation the drug adopts in the active site.
Metabolites formed via oxidation of the thiophene ring are known to inhibit several P450s, including 1A2, 2B6, 2C9, 2C19, and 2D6 (9, 18). It has been shown that during metabolism of ticlopidine, the formation of either a thiolactone or thiophene-S-oxide intermediate results in mechanism-based inactivation of 2C19 and possibly 2D6 (14). Since 2B6 also produces a thiolactone intermediate during clopidogrel metabolism (17) and is inactivated by both clopidogrel and ticlopidine (9), it has been inferred that the 2B6 inactivation process occurs by a similar mechanism as 2C19. The inhibition of P450s is known to create adverse drug-drug interactions, which could lead to increased toxicity of pharmaceuticals during combined therapeutic regimens. However, P450 mechanism-based inactivation results in more severe effects because cells must synthesize new proteins to replace those that have been inactivated (19). It has been reported that bupropion hydroxylation by 2B6 was suppressed by clopidogrel and ticlopidine by 68% and 90% respectively (20). Also, 2C19 activity toward both phenytoin and omeprazole is inhibited by ticlopidine (21, 22). These results indicate that the antiplatelet drugs clopidogrel and ticlopidine may significantly alter metabolism of other drugs that are metabolized by these P450s and possibly others.
Given the sequence and structural similarities between 2B6 and 2B4 (8), the greater number of 2B4 crystal structures for comparison and analysis (4-7, 23), and the wealth of biochemical data gathered on 2B4 (3, 24), this enzyme was selected for crystallization with both drugs. This study describes the structures of the clopidogrel and ticlopidine complexes of 2B4 by X-ray crystallography. To investigate the preferred orientation of ticlopidine deduced from X-ray crystallography in the active site, heme-induced NMR relaxation of ligand protons (25-27) by 2B4 was used. Ligand docking of ticlopidine in the active site also supported the NMR results. The two crystal structures reported here are the first examples of 2B4 bound to non-imidazole-based inhibitors.
Materials and Methods
Materials
Ribonuclease A, ticlopidine, and clopidogrel were from Sigma-Aldrich (St. Louis, MO). 5-Cyclo-hexylpentyl-β-D-maltoside (Cymal-5) was from Anatrace (Maumee, OH). Fifty kDa molecular weight protein cutoff Amicon Ultra filtration devices were from Millipore (Billerica, MA). Nickel-nitrilotriacetic acid affinity resin was from Qiagen (Valencia, CA). DE52 anion exchange resin was from Whatman (Maidstone, Kent, UK). Macroprep CM cation exchange resin was from Bio-Rad Laboratories (Hercules, CA). TOPP3 cells were from Stratagene (La Jolla, CA). Wizard I & II crystallization screens were from Emerald Biosystems (Bainbridge Island, WA). The synthesis of the facial amphiphiles 3α,7α,12α-tris[(β-D-maltopyranosyl)ethyloxy]cholane (232-chol) and 3α-hydroxy-7α,12α-bis[[[2-(trimethylamino)ethyl]phosphoryl]ethyloxy]cholane (234-chol) was performed essentially according to a previous method (28) and will be reported in more detail elsewhere. Human cytochrome P450 2B6dH (2B6) was expressed and purified as described previously (8).
Protein Expression and Purification
Cytochrome P450 2B4dH(H226Y) (2B4) was expressed in E. Coli TOPP3 cells as described previously (4). The H226Y mutant is used to avoid the dimerization seen in the ligand-free structure (23). Protein purification was carried out according to Gay et al. (8). Briefly, an overnight, Luria-Bertani broth culture of E. coli containing the pKK2B4dH(H226Y) plasmid was used to inoculate Terrific broth. Terrific broth cultures were grown at 37° C until A600nm reached approximately 1.0. Protein expression was induced by the addition of isopropyl β-D-1-thiogalactopyranoside and δ-aminolevulinic acid. Protein expression continued for 60-69 h at 30 °C, after which the cells were harvested by centrifugation. The cell pellet was resuspended in 10% of the original culture volume in buffer containing 20 mM potassium phosphate (pH 7.4 at 4 °C), 20% (v/v) glycerol, 10 mM 2-mercaptoethanol (BME), and 1.0 mM phenylmethylsulfonyl fluoride (PMSF). The resuspended cells were further treated with lysozyme (0.3 mg/mL) and stirred for 30 min at 4 °C, followed by a brief centrifugation for 15 min at 7000 rpm in a JA-14 rotor in an Avanti J-26 XPI Centrifuge (Beckman Coulter, Inc., Fullerton, CA). Spheroplasts were again resuspended in 5% of the original culture volume in buffer containing 500 mM potassium phosphate (pH 7.4 at 4 °C), 20% (v/v) glycerol, 10 mM BME, and 0.5 mM PMSF and were sonicated three times for 45 s on ice. The membrane pellet was separated by centrifugation for 10 min at 7000 rpm in the same centrifuge and rotor as above. Cymal-5 and ribonuclease A were added to the supernatant at final concentrations of 4.8 mM and 4.0 μg/mL respectively, and this was allowed to stir for 2 hours at 4 °C prior to ultracentrifugation for 45 min at 45000 rpm using a fixed-angle Ti 50.2 rotor in an Optima L-80 XP Ultracentrifuge (Beckman Coulter, Inc., Fullerton, CA). The P450 concentration in the supernatant was determined from the reduced CO difference spectra.
The supernatant was loaded onto a pre-packed Ni-NTA column and was washed with buffer containing 100 mM potassium phosphate (pH 7.4 at 4 °C), 100 mM NaCl, 20% (v/v) glycerol, 10 mM BME, 0.5 mM PMSF, 4.8 mM Cymal-5, and 1 mM histidine. The protein was eluted using 30 mM histidine in the same buffer as above. The pooled P450 containing fractions were incubated with DE52 resin for 15 min to remove E. coli RNA in the sample. The supernatant was collected by centrifugation and diluted 10-fold in buffer containing 5 mM potassium phosphate (pH 7.4 at 4 °C), 20% (v/v) glycerol, 1 mM ethylenediaminetetraacetic acid (EDTA), 0.2 mM dithiothreitol (DTT), 0.5 mM PMSF, and 4.8 mM Cymal-5, prior to loading onto a Macroprep CM cation exchange column. The column was washed using 5 mM potassium phosphate (pH 7.4 at 4 °C), 20 mM NaCl, 20% (v/v) glycerol, 1 mM EDTA, and 0.2 mM DTT and the protein was eluted with high salt buffer containing 50 mM potassium phosphate (pH 7.4 at 4 °C), 500 mM NaCl, 20% (v/v) glycerol, 1 mM EDTA, and 0.2 mM DTT. Protein fractions with the highest A417/A280 ratios were pooled, and the P450 concentration was measured using reduced CO difference spectra.
Spectral Binding
For binding studies, difference spectra were recorded using 1 μM P450 on a 2401 PC spectrophotometer (Shimadzu Corp., Kyoto, Japan) at 25 °C as described earlier (29). In brief, the difference in absorbance between the maxima and minima (ΔA) was recorded after the addition of a series of ticlopidine/clopidogrel concentrations in methanol to the sample cuvette and the same amount of methanol to the reference cuvette. For the comparison of 2B4 and 2B6, protein samples were maintained in buffer containing 50 mM potassium phosphate (pH 7.4), 500 mM NaCl, 500 mM sucrose, 1 mM EDTA, and 0.2 mM DTT. For the determination of the dissociation constant of ticlopidine under NMR conditions, 2B4 was in 25 mM potassium phosphate (pH 7.0). In both cases, the spectral dissociation constants (Ks) were obtained by fitting the data to the equation for “tight binding” 2ΔA = (ΔAmax / [E0]) ((KD + [I0] + [E0]) + ((KD + [I0] + [E0]))2 - 4[E0][I0])1/2), where [E0] and [I0] are total enzyme and total inhibitor concentrations, respectively. All data treatment and fitting of the titration curves were performed with our SpectraLab software (30) or using Igor Pro 6.1 (Wavemetrics, Inc., Lake Oswego, Oregon). In addition to fitting the titrations, the absolute absorbance spectrum of 2B4 with saturating 1.15 mM ticlopidine were fit by least squares method using software written in the Python programming language as described previously (31).
Enzyme Inhibition
The Ki values were determined using 7-ethoxy-4-trifluoromethylcoumarin (7-EFC) O-deethylation measured in a final reaction volume of 100 μl at 0.5 to 5.0 μM drug concentrations and 0 to 150 μM substrate concentrations. In brief, the reaction mixture contained 7-EFC in the standard reconstitution system (P450: cytochrome P450 NADPH reductase: cytochrome b5, 1:4:2) at 10 pmol P450 in 50 mM HEPES (pH 7.4), 15 mM MgCl2, and 2% methanol. The reaction was performed at 37 °C for 5 min using 1 mM NADPH. The Ki was determined using enzyme kinetic fit from SigmaPlot software (Systat Software, Inc., Point Richmond, CA).
Crystallization and Data Collection
Pooled protein was diluted to 18 μM in 50 mM potassium phosphate (pH 7.4 at 4 °C), 500 mM NaCl, 500 mM sucrose, 1 mM EDTA, and 0.2 mM DTT. Ticlopidine was added to this sample at 54 μM and the solution was incubated at 4 °C overnight. An additional 30 mL of the above buffer containing 54 μM ticlopidine was prepared to further dilute the glycerol present in the protein sample. Buffer exchange was performed by concentrating the diluted protein solution to approximately 0.55 mM followed by dilution to 18 μM, and the process repeated twice before finally concentrating the 2B4–ticlopidine complex to 0.55 mM. The concentrated complex was supplemented with 4.8 mM Cymal-5, 1.65 mM ticlopidine, and 0.028% (w/v) 232-chol. Crystal screening was performed by sitting drop vapor diffusion using the Wizard II high throughput kit by mixing equal volumes of the 2B4–ticlopidine mixture and the well solution. Drops were equilibrated against the well solutions at 18 °C. Crystals for X-ray diffraction grew over the course of a week in drops containing the well solution of 20% (w/v) PEG 8000, 0.2 M MgCl2 and 0.1 M Tris (pH 8.5). Crystals were transferred to a solution of mother liquor supplemented with 335 mM sucrose for 3.5 min before flash freezing in liquid nitrogen. 120° of data were collected using 0.5° oscillations and 30 s exposures at 100 K on a Quantum CCD detector (Area Detector Systems Corp., Poway, CA) at BL 11-1 of the Stanford Synchrotron Radiation Lightsource (SSRL) (Stanford, CA). The data was processed to 2.67 Å using iMOSFLM (32) and SCALA (33).
Clopidogrel was added to pooled 2B4 fractions, which were concentrated as described above, except 0.077% (w/v) 234-chol was substituted for 232-chol. Conditions were screened as described above using the Wizard I high throughput kit. Crystals grew at 18 °C in drops containing the well solution of 20% (w/v) PEG 8000, 0.2 M NaCl and 0.1 M phosphate-citrate (pH 4.2). Crystals were transferred to a solution of mother liquor supplemented with 335 mM sucrose for 2 min before flash freezing in liquid nitrogen. 155° of data were collected using 0.5° oscillations and 20 s exposures at 100 K on the same detector as above at BL 11-1 of SSRL. Due to crystal decay from the X-ray beam, only the first 240 frames (120°) were used and processed to 3.10 Å using iMOSFLM and SCALA.
Structure Determination and Refinement
The 2B4–ticlopidine complex structure was determined by molecular replacement using the previously solved 2B4–4-CPI complex (PDB ID 1SUO) (with the 4-CPI inhibitor removed from the coordinates) in Phaser (34). The structure solution determined the space group to be P3221, containing 61.6% solvent assuming one protein molecule per asymmetric unit. The initial model was subjected to rigid body refinement and a restrained refinement using REFMAC (35). Model building was performed in COOT (36) using both 2Fo-Fc and Fo-Fc electron density maps contoured to 1-σ and 3-σ respectively. The model was modified to fit the density and refined in an iterative manner until a final R-factor of 19.8% and an Rfree of 25.3% were reached.
The 2B4–clopidogrel complex structure was determined by molecular replacement in Phaser using the same search model as the ticlopidine structure. The solution was found in space group P3, containing 70.7% solvent assuming four monomers per asymmetric unit. The data were uploaded to the UCLA twinning server and determined to have a twin fraction of 0.43 (37, 38). The initial model was subjected to rigid body refinement and a restrained refinement using REFMAC with the amplitude-based twin refinement and non-crystallographic symmetry options enabled. Model building and refinement was performed as described above until a final R-factor of 17.8% and an Rfree of 23.4% were reached. The non-crystallographic symmetry restraints were slowly released during this process. Structure refinement statistics are summarized in Table 1.
Table 1.
X-ray Data Collection & Refinement Statistics
| Crystal Data | ||
| Complex | Ticlopidine | Clopidogrel |
| Space Group | P3221 | P3 |
| Unit Cell | ||
| a, b, c (Å) | 93.5, 93.5, 137.1 | 234.5, 234.5, 57.32 |
| α, β, γ (°) | 90, 90, 120 | 90, 90, 120 |
| Data Collection | ||
| X-ray source | SSRL BL 11-1 | SSRL BL 11-1 |
| Wavelength (Å) | 0.98 | 0.98 |
| Resolution Range (Å) | 69.67 - 2.67 | 76.76 - 3.10 |
| Total Observations | 144,860 | 249,852 |
| Unique Observations (F>0) | 20,223 | 62,529 |
| Completeness (%)a | 99.8 (100.0) | 97.7 (98.6) |
| Redundancya | 7.2 (7.2) | 4.0 (3.9) |
| I/σa | 4.9 (1.7) | 4.7 (1.6) |
| Rmerge (%)a,b | 10.1 (41.6) | 13.0 (43.2) |
| Refinement Statistics | ||
| R-factor (%)c | 19.80 | 17.77 |
| Rfree (%)c | 25.30 | 23.41 |
| RMS bond lengths (Å) | 0.010 | 0.019 |
| RMS bond angles (°) | 1.406 | 1.936 |
| Number of Atoms | ||
| Proteind | 3743 (66.4) | 14920 (42.3) |
| Hemed | 43 (49.6) | 172 (28.3) |
| Ligandd | 17 (69.4) | 84 (104.0) |
| Cymal-5d | 68 (96.6) | NA |
| Cholated | 80 (117.2) | NA |
| Waterd | 31 (62.5) | 176 (28.5) |
Values for the highest resolution shell are in parentheses.
Rmerge = [ΣhΣi|Ih-Ihi|/ΣhΣiIhi] where Ih is the mean of Ihi observations of reflection h.
R-factor & Rfree = Σ∥Fobs|-|Fcalc∥/Σ|Fobs| × 100 for 95% of the recorded data (R-factor) and 5% of data (Rfree).
Average B-factors (Å2) are in parentheses.
Active Site Cavity Volume Calculations
Active site cavity volumes were calculated using the program Voidoo (39). Ten cycles of cavity detection using a probe occupied volume were performed with a probe radius of 1.40 Å.
Ligand Docking
Ligand docking was performed by two methods. In one method, Autodock4 (40) was used to allow free movement of the ticlopidine in the 2B4 active site, but the protein side chains were fixed in place. Prior to docking, the 2B4–ticlopidine complex coordinate file was modified. Any residues not modeled into the experimental electron density were added using COOT and ticlopidine, Cymal-5, and 232-chol were removed from the file. The Autodock4 script used to simulate ligand binding added all hydrogen atoms to the protein and ligand PDB files, removed any water molecules, and was run with default settings. Small molecule charges were set to Gasteiger. Charges found on the heme were modified using a separate script citing values previously reported (41). The docking experiment included 100 events using a grid size of 70 Å × 70 Å × 70 Å with 0.375-Å spacing.
The second method used simulated annealing (42), which applied NMR-derived distance restraints from the paramagnetic relaxation experiments as described for other systems (43, 44). Residues missing from the protein coordinate file were added using the homology modeling program Modeller (45). Ticlopidine was then manually docked in an arbitrary orientation in the X-ray crystal structure of 2B4 using PyMOL (46). Distance-restrained simulated annealing and energy minimization of 2B4 and ticlopidine was performed with the software package Groningen MAchine for Chemical Simulation (GROMACS) Version 4.07 (47). The 2B4–ticlopidine complex was simulated with the GROMOS96 53a6 force field (48) and the particle mesh Ewald (49) method for electrostatics. Ticlopidine was restrained using the NMR-calculated distances from Table 3 with a force constant of 600 kJ mol-1 nm2. A time constant of 50 ps was applied to the distance restraint to allow the molecule to move in the active site during the simulation, since the NMR distances reflect multiple orientations of ticlopidine in the 2B4 active site. The molecule was then energy minimized using the conjugate gradient method to eliminate Van der Waals contacts. The system was then heated to 800 K and cooled to 300 K in 150 ps and allowed to equilibrate for 100 ps at 300 K.
Table 3.
Paramagnetic Relaxation and Calculated Distances of 1.15 mM ticlopidine in the presence of 5 μM 2B4.
| Peak | RFe3+ (s-1) | RFe2+-CO(s-1) | RP (s-1) | rappa(Å) | rX-rayb (Å) | rX-rayc (Å) |
|---|---|---|---|---|---|---|
| a | 2.03 ± 0.22 | 0.77 ± 0.04 | 1.26 ± 0.22 | 7.54 ± 0.22 | 3.34 | 10.49 |
| b | 2.27 ± 0.17 | 0.89 ± 0.06 | 1.38 ± 0.18 | 7.43 ± 0.16 | 4.92 | 12.57 |
| c | 2.86 ± 0.09 | 1.00 ± 0.03 | 1.87 ± 0.10 | 7.06 ± 0.06 | 11.95 | 4.87 |
| d | 2.72 ± 0.07 | 1.11 ± 0.03 | 1.61 ± 0.08 | 7.23 ± 0.06 | 9.86 | 8.77 |
| e | 3.16 ± 0.29 | 1.00 ± 0.05 | 2.16 ± 0.29 | 6.89 ± 0.16 | 13.01 | 7.15 |
| f | 2.81 ± 0.21 | 1.05 ± 0.07 | 1.76 ± 0.22 | 7.13 ± 0.15 | 12.16 | 8.68 |
Calculated time-averaged distances between the ticlopidine protons and the heme iron. The KD used for the distance calculation was 5.95 μM ± 1.20 μM (Fig. S2E). Concentrations of 58% LS and 42% HS were calculated using least squares fitting in the presence of saturating 64 μM ticlopidine (Fig. S2F). The error reflects uncertainty in the calculation and not a maximum and minimum distance of protons from the heme (78).
Distances to the heme iron determined by adding protons to the ticlopidine molecule in the X-ray crystal structure ‘thiophene down’ orientation.
Distances to the heme iron determined by adding protons to the ticlopidine molecule in the X-ray crystal structure ‘chlorophenyl down’ orientation.
Protein Figures
All protein figures were generated using PyMOL (46).
Proton NMR and Longitudinal (T1) Relaxation Measurements of Ticlopidine
For these studies, NMR experiments on ticlopidine in the presence of purified 2B4 were performed on a 600 MHz Bruker Avance III (Bruker Daltonics Inc., Billerica, MA) with a three channel (1H,15N,13C) cryoprobe as described previously (27, 50-52). The NMR longitudinal relaxation was measured using a pulse sequence containing a 180° inversion pulse followed by a WATER suppression by GrAdient Tailored Excitation (WATERGATE) (53) or by excitation sculpting pulse sequence (54). The NMR samples contained 5 μM 2B4 and 1.15 mM ticlopidine in 25 mM potassium phosphate pD 7.0 with >99% D2O with 1% D4-methanol as a co-solvent for ticlopidine. The low ionic strength buffer was necessary to prevent the drug from aggregating, which interfered with the NMR measurement. In addition, the NMR relaxation measurements were performed at a range of protein concentrations as done previously (55). However, the most sensitive and least error prone measurements were done at a single concentration of 5 μM P450 2B4 and 1.15 mM ticlopidine. NMR relaxation measurements at lower concentrations of P450 2B4 showed less sensitivity and greater errors, while measurements at higher concentrations of P450 2B4 were hindered by broadening of the ticlopidine peaks. The selected conditions also allowed ticlopidine to exchange rapidly between the bulk solvent and the 2B4 active site, which is also essential for the experiment (see Supporting Information, pp. 2-3). Paramagnetic samples, where heme iron is in the Fe3+ state, were prepared by purging for 2 h under argon in sealed 5 mm NMR tubes. Diamagnetic samples, where the heme iron is in the Fe2+ state, were made by first gently bubbling in carbon monoxide for 1 min. Then a small amount of dithionite was added to the sample under a flow of argon. As a measure of anaerobicity, BD Dry Anaerobic indicator strips for GasPak jar systems (BD Biosciences, San Jose, CA) were dipped in a dithionite solution prior to inserting the strips into the NMR tube. A strip that turned blue during the NMR experiments was deemed contaminated with oxygen and the experiment was repeated, since oxygen would introduce errors into the relaxation measurements.
Processing, Background Subtraction, and Deconvoluting NMR spectra
NMR spectra were processed using iNMR (Corunna, Spain). The NMR spectra were then translated into the ASCII text format and imported into Igor Pro 6.1. The background and baseline were subtracted from NMR spectra using software written in the Python programming language Version 2.6.4 and integrated into Igor Pro 6.1. The NMR spectra were then curve fit using methods that have been described previously (56-59). Curve fitting was accomplished in two steps. First, the positions of the peaks were estimated by analyzing the spectra under different conditions including different protein concentrations and different solvent conditions (Fig. S1) and by analyzing the NMR spectra by principal component analysis (PCA) as described previously (60-62). The latter PCA analysis was accomplished using software written in the Python programming language with the module Numpy and integrated into Igor Pro 6.1. Using the peak positions determined from the previous analyses, the data were fit to a linear combination of Gaussian, Lorenzian or Voigt line shapes (56-58, 63) by using the multiple peak fitting package (Version 2.0) of Igor 6.1 and a least-squares fitting program written in Python using the Numpy.
Singular Value Decomposition Analysis of the NMR Relaxation Measurements
Singular value decomposition (SVD) analysis was used to measure amplitudes of the NMR peaks using reference peaks standards simulated from the curve fitting (Fig. 2), which was similar to other SVD methods using prior knowledge of the NMR spectra (64-66). The SVD algorithm was written in Python programming language Version 2.6.4 using Numpy, and integrated into the scientific analysis package Igor Pro 6.1. In terms of accurately measuring peak amplitude, this method produced far superior signal to noise than other methods such as measuring the peak amplitude directly or integrating the peak. The SVD-derived amplitudes were then fit using a single exponential function in Igor Pro 6.1.
Figure 2.
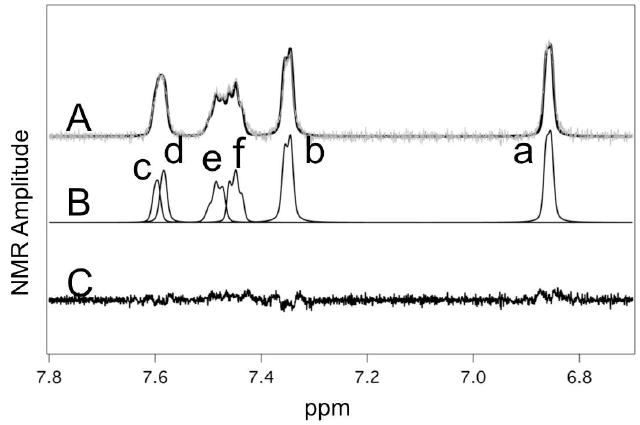
Fitting of NMR spectrum of ticlopidine in the presence of 5 μM reduced 2B4. A. NMR spectrum (gray line) and the simulated fit (black line) of ticlopidine in the presence of reduced 2B4 with the background subtracted. B. Simulations of the individual NMR transitions that comprise the ticlopidine spectrum with lowercase letters denoting the proton assignments from Fig. 1. C. Residual between the simulated fit and the NMR spectrum.
Calculating Distances of Ticlopidine Protons from the 2B4 Heme Iron
The paramagnetic relaxation rate (RP) was calculated by taking the differences between oxidized P450 and reduced P450. This relationship can be represented mathematically; RP = RFe3+ − RCO-Fe2+, where RP is the paramagnetic relaxation rate, RFe3+ is the relaxation rate of the oxidized P450 and RCO-Fe2+ is the relaxation rate of reduced P450 with carbon monoxide. The paramagnetic relaxation rate was related to distance by the Solomon-Bloembergen equation (Eq. 1) (SI Units) (67), where α is the fraction of ligand bound, μ0 is the magnetic permeability of free space, γN is the nuclear gyromagnetic ratio, ge is the electronic g-factor, μB is the Bohr magneton, r is the apparent time-averaged electron-nuclear distance, τC is the correlation time for the nuclear-electron interaction vector, S is the electronic spin quantum number and ωN and ωE are the radial frequencies of the nucleus and electron, respectively. The μ0/4π term of the equation was used to convert the equation to SI units, which was absent in older equations because they were originally based on centimeter-gram-second units (67). The fraction of ligand (α) was calculated from the following equation: α = [EL]/[L0] = [E0]/(KD + [L0]), where [EL] is the concentration of the enzyme ligand complex, [L0] is the total concentration of substrate and KD is the dissociation constant. The S(S+1) term accounts for the spin state of the P450. For mixed spin state systems (26), it was calculated using the following equation: S(S + 1) = 8.75fHS + 0.75fLS, where fHS and fLS are the fraction of high spin and low spin, which were determined by least squares fitting 2B4 standards of an absolute absorbance spectrum of 2B4 in the presence of saturating ticlopidine as previous described (31, 68) and shown in Figure S1. A correlation time for the nuclear-electron interaction vector (τC) of 3 × 10⁻¹⁰ was used in the calculation and it is the average value of P450s under several conditions (27, 69). The ωN term is equal to 3.77 × 10⁹ rad s-1 and ωE is equal to - 2.48 × 10¹² rad s-1.
The Effect of Ligand Dynamics on RP, rapp and ravg
Because of ligand dynamics and the fast exchange requirement for these measurements, the distances calculated from this analysis are not likely to represent absolute distances, but time-averaged distances weighted toward the shortest distance. The time averaging of the distances of mobile nuclei and paramagnetic species was accomplished using the ensemble approach (70, 71). The time-dependent ensemble averaging equations of the RP and rapp are shown in Equation 2, where Δtn is the fraction of time, t is the total time and ft is the fraction of time at an individual distance. The left part of Equation 2 shows that the paramagnetic relaxation rate (RP) is linearly related to the individual relaxation rates, whereas the rapp has r6 dependence in the right part. The effect of this is that the rapp will be skewed toward the shortest distance, whereas the paramagnetic relaxation rate will remain linear. For a molecule that fluctuates, the average distance (ravg) is quite different than rapp and was calculated using Equation 3. Like RP, the ravg is linear with respect to the individual distances (rn) in contrast to rapp. To provide a better understanding of the time averaging effect of rapp, a simulation of rapp, ravg and RP is presented in the Supporting Information.
| Eq. 1 |
| Eq. 2 |
| Eq. 3 |
Results
Spectral Binding and Enzyme Inhibition
Clopidogrel and ticlopidine both induced type I difference spectra with a peak at ~ 388 nm and a trough at ~ 420 nm (Fig. S2). 2B6 and 2B4 showed similar ΔAmax values with clopidogrel and ticlopidine. Compared with 2B6, 2B4 showed approximately 4-, and 6-fold higher Ks values with ticlopidine and clopidogrel, respectively (Fig. S2, Table 2). The Ki values were determined for competitive inhibition of 2B6 and 2B4 by clopidogrel and ticlopidine using 7-EFC at concentrations up to 150 μM and 0 to 5 μM drug concentrations. P450 2B4 showed 4-fold and 6-fold higher Ki values than 2B6 with clopidogrel and ticlopidine, respectively (Fig. S3, Table 2).
Table 2.
Spectral Binding and Inhibition Studies
| Drug | 2B4dH | 2B6dH | ||||
|---|---|---|---|---|---|---|
| ΔAmax (OU μM-1) | Ks (μM) | Ki (μM) | ΔAmax (OU μM-1) | Ks (μM) | Ki (μM) | |
| Clopidogrel | 0.05 ± 0.001 | 0.6 ± 0.06 | 0.36 ± 0.04 | 0.04 ± 0.005 | 0.1 ± 0.07 | 0.10 ± 0.01 |
| Ticlopidine | 0.03 ± 0.008 | 1.3 ± 0.1 | 0.81 ± 0.10 | 0.02 ± 0.001 | 0.3 ± 0.13 | 0.14 ± 0.02 |
Standard errors for fit to the respective equations are shown. Results are representative of at least two independent determinations. O.U. stands for optical units.
2B4–Ticlopidine Complex
The protein backbone of the 2B4–ticlopidine complex is very similar to the closed 2B4–4-CPI complex (5) that was used as a molecular replacement search model (Fig. S4). With an RMSD of 0.37 Å over all Cα, the largest differences occur in the C/D loop and the I helix. Changes in side chain orientations compared with the molecular replacement model were fit into the electron density maps with little effort (Fig. S5A). Additionally, two Cymal-5 molecules and a partial 232-chol molecule were modeled into the electron density. This 232-chol molecule mediates a crystallographic two-fold axis near the F’ helix. Two lobes of electron density of approximately the same size and consistent with ticlopidine sat above the plane of the heme. Initially the substrate was modeled with the thiophene ring closest to the heme (Figs. 3A, 3B) in accordance with metabolic data on human P450 2B6 (72). However, during refinement, ticlopidine could also fit the density when flipped ‘upside-down’ to point the chlorophenyl moiety toward to the heme (Figs. 3C, 3D) without generating negative peaks in Fo-Fc maps. In light of these results, ticlopidine was modeled into the electron density maps in two orientations. In one orientation, the thiophene ring occupies the lobe of density closest to the heme (Fig. 4A). In this case, the sulfur atom is 6.6 Å away from the heme iron, while the carbon bearing proton ‘a’ (Fig. 1) is closest at a distance of 4.3 Å. In the second orientation, the chlorophenyl group occupies the lobe of electron density closest to the heme (Fig. 4B). The chlorine atom makes the nearest approach to the heme iron, with a distance of 4.1 Å. In both orientations ticlopidine makes contact with Ile 101, Ile 114, Phe 206, Ile 209, Ser 210, Phe 297, Ala 298, E301, Thr 302, Ile 363, Val 367, and Val 477, which are found within a 5-Å radius of the ligand. The ‘chlorophenyl down’ orientation has an additional contact with Phe 115.
Figure 3.
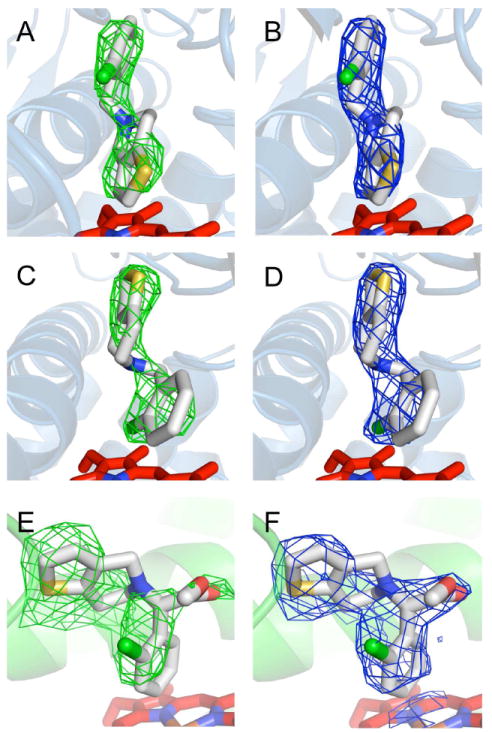
Electron density maps for ticlopidine and clopidogrel. A. Unbiased Fo-Fc simulated annealing omit map for ticlopidine contoured at 3-σ shows two lobes of electron density above the plane of the heme with the ‘thiophene down’ orientation for the ligand. B. 2Fo-Fc map for the ‘thiophene down’ orientation of ticlopidine contoured at 1-σ after refinement. C. The same Fo-Fc omit map from A. is shown with the alternative ‘chlorophenyl down’ orientation of ticlopidine. D. 2Fo-Fc map for the ‘chlorophenyl down’ orientation of ticlopidine contoured at 1-σ after refinement. E. Unbiased Fo-Fc simulated annealing omit map for clopidogrel contoured at 3-σ shows two large lobes and one smaller lobe of electron density above the plane of the heme. F. 2Fo-Fc map for clopidogrel contoured at 1-σ shows clearly shows its orientation after refinement.
Figure 4.
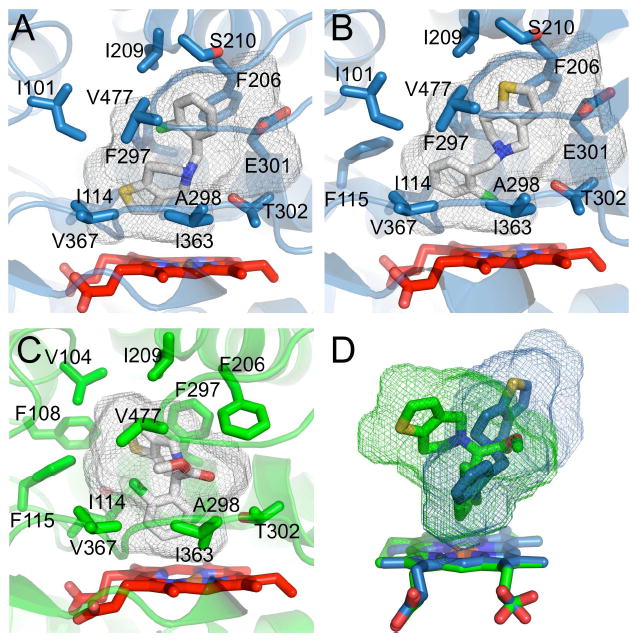
Ribbon and stick diagrams showing the active site of 2B4. The gray meshes show the active site cavity volumes as calculated by Voidoo in Materials and Methods. A. Residues within a 5-Å radius of the ligand make up the ticlopidine binding site. In the ‘thiophene down’ orientation ticlopidine makes contact with Ile 101, Ile 114, Phe 115, Phe 206, Ile 209, Ser 210, Phe 297, Ala 298, Glu 301, Thr 302, Ile 363, Val 367, and Val 477. The active site cavity is long and flat, following the shape of the ticlopidine molecule from the D ring of the heme toward the F and G helices. Heme is shown as red sticks and ticlopidine as white sticks. B. The ‘chlorophenyl down’ orientation of ticlopidine sits in the same pocket, but has an additional contact with Phe 115. C. Residues within a 5-Å radius of the ligand make up the clopidogrel binding site. These residues are Val 104, Phe 108, Ile 114, Phe 115, Phe 206, Ile 209, Ser 294, Phe 297, Ala 298, Thr 302, Ile 363, Val 367, and Val 477. The active site cavity is roughly globular with a protrusion along the I helix where the thiophene ring sits. Heme is shown as red sticks and clopidogrel as white sticks. D. An overlay of meshes highlights the differences in the active site cavities of the two complexes. The ticlopidine and clopidogrel complexes are shown in blue and green, respectively.
2B4–Clopidogrel Complex
In order to further explore the interactions of 2B4 with antiplatelet drugs, we crystallized the enzyme in the presence of clopidogrel. The 2B4–clopidogrel structure also shares high similarity with the 2B4–4-CPI complex (Fig. S4). A structural alignment of the entire backbone yields an RMSD of 0.32 Å with the largest differences occurring in the C/D and H/I loops and the I helix. Despite the modest resolution, differences in side chain orientations were easily identified in the electron density maps (Fig. S5B). Clopidogrel was found to occupy a tri-lobed region of electron density (Figs. 3D, 3E) above the heme plane with the chlorophenyl group making the closest approach to the heme. The closest points of clopidogrel are two carbon atoms, each measuring 3.6 Å from the heme iron. The thiophene ring points in the opposite direction along the I helix compared with the ‘chlorophenyl down’ orientation of ticlopidine (Figs. 4C, 4D) and is sequestered by a number of phenylalanine residues (Phe 108, Phe 115, Phe 206, and Phe 297) on the B/C loop and F and I helices as well as Val 104, Ile 114, Ile 209, and Ser 294. The remaining residues that come into contact with the ligand are Ala 298, Thr 302, Ile 363, Val 367, and Val 477. The carboxymethyl moiety is not within hydrogen-bonding distance of any polar side chain or main chain atoms.
Ligand Docking
To further evaluate the two ticlopidine orientations modeled into the electron density maps, the molecule was docked into the 2B4–ticlopidine complex active site cavity by two separate methods. Performing 100 Autodock runs where protein side chains were fixed in place, two clusters of poses for ticlopidine were observed. The most populated cluster contained 95 poses, all with a mean binding energy of -7.79 kcal/mol. These poses put the chlorophenyl ring closest to the heme in an orientation that is consistent with the ‘chlorophenyl down’ orientation observed in the X-ray crystal structure (Fig. S6A), although the thiophene ring is rotated ~180° with respect to the chlorophenyl ring. The other five poses occupied the second cluster and had mean binding energies ranging from -7.77 to -7.76 kcal/mol. These poses all placed the thiophene ring closest to the heme with the chlorophenyl ring above it (Fig. S6B). However, due to bond rotations this cluster does not correlate to the ‘thiophene down’ orientation from the crystal structure.
The binding of ticlopidine was also explored using distance-restrained simulated annealing. The final 10 preferred orientations deduced from the simulation (Fig. S6C) position ticlopidine with the chlorophenyl ring closest to the heme in an orientation that is consistent with both the X-ray crystal structure ‘chlorophenyl down’ orientation and the predominant cluster using Autodock.
Assigning and Deconvoluting the Ticlopidine Proton NMR Spectrum in the Presence of 2B4
Proton NMR spectra of ticlopidine were taken in the presence and absence of 2B4. The NMR peak assignments of ticlopidine are described in detail in the Supporting Information (pp. 1-2), but are similar to assignments made previously (73, 74). In the presence of 2B4, the peaks of the ticlopidine NMR spectrum were shifted and broadened (Fig. S1). Several of the peaks overlap significantly making measurement of T1-relaxation of individual peaks difficult. Therefore, the spectra were curve fit using a linear combination of Gaussian and Lorentzian lineshapes (56, 58), which approximates a Voigt function.
The spectrum with the background subtracted (Fig. 2A) and the least squares fit of simulated peaks (Fig. 2B) had a correlation of 0.991. The approximate positions of the peaks were determined by observing the shifts and broadening under different solvent conditions and different protein concentrations (Fig. S3 and data not shown). The lack of peaks in the residual between fit and the data (Fig. 2C) shows that the fit represents the data accurately.
NMR Relaxation of Ticlopidine in the Presence of 2B4
NMR relaxation of ticlopidine protons was used to explore the orientation of ticlopidine in the 2B4 active site in solution (26). Figure 5 shows the results of the NMR relaxation of ticlopidine in the presence of reduced 2B4. A waterfall representation of individual 1D proton NMR spectra that comprise the NMR relaxation experiment (Fig. 5A) shows that at short inversion recovery times the peaks are positive, but decrease as the inversion recovery time is increased. At long inversion recovery times, the absolute amplitude is similar to that at short inversion recovery times, but in the opposite direction. The 1D proton NMR spectra and fit at inversion recovery time of 10 s (Fig. 5B) were fit by least squares method (56, 58-60, 63) using the simulated peaks from Figure 2. In all cases, the correlation values of the fits were 0.97 or greater. Using the simulated peaks and inversion NMR spectra, the inversion recovery time was analyzed using the SVD method. As an example of the robustness of this method, the SVD amplitude of the highly overlapping aromatic chlorophenyl proton labeled ‘e’ (Figs. 1, 2) is shown as a function of inversion recovery time (Fig. 5C). The curve was fit to a single exponential function and had χ2 of 3.24 × 10⁻⁵, suggesting a good fit.
Figure 5.
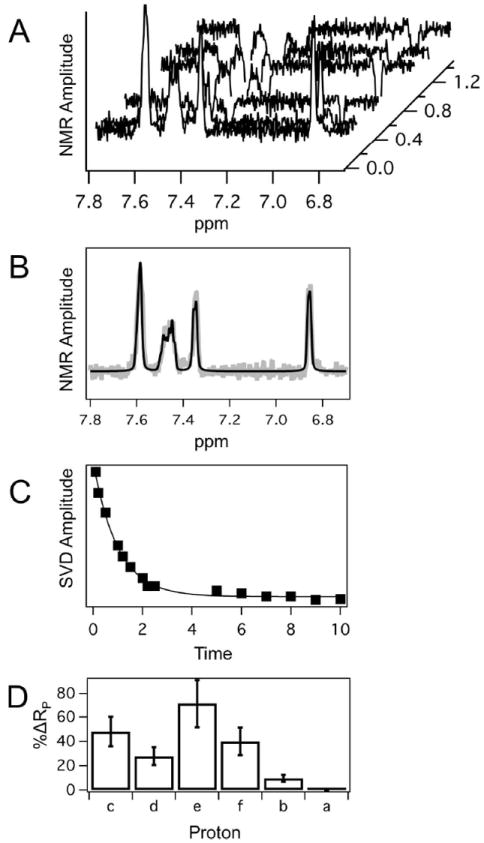
NMR relaxation of 1.15 mM ticlopidine in the presence of 5 μM reduced 2B4. A. Waterfall graph of the 1D proton NMR spectra at various inversion recovery times with the background and baseline subtracted. B. 1D proton NMR spectra (gray lines) at inversion recovery times of 100 ms (top), 1 s (middle) and 10 s (bottom) with fits shown in black. C. SVD analysis of the highly overlapping aromatic chlorophenyl proton peak labeled ‘e’ as a function of inversion recovery time. D. Relative differences in paramagnetic relaxation (RP) of ticlopidine protons. The bar graph shows percent difference of RP with respect to aromatic proton ‘a’ of the thiophene ring, which showed the weakest paramagnetic relaxation effect. Error bars indicate the variation calculations
The relaxation rates of 1.15 mM ticlopidine in the presence of 5 μM 2B4 were deduced from SVD analysis (Table 3). The first two columns show the relaxation rates for oxidized Fe3+ 2B4 and reduced-CO Fe2+ 2B4. The calculated paramagnetic relaxation (RP) is in column 3 and varies about two-fold between protons. Using the Solomon-Bloembergen equation and treatment described in Materials and Methods, the apparent time-averaged distances (rapp) can be calculated. Because of the r6 distance dependence, chemical equivalence and time averaging, the rapp are significantly less dispersed and less sensitive to orientation and position than RP. For comparison, the last column in Table 3 lists the distances deduced from the X-ray crystal structure (rX-ray) to the heme iron. Since ticlopidine exhibits only two orientations in the X-ray crystal structure and is likely to be mobile under conditions of the NMR analysis, the X-ray crystal structure shows significantly higher dispersion of the proton distances than the calculated distances from NMR. The disparity between these measurements is explained in more detail in the Discussion and the Supporting Information (pp. 3-4).
Because of the higher sensitivity of RP with respect to orientation and position of ticlopidine, these rates were analyzed (Figs. 5D, S7) with respect to RP of proton ‘a’ (Fig. 1), which relaxes slower than the other protons in the presence of 2B4. The proton labeled ‘e’, which corresponds to a proton on the chlorophenyl ring, shows the faster relaxation, which is 71% greater than the proton ‘a’ on the opposite end of the molecule. In contrast, the proton adjacent to ‘a’ on the thiophene ring proton (proton ‘b’) had an RP that was only 10% greater. From this analysis, it becomes apparent that the protons on the chlorophenyl ring are relaxed more rapidly than those on the thiophene ring. Thus, the preferred orientation of ticlopidine is with chlorophenyl ring oriented toward the heme.
Discussion
The two structures presented here represent the first 2B complexes with non-imidazole ligands. Clopidogrel and ticlopidine, which lack nitrogen coordination to the heme iron, have more freedom of rotation in the active site, which we expected would influence their binding modes. The multiple conformations of ticlopidine are consistent with this hypothesis and with metabolism studies that report multiple products from oxidation by various mammalian P450s (14, 16, 17, 75). Analysis of previous structures (4-7) largely focused on discussion of highly mobile secondary structural elements that could reposition themselves in response to imidazole inhibitors of various sizes. In contrast, comparisons of the ticlopidine and clopidogrel complexes show a similar protein backbone (Fig. S4), but highlights the ability of the enzyme to accommodate ligands through rearrangement of active site residues (Figs. 4, S5).
In the clopidogrel complex, Phe 206 enters into the active site and sits above the B ring of the heme. To make room for ticlopidine, this residue rotates out of the active site and points toward the I helix. A similar result is observed with Phe 297. In the ticlopidine complex, Phe 297 points into the active site above the A ring of the heme. Since the thiophene ring of clopidogrel occupies this space in the other structure, the side chain of Phe 297 rotates out of the active site and points up toward the F helix. These small differences result in active site cavity volumes of 415.4 Å3 and 373.5 Å3 for the clopidogrel and ticlopidine complexes, respectively (Fig. 4D).
In addition to side chain differences between the two complexes, there are small changes in main chain interactions near the active site. Immediately following Leu 295, the I helix of the clopidogrel complex is pushed toward the E helix to accommodate the binding of the thiophene ring of clopidogrel. In this region, Phe 296 loses its main chain interaction with Thr 300, but standard helical interactions resume immediately afterward until they are broken again for helical hydrogen-bonding partners Gly 299 and Thr 303 and Glu 301 and Thr 305. Instead of maintaining the canonical secondary structure hydrogen-bonding pattern, the distorted main chain oxygens of Phe 296, Gly 299, and Gly 301 are in position to possibly hydrogen bond with the nearby side chains of Thr 300, Thr 303, and Thr 305 respectively to regain the energy lost from breaking the helical pattern. These repositioned main chain interactions help account for the rotation of Phe 297 out of the active site to make room for the thiophene ring and also result in a gradual bowing of the I helix from one end to the other (Fig. 6A). In contrast, in the ticlopidine complex, the I helix is kinked toward helix E beginning at Phe 296, where the main chain carbonyls of Phe 296, Phe 297, Ala 298, and Gly 299 lose their hydrogen-bonding partners of the main chain amides from Thr 300, Glu 301, Thr 302, and Thr 303 respectively (Fig. 6B). In both cases, the I helix breaks the standard hydrogen-bonding pattern of an α-helix where the carbonyl oxygen of residue ‘n’ interacts with the amide nitrogen of residue ‘n+4’. This phenomenon is also observed in the 4-CPI complexes of 2B4 (5) and 2B6 (8) and to a lesser extent in the 1-CPI complex of 2B4 (6). The I helix is also kinked in the 2B4–bifonazole structure, but in a different manner (7). Traditional hydrogen bonding is consistent throughout the I helix of the 1-PBI complex (4). While these subtle variations among the clopidogrel, ticlopidine, 4-CPI, and 1-CPI complexes are less pronounced than the large structural rearrangements seen in the 1-PBI and bifonazole complexes, these distortions of the I helix highlight the variable mechanisms at the disposal of 2B enzymes to accommodate ligands and substrates of varying geometries.
Figure 6.
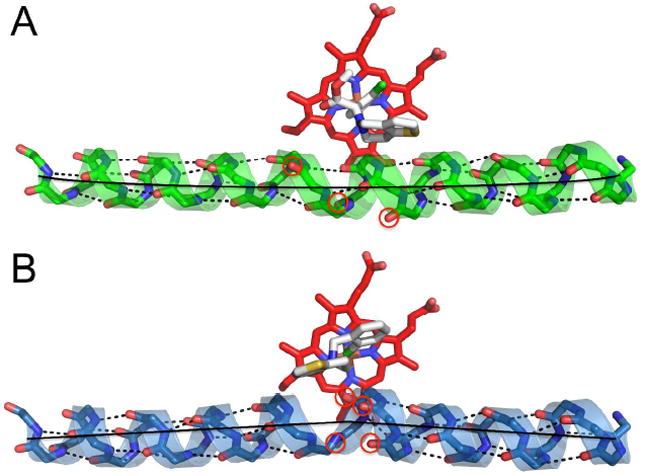
Ribbon and stick diagram showing the different placements of the I helix. A. In the 2B4–clopidogrel complex, the I helix is slightly curved from end to end. Main chain helical contacts are lost at three points. The main chain oxygens of Phe 296, Gly 299, and Glu 301 are circled in red where these contacts are broken. The black line highlights the curvature of the helix. B. In the 2B4–ticlopidine complex, the I helix shows a kink beginning at residue 296 where the traditional ‘n’, ‘n+4’ hydrogen bonding pattern of the helix diverges. The main chain oxygens of Phe 296, Phe 297, Ala 298, and Gly 299 are circled in red. The black lines highlight the kink in the helix.
The similarities between these two 2B4–thiophene drug complexes and the previously solved CPI structures (5, 6), raise questions about the role that the structural plasticity of 2B4 found in X-ray crystal structures with bifonazole (7) and 1-PBI (4) plays in the enzyme’s natural environment. 2B4 appears to have two modes of adapting to the ligands it encounters: global and local plasticity. With large imidazole inhibitors, the iron-nitrogen coordination in the active site results in protein conformations that are driven by the ligand. For example, isothermal titration calorimetry showed that the binding of bifonazole or 1-(2-(benzyloxy)ethyl)imidazole to 2B4 is entropically unfavorable (but overall is favorable due to large negative enthalpies), indicating that the ligands are introducing strain on the active site (7, 29), causing it to open to accommodate the large inhibitor volumes. The wide-open conformation seen in the 2B4–bifonazole structure (7) is consistent with this model. The tight interaction between the heme and ligand, and the variability between the sizes of these molecules causes the protein to reorganize its secondary structural elements to accommodate these ligands, resulting in global plasticity.
In contrast to imidazole-based inhibitors, clopidogrel and ticlopidine do not bind to the heme. The weaker binding is reflected in their higher Ks values (Table 2). For reference, 4-CPI, bifonazole, and 1-PBI exhibit Ks values of 0.04 μM, 0.13 μM, and 0.23 μM respectively (4). Compared with the 2B4 complexes of 4-CPI (5) and 1-CPI (6), the ligands in the thiophene complexes appear to be conforming to the protein. Despite their similar molecular structures, the additional carboxymethyl group of clopidogrel (Fig. 1) causes the thiophene ring to adopt a different orientation than either observed in the ticlopidine complex (Fig. 4). However, it is apparent that the protein undergoes far less rearrangement to bind these smaller compounds (4-CPI, 1-CPI, ticlopidine, and clopidogrel) than observed with the large imidazoles. This brings up the possibility that one specific 2B4 orientation (or a small number) may be suitable for binding multiple ligands of similar size, a phenomenon that has already been observed in 2A6 (76, 77). The movements that are observed in these cases are limited to shifts in side chain orientation (Figs. 4, S5) and deformation of the I helix (Fig. 6). This local plasticity in the active site is likely how 2B enzymes behave with a majority of compounds until they encounter ligands with unusually large volumes, unique stereochemistry, or other features that require the protein to displace secondary structural elements for oxidation to occur. Adjusting ligand orientation over protein conformation makes sense energetically, because it takes much less energy for a molecule to reorient than for the protein secondary or tertiary structure to rearrange. However, having structural flexibility at their disposal aids in allowing 2B enzymes to accommodate their wide array of substrates.
Despite their differences in binding, clopidogrel and one ticlopidine orientation place the aromatic chlorophenyl group closest to the 2B4 heme. The positioning of clopidogrel and the ‘chlorophenyl down’ orientation of ticlopidine are consistent with a recent study that identified two ticlopidine metabolites that are formed via a novel chlorophenyl-epoxidation pathway in rat liver microsomes (16), whereas there are no reports of chlorophenyl ring oxidation metabolites from clopidogrel. Alternatively, the ‘thiophene down’ orientation of ticlopidine supports several studies that show formation of thiolactones or thiophene-S-oxides from ticlopidine and clopidogrel by 2C19 (14, 17) or from clopidogrel by 1A2 and 2B6 (17). However, this does not appear to be the favored conformation in solution in 2B4. Ligand dynamics deduced from analysis of NMR relaxation of ticlopidine reveals a possible structural mechanism whereby 2B4 can accomplish thiophene oxidation reactions, while still maintaining a ‘chlorophenyl down’ orientation most of the time.
The 71% higher paramagnetic relaxation rates observed for protons on the chlorophenyl ring suggest that the molecule is preferentially oriented with the chlorophenyl ring closer to the heme. The molecule is in ‘fast exchange’ and likely adopts multiple orientations within the 2B4 active site. The averaging of these orientations makes the calculated distances (rapp) seem parallel with a maximum difference in distances of 0.65 Å. The time averaging effect could also explain why the distances of ligands bound to 1A2 (27) and 73A1 (52) were less dispersed than expected. However, the X-ray crystal structure and the molecular docking simulations show that ticlopidine orientations which are perpendicular to the heme. Using the equations in the Materials and Methods, the amount of movement required for ticlopidine to have only a 0.65-Å difference in rapp was calculated. In the calculation, ticlopidine was assumed to oscillate between two perpendicular orientations, which places the ‘a’ proton at either of two distances (i.e. 10.49 Å and 3.34 Å, respectively, Table 3). Interestingly, to have a difference in rapp of 0.65 Å, the molecule only has to be oriented with the thiophene ring toward the heme ~27% of the time. In this model, the chlorophenyl ring is still primarily oriented toward this heme, but allows for the thiophene ring to transiently interact with the heme where it can form the reported thiolactone and thiophene-S-oxidize metabolites as well.
To date, there are no publications on the metabolism of clopidogrel or ticlopidine by 2B4. However, our ongoing studies have shown that both 2B4 and 2B6 can form multiple metabolites from ticlopidine, with time courses that deviate rapidly from linearity and are consistent with mechanism-based inactivation. Compared with 2B6, 2B4 catalyzes more N-oxidation and less oxidation of the thiophene ring1. These unpublished results are consistent with our analysis of the data gathered from X-ray crystallography, NMR, and computational experiments regarding binding of ticlopidine to 2B4 as well as previous studies of thiophene drug metabolism in other P450s (14, 16, 17, 75). While our previous structural studies of 2B4 have focused on ligand-driven conformational flexibility (4-7, 29), the results presented here emphasize how ligand dynamics affect the P450-ligand complex.
Supplementary Material
Acknowledgments
We thank Stephanie C. Huelga for assistance using Autodock. We also thank the staff at the Stanford Synchrotron Radiation Lightsource for assistance with data collection. The Stanford Synchrotron Radiation Lightsource is operated by Stanford University on behalf of the United States Department of Energy, Office of Basic Energy Sciences. The Stanford Synchrotron Radiation Lightsource is supported by the National Institute of Health, the National Center for Research Resources, the Biomedical Technology Program and the U.S. Department of Energy of Biological and Environmental Research.
The abbreviations used are
- 4-CPI
4-(4-chlorophenyl)imidazole
- 1-CPI
1-(4-chlorophenyl)imidazole
- 1-PBI
1-(4-phenyl)benzylimidazole
- Cymal-5
5-cyclo-hexylpentyl-β-D-maltoside
- 232-chol
3α,7α,12α-tris[(β-D-maltopyranosyl)ethyloxy]cholane
- 234-chol
3α-hydroxy-7α,12α-bis[[[2-(trimethylamino)ethyl]phosphoryl]ethyloxy]cholane
- BME
2-mercaptoethanol
- PMSF
phenylmethylsulfonyl fluoride
- Ni-NTA
nickel-nitrilotriacetic acid
- EDTA
ethylenediaminetetraacetic acid
- DTT
dithiothreitol
- 7-EFC
7-ethoxy-4-trifluoromethylcoumarin
- SSRL
Stanford Synchrotron Radiation Lightsource
- PCA
principal component analysis
- SVD
singular value decomposition
- RMSD
root mean square deviation
Footnotes
This research was supported by NIH grants ES003619 to J.R.H and GM073197 to Q.Z.
Atomic coordinates have been deposited at the Protein Data Bank (accession codes 3KW4, 3ME6).
Dalvie, et al., manuscript in preparation.
Supporting Information Available Results regarding NMR assignments of ticlopidine protons. Results establishing fast exchange of ticlopidine protons. Results of a simulation of rapp, ravg, and RP. NMR spectra of ticlopidine under various conditions (Fig. S1). Representative type I difference spectra for ticlopidine and clopidogrel binding to 2B4 and accompanying curve fits for Ks determination (Fig. S2). Curves used for the determination of Ki values for ticlopidine and clopidogrel (Fig. S3). Structural overlay of 2B4 complexes of ticlopidine, clopidogrel, and 4-CPI (Fig. S4). Typical electron density maps for side chains near the active site of ticlopidine and clopidogrel complexes of 2B4 (Fig. S5). Ticlopidine docking orientations in the 2B4 active site (Fig. S6). Relative NMR T1 relaxation rates assigned to the chemical structure of ticlopidine (Fig. S7). The effect of time averaging on rapp, ravg, and RP (Fig. S8). This material is available free of charge via the Internet at http://pubs.acs.org.
References
- 1.Johnson EF, Stout CD. Structural diversity of human xenobiotic-metabolizing cytochrome P450 monooxygenases. Biochem Biophys Res Commun. 2005;338:331–336. doi: 10.1016/j.bbrc.2005.08.190. [DOI] [PubMed] [Google Scholar]
- 2.Otyepka M, Skopalik J, Anzenbacherova E, Anzenbacher P. What common structural features and variations of mammalian P450s are known to date? Biochim Biophys Acta. 2007;1770:376–389. doi: 10.1016/j.bbagen.2006.09.013. [DOI] [PubMed] [Google Scholar]
- 3.Zhao Y, Halpert JR. Structure-function analysis of cytochromes P450 2B. Biochim Biophys Acta. 2007;1770:402–412. doi: 10.1016/j.bbagen.2006.07.006. [DOI] [PubMed] [Google Scholar]
- 4.Gay SC, Sun L, Maekawa K, Halpert JR, Stout CD. Crystal structures of cytochrome P450 2B4 in complex with the inhibitor 1-biphenyl-4-methyl-1H-imidazole: Ligand induced structural response through α-helical repositioning. Biochemistry. 2009;48:4762–4771. doi: 10.1021/bi9003765. [DOI] [PMC free article] [PubMed] [Google Scholar]
- 5.Scott EE, White MA, He YA, Johnson EF, Stout CD, Halpert JR. Structure of mammalian cytochrome P450 2B4 complexed with 4-(4-chlorophenyl)imidazole at 1.9 A resolution: Insight into the range of P450 conformations and coordination of redox partner binding. J Biol Chem. 2004;279:27294–27301. doi: 10.1074/jbc.M403349200. [DOI] [PubMed] [Google Scholar]
- 6.Zhao Y, Sun L, Muralidhara BK, Kumar S, White MA, Stout CD, Halpert JR. Structural and thermodynamic consequences of 1-(4-chlorophenyl)imidazole binding to cytochrome P450 2B4. Biochemistry. 2007;46:11559–11567. doi: 10.1021/bi7011614. [DOI] [PMC free article] [PubMed] [Google Scholar]
- 7.Zhao Y, White MA, Muralidhara BK, Sun L, Halpert JR, Stout CD. Structure of microsomal cytochrome P450 2B4 complexed with the antifungal drug bifonazole: Insight into P450 conformational plasticity and membrane interaction. J Biol Chem. 2006;281:5973–5981. doi: 10.1074/jbc.M511464200. [DOI] [PubMed] [Google Scholar]
- 8.Gay SC, Shah MB, Talakad JC, Maekawa K, Roberts AG, Wilderman PR, Sun L, Yang JY, Huelga SC, Hong W-X, Zhang Q, Stout CD, Halpert JR. Crystal structure of a cytochrome P450 2B6 genetic variant in complex with the inhibitor 4-(4-chlorophenyl)imidazole at 2.0 A resolution. Mol Pharmacol. 2010;77:529–538. doi: 10.1124/mol.109.062570. [DOI] [PMC free article] [PubMed] [Google Scholar]
- 9.Richter T, Murdter TE, Heinkele G, Pleiss J, Tatzel S, Schwab M, Eichelbaum M, Zanger UM. Potent mechanism-based inhibition of human CYP2B6 by clopidogrel and ticlopidine. J Pharmacol Exp Ther. 2004;308:189–197. doi: 10.1124/jpet.103.056127. [DOI] [PubMed] [Google Scholar]
- 10.Sharis PJ, Cannon CP, Loscalzo J. The antiplatelet effects of ticlopidine and clopidogrel. Ann Intern Med. 1998;129:394–405. doi: 10.7326/0003-4819-129-5-199809010-00009. [DOI] [PubMed] [Google Scholar]
- 11.Farid NA, Kurihara A, Wrighton SA. Metabolism and disposition of the thienopyridine antiplatelet drugs ticlopidine, clopidogrel, and prasugrel in humans. J Clin Pharmacol. 2010;50:126–142. doi: 10.1177/0091270009343005. [DOI] [PubMed] [Google Scholar]
- 12.Picard-Fraire C. Pharmacokinetic and metabolic characteristics of ticlopidine in relation to its inhibitory properties on platelet function. Agents Action. 1984;15(Suppl):68–75. [PubMed] [Google Scholar]
- 13.Tuong A, Boutssou A, Paret J, Cuong TG. Metabolism of ticlopidine in rats: Identification and quantitative determination of some its metabolites in plasma, urine and bile. Eur J Drug Metab Pharmacokinet. 1981;6:91–98. doi: 10.1007/BF03189474. [DOI] [PubMed] [Google Scholar]
- 14.Ha-Duong NT, Dijols S, Macherey AC, Goldstein JA, Dansette PM, Mansuy D. Ticlopidine as a selective mechanism-based inhibitor of human cytochrome P450 2C19. Biochemistry. 2001;40:12112–12122. doi: 10.1021/bi010254c. [DOI] [PubMed] [Google Scholar]
- 15.Dalvie DK, O’Connell TN. Characterization of novel dihydrothienopyridinium and thienopyridinium metabolites of ticlopidine in vitro: Role of peroxidases, cytochromes p450, and monoamine oxidases. Drug Metab Disp. 2004;32:49–57. doi: 10.1124/dmd.32.1.49. [DOI] [PubMed] [Google Scholar]
- 16.Ruan Q, Zhu M. Investigation of bioactivation of ticlopidine using linear ion trap/orbitrap mass spectrometry and an improved mass defect filtering technique. Chem Res Toxicol. 2010;23:909–917. doi: 10.1021/tx1000046. [DOI] [PubMed] [Google Scholar]
- 17.Kazui M, Nishiya Y, Ishizuka T, Hagihara K, Farid NA, Okazaki O, Ikeda T, Kurihara A. Identification of the human cytochrome P450 enzymes involved in the two oxidiative steps in the bioactivation of clopidogrel to its pharmacologically active metabolite. Drug Metab Disp. 2010;38:92–99. doi: 10.1124/dmd.109.029132. [DOI] [PubMed] [Google Scholar]
- 18.Hagihara K, Nishiya Y, Kurihara A, Kazui M, Farid NA, Ikeda T. Comparison of human cytochrome P450 inhibition by the thienopyridines prasugrel, clopidogrel, and ticlopidine. Drug Metab Pharmacokinet. 2008;23:412–420. doi: 10.2133/dmpk.23.412. [DOI] [PubMed] [Google Scholar]
- 19.Kalgutkar AS, Obach RS, Maurer TS. Mechanism-based inactivation of cytochrome P450 enzymes: Chemical mechanisms, structure-activity relationships and relationship to clinical drug-drug interactions and idiosyncratic adverse drug reactions. Curr Drug Metab. 2007;8:407–447. doi: 10.2174/138920007780866807. [DOI] [PubMed] [Google Scholar]
- 20.Turpeinen M, Nieminen R, Juntunen T, Taavitsainen P, Raunio H, Pelkonen O. Selective inhibition of CYP2B6-catalyzed bupropion hydroxylation in human liver microsomes in vitro. Drug Metab Dispos. 2004;32:626–631. doi: 10.1124/dmd.32.6.626. [DOI] [PubMed] [Google Scholar]
- 21.Donahue SR, Flockhart DA, Abernethy DR, Ko JW. Ticlopidine inhibition of phenyion metabolism mediated by potent inhibition of CYP2C19. Clin Pharmacol Ther. 1997;62:572–577. doi: 10.1016/S0009-9236(97)90054-0. [DOI] [PubMed] [Google Scholar]
- 22.Tateishi T, Kumai T, Watanabe M, Nakura H, Tanaka M, Kobayashi S. Ticlopidine decreases the in vivo actibty of CYP2C19 as measured by omeprazole metabolism. Br J Clin Pharmacol. 1999;47:454–457. doi: 10.1046/j.1365-2125.1999.00914.x. [DOI] [PMC free article] [PubMed] [Google Scholar]
- 23.Scott EE, He YA, Wester MR, White MA, Chin CC, Halpert JR, Johnson EF, Stout CD. An open conformation of mammalian cytochrome P450 2B4 at 1.6-A resolution. Proc Natl Acad Sci USA. 2003;100:13196–13201. doi: 10.1073/pnas.2133986100. [DOI] [PMC free article] [PubMed] [Google Scholar]
- 24.Domanski TL, Halpert JR. Analysis of mammalian cytochrome P450 structure and function by site-directed mutagenesis. Curr Drug Metab. 2001;2:117–137. doi: 10.2174/1389200013338612. [DOI] [PubMed] [Google Scholar]
- 25.Cameron MD, Wen B, Allen KE, Roberts AG, Schuman JT, Campbell AP, Kunze KL, Nelson SD. Cooperative binding of midazolam with testosterone and alpha-naphthoflavone within the CYP3A4 active site: A NMR T1 paramagnetic relaxation study. Biochemistry. 2005;44:14143–14151. doi: 10.1021/bi051689t. [DOI] [PubMed] [Google Scholar]
- 26.Cameron MD, Wen B, Roberts AG, Atkins WM, Campbell AP, Nelson SD. Cooperative binding of acetaminophen and caffeine within the P450 3A4 active site. Chem Res Toxicol. 2007;20:1434–1441. doi: 10.1021/tx7000702. [DOI] [PubMed] [Google Scholar]
- 27.Regal KA, Nelson SD. Orientation of caffeine within the active site of human cytochrome P450 1A2 based on NMR longitudinal (T1) relaxation measurements. Arch Biochem Biophys. 2000;384:47–58. doi: 10.1006/abbi.2000.2073. [DOI] [PubMed] [Google Scholar]
- 28.Zhang Q, Ma X, Ward A, Hong W, Jaakola V, Stevens RC, Finn MG, Chang G. Designing facial amphiphiles for the stabilizaton of integral membrane proteins. Angew Chem Int Ed. 2007;46:7023–7025. doi: 10.1002/anie.200701556. [DOI] [PubMed] [Google Scholar]
- 29.Muralidhara BK, Negi S, Chin CC, Braun W, Halpert JR. Conformational flexibility of mammalian cytochrome P450 2B4 in binding imidazole inhibitors with different ring chemistry and side chains. Solution thermodynamics and molecular modeling. J Biol Chem. 2006;281:8051–8061. doi: 10.1074/jbc.M509696200. [DOI] [PubMed] [Google Scholar]
- 30.Davydov DR, Deprez E, Hoa GH, Knyushko TV, Kuznetsova GP, Koen YM, Archakov AI. High-pressure-induced transitions in microsomal cytochrome P450 2B4 in solution: Evidence for conformational inhomogeneity in the oligomers. Arch Biochem Biophys. 1995;320:330–344. doi: 10.1016/0003-9861(95)90017-9. [DOI] [PubMed] [Google Scholar]
- 31.Tsalkova TN, Davydova NY, Halpert JR, Davydov DR. Mechanism of interactions of alpha-naphthoflavone with cytochrome P450 3A4 explored with an engineered enzyme bearing a fluorescent probe. Biochemistry. 2007;46:106–119. doi: 10.1021/bi061944p. [DOI] [PMC free article] [PubMed] [Google Scholar]
- 32.Leslie AGW. Integration of macromolecular diffraction data. Acta Crystallogr Sect D Biol Crystallogr. 1999;D55:1696–1702. doi: 10.1107/s090744499900846x. [DOI] [PubMed] [Google Scholar]
- 33.Kabsch W. Evaluation of single-crystal X-ray diffraction data from a position-sensitive detector. J Appl Crystallogr. 1988;21:916–924. [Google Scholar]
- 34.McCoy AJ, Grosse-Kunstleve RW, Adams PD, Winn MD, Storoni LC, Read RJ. Phaser crystallographic software. J Appl Crystallogr. 2007;40:658–674. doi: 10.1107/S0021889807021206. [DOI] [PMC free article] [PubMed] [Google Scholar]
- 35.Murshudov GN, Vagin AA, Dodson EJ. Refinement of macromolecular structures by the maximum-likelihood method. Acta Crystallogr Sect D Biol Crystallogr. 1997;D53:240–255. doi: 10.1107/S0907444996012255. [DOI] [PubMed] [Google Scholar]
- 36.Emsley P, Lohkamp B, Scott W, Cowtan K. Features and development of Coot. Acta Crystallogr Sect D Biol Crystallogr. 2010;D66:486–501. doi: 10.1107/S0907444910007493. [DOI] [PMC free article] [PubMed] [Google Scholar]
- 37.Padilla J, Yeates TO. A statistic for local intensity differences: Robustness to anisotropy and pseudo-centerting and utility for detecting twinning. Acta Crystallogr Sect D Biol Crystallogr. 2003;D59:1124–1130. doi: 10.1107/s0907444903007947. [DOI] [PubMed] [Google Scholar]
- 38.Yeates TO. Detecting and overcoming crystal twinning. Methods Enzymol. 1997;276:344–358. [PubMed] [Google Scholar]
- 39.Kleywegt GJ, Jones TA. Detection, delineation, measurement and display of cavities in macromolecular structures. Acta Crystallogr Sect D Biol Crystallogr. 1994;D50:178–185. doi: 10.1107/S0907444993011333. [DOI] [PubMed] [Google Scholar]
- 40.Morris GM, Goodsell DS, Halliday RS, Huey R, Hart WE, Belew RK, Olson AJ. Automated docking using a lamarckian genetic algorithm and empirical binding free energy function. J Comput Chem. 1998;19:1639–1662. [Google Scholar]
- 41.Helms V, Wade RC. Thermodynamics of water mediating protein-ligand interactions in cytochrome P450cam: A molecular dynamics study. Biophys J. 1995;69:810–824. doi: 10.1016/S0006-3495(95)79955-6. [DOI] [PMC free article] [PubMed] [Google Scholar]
- 42.Brunger AT, Adams PD, Rice LM. New applications of simulated annealing in X-ray crystallography and solution NMR. Structure. 1997;5:325–336. doi: 10.1016/s0969-2126(97)00190-1. [DOI] [PubMed] [Google Scholar]
- 43.Constantine KL. Evaluation of site-directed spin labeling for characterizing protein-ligand complexes using simulated restraints. Biophys J. 2001;81:1275–1284. doi: 10.1016/S0006-3495(01)75785-2. [DOI] [PMC free article] [PubMed] [Google Scholar]
- 44.Yue SY. Distance-constrained molecular docking by simulated annealing. Protein Eng. 1990;4:177–184. doi: 10.1093/protein/4.2.177. [DOI] [PubMed] [Google Scholar]
- 45.Eswar N, Eramian D, Webb B, Shen MY, Sali A. Protein structure modeling with MODELLER. Methods Mol Biol. 2008;426:145–159. doi: 10.1007/978-1-60327-058-8_8. [DOI] [PubMed] [Google Scholar]
- 46.DeLano WL. MacPyMOL. DeLano Scientific; Palo Alto, CA, USA: 2002. The PyMOL molecular graphics system. [Google Scholar]
- 47.Van Der Spoel D, Lindahl E, Hess B, Groenhof G, Mark AE, Berendsen HJ. GROMACS: Fast, flexible, and free. J Comput Chem. 2005;26:1701–1718. doi: 10.1002/jcc.20291. [DOI] [PubMed] [Google Scholar]
- 48.Oostenbrink C, Soares TA, van der Vegt NF, van Gunsteren WF. Validation of the 53A6 GROMOS force field. Eur Biophys J. 2005;34:273–284. doi: 10.1007/s00249-004-0448-6. [DOI] [PubMed] [Google Scholar]
- 49.Darden T, York D, Pederson L. Particle mesh Ewald: An N-log(N) method for Ewald sums in large systems. J Chem Phys. 1993;98:10089–10092. [Google Scholar]
- 50.Hummel MA, Gannett PM, Aguilar JS, Tracy TS. Effector-mediated alteration of substrate orientation in cytochrome P450 2C9. Biochemistry. 2004;43:7207–7214. doi: 10.1021/bi036158o. [DOI] [PubMed] [Google Scholar]
- 51.Modi S, Gilham DE, Sutcliffe MJ, Lian LY, Primose WU, Wolf CR, Roberts GCK. 1-methyl-4-phenyl-1, 2, 3, 6-tetrahydropyridine as a substrate of cytochrome P450 2D6: Allosteric effects of NADPH-cytochrome P450 reductase. Biochemistry. 1997;350:4461–4470. doi: 10.1021/bi962633p. [DOI] [PubMed] [Google Scholar]
- 52.Schoch GA, Attias R, Belghazi M, Dansette PM, Werck-Reichhart D. Engineering of a water-soluble plant cytochrome P450, CYP73A1, and NMR-based orientation of natural and alternate substrates in the active site. Plant Physiol. 2003;133:1198–1208. doi: 10.1104/pp.103.020305. [DOI] [PMC free article] [PubMed] [Google Scholar]
- 53.Piotto M, Saudek V, Sklenar V. Gradient-tailored excitation for single-quantum NMR spectroscopy of aqueous solutions. J Biomol NMR. 1992;2:661–665. doi: 10.1007/BF02192855. [DOI] [PubMed] [Google Scholar]
- 54.Prost E, Sizun P, Piotto M, Nuzillard JM. A simple scheme for the design of solvent-suppression pulses. J Magn Reson. 2002;159:76–81. doi: 10.1016/s1090-7807(02)00003-4. [DOI] [PubMed] [Google Scholar]
- 55.Modi S, Paine MJ, Sutcliffe MJ, Lian L-Y, Primrose WU, Wolf CR, Roberts GCK. A model for human cytochrome P450 2D6 based on homology modeling and NMR studies of substrate binding. Biochemistry. 1996;35:4540–4550. doi: 10.1021/bi952742o. [DOI] [PubMed] [Google Scholar]
- 56.Bruce SD, Higinbotham J, Marshall I, Beswick PH. An analytical derivation of a popular approximation of the Voigt function for quantification of NMR spectra. J Magn Reson. 2000;142:57–63. doi: 10.1006/jmre.1999.1911. [DOI] [PubMed] [Google Scholar]
- 57.Marshall I, Bruce SD, Higinbotham J, MacLullich A, Wardlaw JM, Ferguson KJ, Seckl J. Choice of spectroscopic lineshape model affects metabolite peak areas and area ratios. Magn Reson Med. 2000;44:646–649. doi: 10.1002/1522-2594(200010)44:4<646::aid-mrm20>3.0.co;2-0. [DOI] [PubMed] [Google Scholar]
- 58.Marshall I, Higinbotham J, Bruce S, Freise A. Use of Voigt lineshape for quantification of in vivo 1H spectra. Magn Reson Med. 1997;37:651–657. doi: 10.1002/mrm.1910370504. [DOI] [PubMed] [Google Scholar]
- 59.Massiot D, Fayon F, Capron M, King I, Le Calvé S, Alonso B, Durand J, Bujoli B, Gan Z, Hoatson G. Modelling one- and two-dimensional solid-state NMR spectra. Magn Reson Chem. 2002;40:70–76. [Google Scholar]
- 60.Ammann LP, Merritt M, Sagalowsky A, Nurenberg P. Peak-finding partial least squares for the analysis of 1H NMR spectra. Chemom Intell Lab Syst. 2006;20:231–238. [Google Scholar]
- 61.Kuesel AC, Stoyanova R, Aiken NR, Li CW, Szwergold BS, Shaller C, Brown TR. Quantitation of resonances in biological 31P NMR spectra via principal component analysis: Potential and limitations. NMR Biomed. 1996;9:93–104. doi: 10.1002/(SICI)1099-1492(199605)9:3<93::AID-NBM410>3.0.CO;2-D. [DOI] [PubMed] [Google Scholar]
- 62.Stoyanova R, Brown TR. NMR spectral quantitation by principal component analysis. NMR Biomed. 2001;14:271–277. doi: 10.1002/nbm.700. [DOI] [PubMed] [Google Scholar]
- 63.Kielkopf JF. New approximation to the Voigt function with applications to spectral-line profile analysis. J Opt Soc Am. 1973;63:987–995. [Google Scholar]
- 64.Chen H, Van Huffel S, Van Ormondt D, De Beer R. Parameter estimation with prior knowledge of known signal poles for the quantification of NMR spectroscopy data in the time domain. J Magn Reson, Ser A. 1996;119:225–234. [Google Scholar]
- 65.Viereck N, Nørgaard L, Bro R, Engelsen SB. Chemometric analysis of NMR data. In: Webb GA, editor. Modern magnetic resonance. Springer Dordrecht; Netherlands: 2006. [Google Scholar]
- 66.Villafranca JJ. Paramagnetic probes of macromolecules. Methods Enzymol. 1989;177:403–413. doi: 10.1016/0076-6879(89)77023-3. [DOI] [PubMed] [Google Scholar]
- 67.Dwek RA. Nuclear magnetic resonance (N.M.R.) in biochemistry: Applications to enzyme systems. Oxford University Press; New York, NY, U.S.A: 1973. [Google Scholar]
- 68.Davydov DR, Fernando H, Halpert JR. Variable path length and counter-flow continuous variation methods for the study of the formation of high-affinity complexes by absorbance spectroscopy. An application to the studies of substrate binding in cytochrome P450. Biophys Chem. 2006;123:95–101. doi: 10.1016/j.bpc.2006.04.007. [DOI] [PubMed] [Google Scholar]
- 69.Modi S, Primrose WU, Boyle JM, Gibson CF, Lian LY, Roberts GC. NMR studies of substrate binding to cytochrome P450 BM3: Comparisons to cytochrome P450 cam. Biochemistry. 1995;34:8982–8988. doi: 10.1021/bi00028a006. [DOI] [PubMed] [Google Scholar]
- 70.Clore GM, Iwahara J. Theory, practice, and applications of paramagnetic relaxation enhancement for the characterization of transient low-population states of biological macromolecules and their complexes. Chem Rev. 2009;109:4108–4139. doi: 10.1021/cr900033p. [DOI] [PMC free article] [PubMed] [Google Scholar]
- 71.Iwahara J, Schwieters CD, Clore GM. Ensemble approach for NMR structure refinement against 1H paramagnetic relaxation enhancement data arising from a flexible paramagnetic group attached to a macromolecule. J Am Chem Soc. 2004;126:5879–5896. doi: 10.1021/ja031580d. [DOI] [PubMed] [Google Scholar]
- 72.Nishiya Y, Hagihara K, Ito T, Tajima M, Miura S, Kurihara A, Farid NA, Ikeda T. Mechanism-based inhibition of human cytochrome P450 2B6 by ticlopidine, clopidogrel, and the thiolactone metabolite of prasugrel. Drug Metab Disp. 2009;37:589–593. doi: 10.1124/dmd.108.022988. [DOI] [PubMed] [Google Scholar]
- 73.Bauer M, Bertario A, Boccardi G, Fontaine X, Rao R, Verrier D. Reproducibility of 1H-NMR integrals: A collaborative study. J Pharm Biomed Anal. 1998;17:419–425. doi: 10.1016/s0731-7085(97)00208-2. [DOI] [PubMed] [Google Scholar]
- 74.Shimizu S, Atsumi R, Nakazawa T, Fujimaki Y, Sudo K, Okazaki O. Metabolism of ticlopidine in rats: Identification of the main biliary metabolite as a glutathione conjugate of ticlopidine S-oxide. Drug Metab Disp. 2009;37:1904–1915. doi: 10.1124/dmd.109.027524. [DOI] [PubMed] [Google Scholar]
- 75.Yoneda K, Iwamura R, Kishi H, Mizukami Y, Kobayashi S. Identification of the active metabolote of ticlopidine from rat in vitro metabolites. Br J Clin Pharmacol. 2004;142:551–557. doi: 10.1038/sj.bjp.0705808. [DOI] [PMC free article] [PubMed] [Google Scholar]
- 76.Yano JK, Denton TT, Cerny MA, Zhang X, Johnson EF, Cashman JR. Synthetic inhibitors of cytochrome P-450 2A6: Inhibitory activity, difference spectra, mechanism of inhibition, and protein cocrystallization. J Med Chem. 2006;49:6987–7001. doi: 10.1021/jm060519r. [DOI] [PubMed] [Google Scholar]
- 77.Yano JK, Hsu MH, Griffin KJ, Stout CD, Johnson EF. Structures of human microsomal cytochrome P450 2A6 complexed with coumarin and methoxsalen. Nat Struct Mol Biol. 2005;12:822–823. doi: 10.1038/nsmb971. [DOI] [PubMed] [Google Scholar]
- 78.Caliandro R, Carrozzini B, Cascarano GL, De Caro L, Giacovazzo C, Siliqi D. The (Fo-Fc) fourier synthesis: A probabilistic study. Acta Crystallogr Sect A Found Crystallogr. 2008;A64:519–528. doi: 10.1107/S0108767308018503. [DOI] [PubMed] [Google Scholar]
Associated Data
This section collects any data citations, data availability statements, or supplementary materials included in this article.