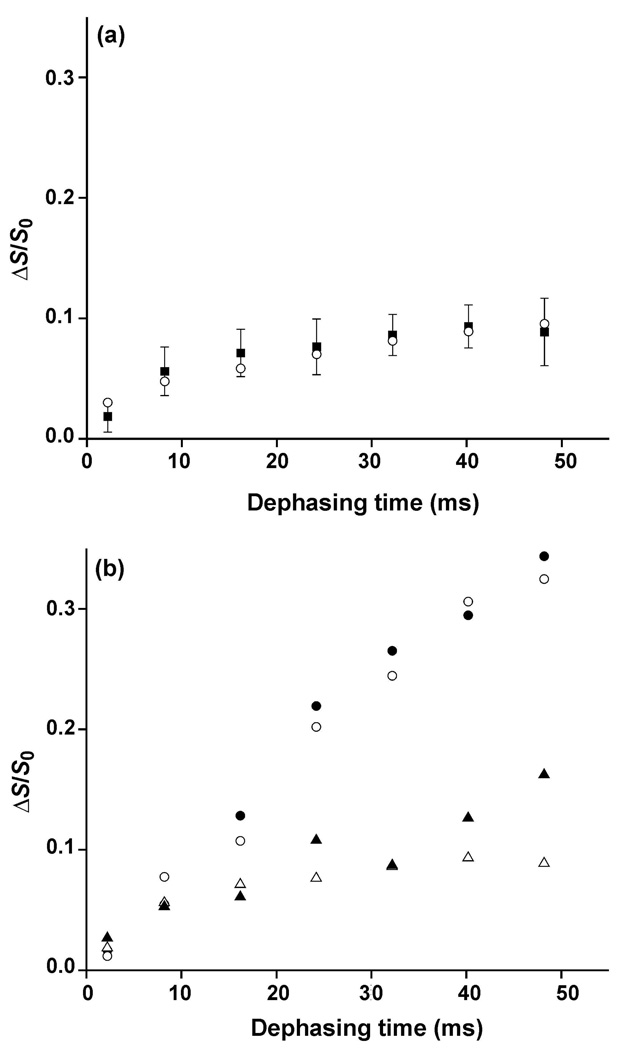
Figure 3.
(a) Plot of REDOR (ΔS/S0)exp (filled squares with error bars) and (ΔS/S0)sim(open circles) vs dephasing time for the lyophilized HFP-NC sample. The (ΔS/S0)sim were calculated using a mixture of n.a.d. models with fractional populations: α helical, 0.5; min β sheet, 0.25; max β sheet, 0.25. (b) Plots of (ΔS/S0)exp vs dephasing time for: HFP-NC, open triangles; HFP-P, filled triangles; HFP-A, open circles; HFP-AP, filled circles. The typical σexp is ±0.02. Variation of ±0.02 in (ΔS/S0)exp was also observed between two different preparations of the same sample type, e.g. HFP-A.

