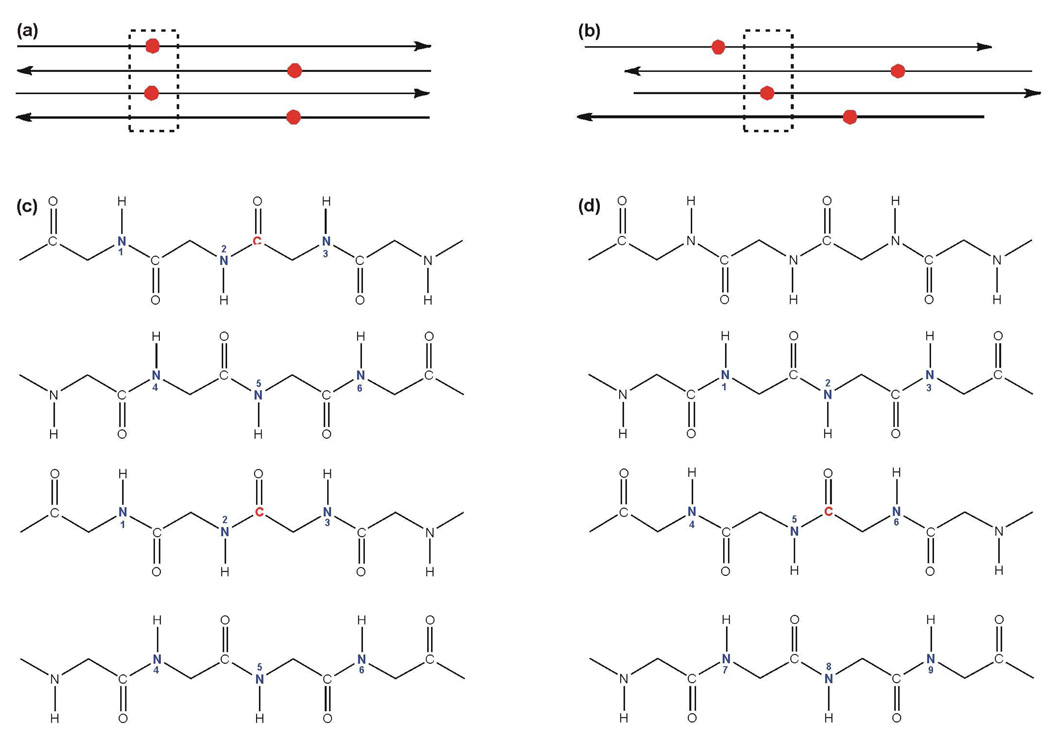
Figure 4.
(a, b) Schematic diagrams of the HFP-F8 region of the HFP-NC sample in antiparallel β sheet structure with labeled 13COs represented as red circles. Panel a shows a model that is fully constrained to a single registry while panel b shows multiple registries. (c, d) β sheet backbone representations of the respective boxed regions of panels a and b with labeled 13COs in red and possible n.a. 15N sites in blue, i.e. sites for which a n.a. 15N is within 7 Å of a labeled 13CO. A particular spin geometry will have only one 15N. The min n.a.d. model is shown in panel c and each spin geometry will have either one labeled 13CO and one n.a. 15N (#1, 2 or 3) or two labeled 13COs and one n.a. 15N (#4, 5, or 6). The max n.a.d model is shown in panel d and each spin geometry will have one labeled 13CO and one n.a. 15N.

