

Abstract
Optical coherence tomography (OCT) is a non-invasive imaging technique routinely used in ophthalmology to visualize and quantify the layers of the retina. It also provides information on optic nerve head topography, peripapillary retinal nerve fiber layer thickness, and macular volume which correlate with axonal loss. These measurements are of particular interest in optic neuropathies and in multiple sclerosis, and OCT parameters are now used as endpoints in neurologic clinical trials.
Keywords: Optical Coherence Tomography, névrite optique, sclérose en plaques
Originally developed for retinal diseases and glaucoma, optical coherence tomography (OCT) allows direct visualization and measurement of the optic nerve head topography, and of retinal nerve fiber layer (RNFL) thickness with micron-scale resolution (Sakata et al., 2009).
Quantification of the RNFL thickness by OCT provides an indirect measure of axonal and neuronal loss in the anterior visual pathways. The RNFL thickness is of particular interest in optic neuropathies and in numerous neurologic disorders such as multiple sclerosis (MS) (Barkhof et al., 2009; Frohman et al., 2008a; Frohman et al., 2008b; Sergott et al., 2007). Because OCT is noninvasive, easy to obtain, and highly reproducible, it can be used as a marker of axonal loss and as an endpoint in clinical trials. It is particularly useful in MS, in which the anterior visual pathways are commonly affected.
1. What is OCT?
OCT can be compared to ultrasound imaging of the retina using light instead of sound (Lamirel et al., 2009). High-resolution cross-sectional images of the retina are obtained with OCT, which also allows reproducible measurements of the thickness of various retinal layers (Figures 1, 2, and 3).
Figure 1. Cross section images of the macula obtained by OCT.
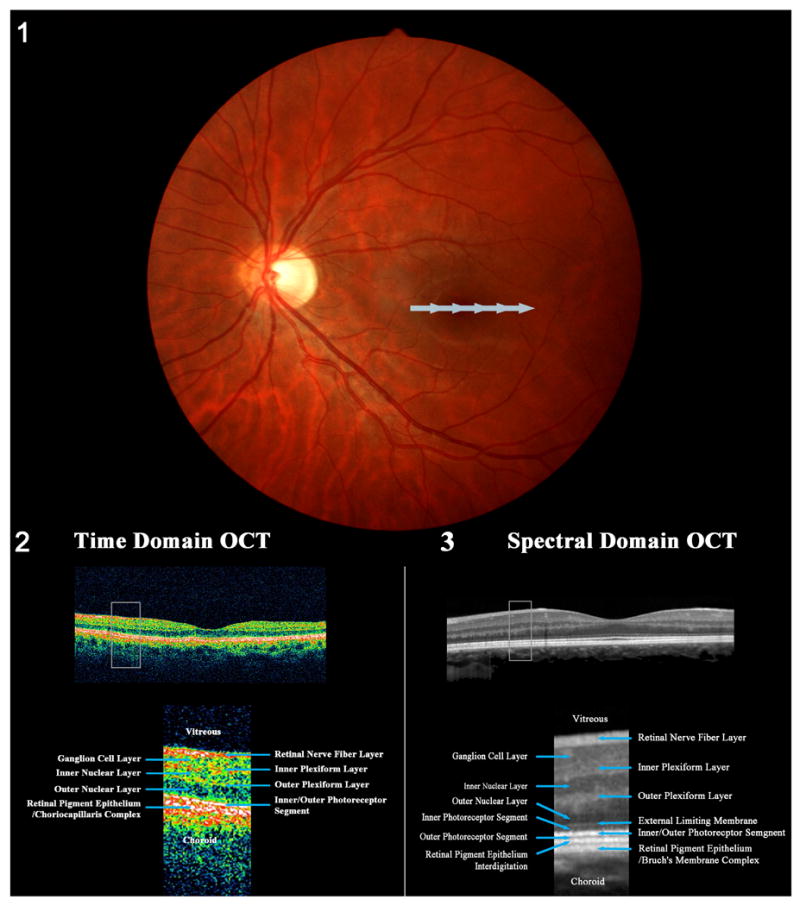
(1) Fundus photograph of a left eye showing the position of the horizontal scan at the level of the macula, across the fovea. The scan begins on the nasal side of the macula and ends on the temporal side of the macula (gray arrow). (2) Cross sectional image of the macula obtained with a third generation OCT (time domain OCT). (3) Cross sectional image of the macula obtained with a spectral domain OCT (Courtesy of Retina Heidelberg Engineering, Inc). (2) and (3) show the physiologic foveal depression in the center of the macula where the retinal layers are thinner. The box represents the magnified views of the retinal layers for each generation of OCT displayed under each cross sectional image. The retinal layers are easily identified. Although spectral domain OCT provides black and white images (3), the resolution is better than with third generation OCT (2) and nearly replicates a histologic cross section of the retina.
Figure 2. Examples of images of cystoid macular edema obtained with a spectral domain OCT.
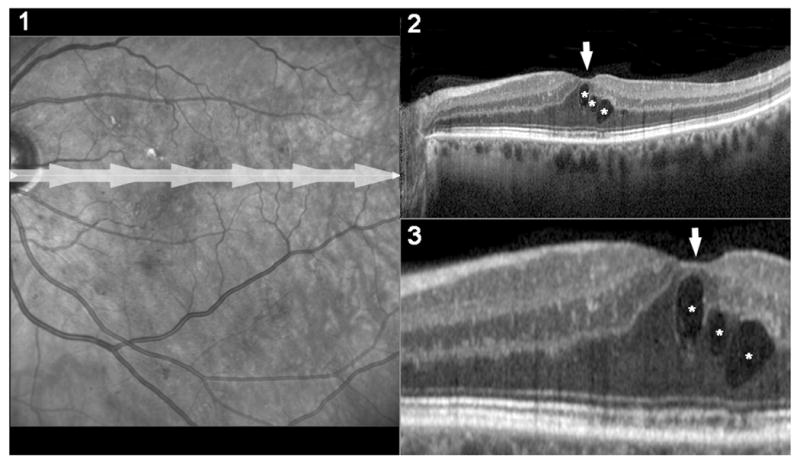
1) Fundus photograph of a left eye with macular edema from diabetic retinopathy. The gray-arrow shows the position of the spectral domain scan. 2) High resolution scan of the macula obtained with spectral domain OCT and showing thickening of the fovea (arrow) and 3 macular cysts (*). 3) Magnified view of the foveal area of the scan showed in (2). Because of the higher sensitivity and reproducibility, OCT has replaced funduscopic examination and stereoscopic fundus photographs as the gold standard test for detection of macular edema.
Figure 3. Peripapillary retinal nerve fiber layer (RNFL) thickness measurement with a third generation OCT.
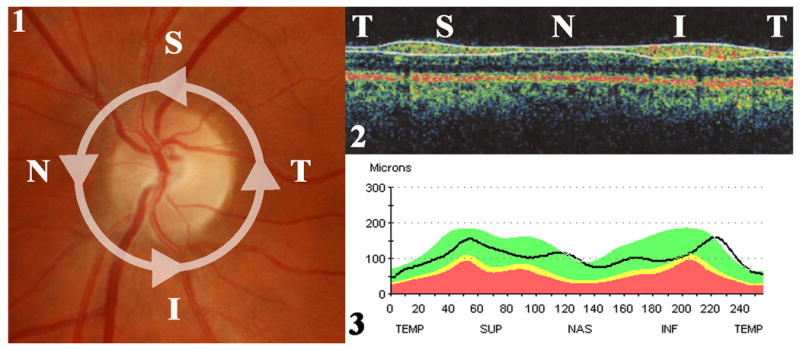
1) Fundus photograph of a left eye showing the location of the OCT scan. The scan is a circle of 3.4 mm diameter centered on the optic disc in order to analyze the peripapillary area. The scan begins in the temporal (T) part of the optic disc, then moves to the superior (S), the nasal (N), the inferior (I) parts, and back to the temporal part of the optic disc. 2) OCT produces a cross sectional image of the peripapillary retina which is color-coded and shows the temporal, superior, nasal, inferior and temporal areas on a same image. The RNFL is the most superficial layer. The software automatically recognizes the RNFL layer and delineates its borders as shown with the two superficial white lines. 3) The software measures the thickness along the scan and reports the results on a graphic display showing the RNFL thickness (in μm) along the temporal, superior, nasal, inferior and temporal areas. The RNFL is normally thicker in the superior and inferior parts of the optic disc. This is compared to a normative data-base matched for age. The white area corresponds to the upper 5th percentile of the control population. The green area means that the results are within the 90th median percentile of the control population and are normal. The yellow area means that the results are within the lower 5th percentile of the control population. The red area corresponds to the lower 1st percentile of the control population.
Retinal OCT was first used in vivo in 1993 (Swanson et al., 1993), and since that time, four generations of OCT machines have been developed. The third generation of commercially available OCT machines (also called time-domain OCT) is currently widely used in ophthalmology. The test lasts between 5 and 10 minutes during which the patient needs to be able to sit up with his or her head still, and fixate a light target with the studied eye. One eye is tested at a time, preferably after pharmacologic pupillary dilation. Good patient cooperation is important to limit eye-movement artifacts. Time-domain OCT has a resolution of approximately 10 μm, and is routinely used in macular diseases (Figure 1).
In neuro-ophthalmology, time-domain OCT is mostly used to measure the peripapillary RNFL thickness. In normal subjects, the thickness of the RNFL is higher in the superior and inferior portions of the optic disc than in the nasal and temporal portions. The OCT software automatically compares the results obtained in each quadrant with a normative database, in order to identify overall thinning of the layer, as well as focal defects (Figures 3, 4). Not surprisingly, peripapillary RNFL thickness is increased in patients with disc edema and is decreased in patients with optic atrophy of any cause. Measurements of the peripapillary RNFL thickness can also be repeated over time in the same patient to document changes, and numerous studies have shown that RNFL thickness measurements with OCT are reproducible as long as the same protocol and the same machine are used.
Figure 4. Results of peripapillary RNFL analysis performed with a third generation OCT for a patient with severe secondary progressive multiple sclerosis and a history of recurrent bilateral optic neuritis.
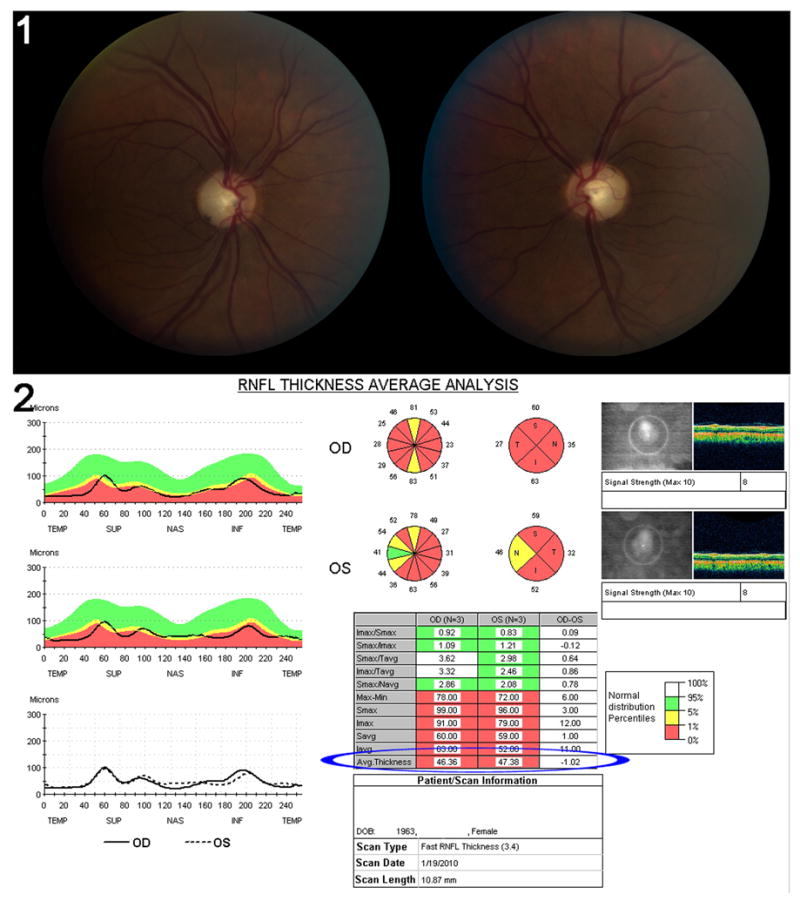
This patient has a visual acuity of 20/80 in the right eye and 20/70 in the left eye. Color vision is profoundly altered, pupils are sluggish and visual fields are severely diffusely depressed in both eyes. (1) Fundus photograph of both optic nerves showing severe bilateral optic disc pallor. The left eye is on the right, the right eye on the left. (2) Peripapillary RNFL results obtained on a third generation OCT. The quality of the test is good as shown by a signal strength of 8 in each eye. There is severe decreased average RNFL thickness (blue ellipse) with an average RNFL thickness of 46.36μmm in the right eye and 47.38μm in the left eye. The RNFL is diffusely decreased in all quadrants. The black line running through the red area indicates that this patient's results fall within the lowest percentile of the normal distribution in the normative database used as controls.
There are interindividual variations of peripapillary RNFL thickness, which is strongly influenced by age. In subjects in their 3rd decade, normal RNFL thickness is 104.4±7.6μm whereas in the 7th decade, normal RNFL thickness is decreased to 89.5±7.5μm (Harwerth et al., 2007). RNFL thinning with age had been estimated at 0.3μm/year or a decrease of approximately 0.27%/year. This emphasizes the need for age-matched healthy controls. Gender does not seem to influence the RNFL thickness (Ahn et al., 2005; Sony et al., 2004).
The newest generation of OCT (called spectral-domain OCT) has a higher spatial resolution (between 3 and 4 μm) and is approximately 50 times faster than the time-domain OCT machines (Wojtkowski et al., 2004; Wojtkowski et al., 2005). However, spectral-domain OCT is not routinely used in many centers yet and the results obtained with these machines cannot be directly compared to those obtained with time-domain OCT (Figures 1, 2). Spectral domain OCT also allows measurement of the macular volume (see below).
2. OCT and optic neuritis
a. The first studies
The loss of retinal nerve fibers associated with optic atrophy in patients with optic neuropathies can easily be visualized and quantified by OCT. The first OCT study in optic neuritis was published in 1999 by Parisi et al. (1999), and compared average peripapillary RNFL thickness in 14 MS-related optic neuritis patients, at least 1 year after the optic neuritis, and in 14 controls. Not surprisingly, they found a significant thinning of the RNFL average thickness and RNFL temporal thickness in the optic neuritis group compared to controls (by an average of 46%, p<0.01), and to the fellow-eye (non-affected) of these MS patients (by an average of 28%, p<0.01). These results were obtained with the first generation of OCT and therefore, cannot be compared with subsequent studies obtained with OCT-3 (time-domain OCT). In 2005, Trip et al. (2005) used the OCT-3 machine to correlate RNFL measures with visual function among 25 optic neuritis patients with incomplete visual recovery (11 with MS and 14 with a clinically isolated syndrome), and 15 controls. This study confirmed an average 33% reduction in RNFL thickness in the affected eyes of patients with previous optic neuritis compared with the eyes of matched controls, and an average 27% reduction when the affected and unaffected eyes of the same patient were compared (p<0.001). Thinning of the RNFL after optic neuritis has been confirmed in all subsequent studies including patients with or without MS.
b. RNFL thickness at the acute stage of optic neuritis
In 2006, Pro et al. (2006) showed that the RNFL is significantly thinner as early as 2 to 4 months after optic neuritis onset compared to baseline examination in 8 patients with optic neuritis. They also showed that, at baseline examination, the RNFL was slightly thicker in the eyes with acute posterior optic neuritis than in the fellow eyes, although none of these patients had apparent optic disc swelling on funduscopic examination. These studies confirmed that even posterior optic neuritis has mild disc edema on OCT acutely. The same year, Noval et al. (2006) described the evolution of RNFL thickness in 12 eyes with optic neuritis, among which 6 had optic disc edema at baseline. This study emphasized the importance of knowing the time elapsed between the onset of visual loss and OCT in interpreting the RNFL thickness on OCT.
c. Evolution of RNFL thickness after isolated optic neuritis
Only a few studies have included patients with isolated, unilateral optic neuritis followed sequentially over time. These studies have provided information on RNFL changes over time after an episode of optic neuritis, independent of MS. Costello et al. (2006) described the time course of RNFL thinning in optic neuritis. Thirty-eight patients with a single episode of optic neuritis seen within 1 month after the onset of visual loss were sequentially evaluated with OCT-3 within the 1st month and at 3-month intervals for a period of 1 year. They showed that RNFL thinning occurs mostly between months 3 and 6 in 85% of patients. The same group subsequently compared RNFL thickness between the two eyes of 78 patients who had one episode of unilateral isolated optic neuritis (without a diagnosis of MS) (Costello et al., 2008a). They showed that the earliest significant inter-eye differences were seen in the temporal region two months after the episode of optic neuritis; they also showed that RNFL thinning progressed for up to 6 months, and then stabilized from 7 to 12 months after acute optic neuritis. In 2009, Costello et al. (2009) did not find any additional thinning between the first and the second year after onset in 35 patients with isolated optic neuritis. However no studies are available with longer follow up to detect progressive thinning of RNFL. Because of physiologic RNFL thinning with age, these patients would need to be compared not only to their own baseline examination but also to age-matched control subjects at each examination.
d. RNFL thickness and visual function after isolated optic neuritis
Costello et al. (2006) suggested a correlation between RNFL thickness and visual acuity and visual field. In a first study on 54 patients with isolated optic neuritis, they found that RNFL correlated linearly with visual acuity when the RNFL was bellow 70μm. The RNFL thickness correlated also linearly with the mean deviation on Humphrey visual fields when the RNFL was bellow 75μm. In a subsequent study of 78 patients with isolated optic neuritis, they found the same RNFL thickness threshold of 75μm, below which both visual acuity and mean deviation on Humphrey visual field correlated linearly with RNFL thickness (Costello et al., 2008a). Interestingly, a similar threshold of 80μm was found amoung compressive optic neuropathies from chiasmal tumors, below which complete visual recovery after surgical decompression was very unlikely (Danesh-Meyer et al., 2008).
3. RNFL thickness in the fellow eye of patients with optic neuritis
Numerous studies have shown that thinning of the peripapillary RNFL is observed not only in eyes with a previous episode of optic neuritis but also in the presumably asymptomatic fellow eye of MS patients who had an episode of optic neuritis, as well as in MS patients who never had clinical acute optic neuritis (Fisher et al., 2006; Henderson et al., 2008; Jeanjean et al., 2008; Pueyo et al., 2009; Pueyo et al., 2008; Pulicken et al., 2007; Sepulcre et al., 2007). The mean RNFL thickness was found to be between 91.08 and 109.3μm in the fellow eye of patients with MS and optic neuritis (Cheng et al., 2007; Costello et al., 2009; Fisher et al., 2006; Frohman et al., 2009; Grazioli et al., 2008; Henderson et al., 2008; Klistorner et al., 2009; Merle et al., 2009; Noval et al., 2006; Pro et al., 2006; Pueyo et al., 2008; Pulicken et al., 2007; Ratchford et al., 2009; Rebolleda and Munoz-Negrete, 2008; Siger et al., 2008; Spain et al., 2009; Trip et al., 2005; Zaveri et al., 2008). In patients with MS but without clinical optic neuritis, the mean RNFL varied from 93.9 to 110.9 μm (Gundogan et al., 2007; Henderson et al., 2008; Jeanjean et al., 2008; Pueyo et al., 2009; Pulicken et al., 2007; Siger et al., 2008). These findings are consistent with previous reports of ongoing subclinical structural damage with axonal loss observed on brain MRIs of MS patients (De Stefano et al., 1998; Narayanan et al., 1997), reinforcing the belief that early treatment for MS may prevent progressive, subclinical axonal loss (Thrower, 2007). Evidence that MS is associated with progressive axonal loss in the afferent visual system has been available for several decades. This was shown on red-free retinal photography as early as 1974 (Frisen and Hoyt, 1974). Indeed, the anterior visual system is such a frequent target of MS that, on post-mortem analysis, almost all patients with MS are found to have changes in the optic nerve and RNFL, regardless of whether they have previously experienced optic neuritis (Ikuta and Zimmerman, 1976; Toussaint et al., 1983). Based on these data, it has been suggested that examination of the visual system could be used effectively to illustrate the histopathology of the disease process in MS (Frohman et al., 2008a; Frohman et al., 2008b), even in patients without clinical evidence of optic neuritis. Hence, measurements of the peripapillary RNFL thickness by OCT may be a reliable and easy way to estimate axonal loss in MS patients. One study specifically followed fellow eyes of patients with isolated optic neuritis who do not have MS at onset and patients with clinically isolated syndromes without a history of optic neuritis, and found no RNFL thinning compared to a control population (Outteryck et al., 2009). However, there was a trend toward temporal RNFL thinning in the patients, although this was not statistically significant. This lack of significance might have been explained by the fact that the control group was smaller than the patient group and was not age-matched to the patients, thereby decreasing the statistical power of the study.
4. RNFL thickness and multiple sclerosis
Few studies have measured the RNFL thickness of well-defined MS patients. Indeed, most OCT studies have included patients with and without a history of optic neuritis, and have pooled the results obtained on the fellow eye (presumably asymptomatic) of patients with prior optic neuritis with the eyes of patients without a history of optic neuritis. In addition, most studies have included heterogeneous patient populations in terms of disease severity and duration, treatment, progression, and age. Nevertheless, almost all studies have shown thinner RNFL in the eyes of MS patients compared with the eyes of healthy subjects. Eyes with a previous optic neuritis also had thinner RNFL than unaffected eyes of MS patients, who themselves had thinner RNFL thickness than the eyes of healthy subjects.
Macular volume can be measured with OCT in addition to RNFL thickness. Since the macula consists of mostly ganglion cell bodies, assessment of macular volume provides the opportunity to determine whether axonal loss (measured by the RNFL thickness) is associated with neuronal degeneration itself. Macular volume is determined by the OCT software using measurements of macular thickness and area (Burkholder et al., 2009).
a. RNFL thickness after optic neuritis and risk of multiple sclerosis
In 2008, Costello and al. (2008b) found that RNFL thinning after an episode of isolated optic neuritis cannot predict the risk of MS. They followed prospectively 50 consecutive patients with a single unilateral episode of optic neuritis without a history of MS during a mean period of 34 months, and compared the RNFL thickness of affected eyes and nonaffected eyes at 1 and 2 years after the onset of optic neuritis. Twenty-one of these 50 patients developed clinically definite MS. At 1 year follow up, the RNFL of affected eyes was thicker in patients with clinically definite MS (89μm) compared to non-MS patients (78μm). This surprising result was explained by the fact that non-MS patients had had more severe optic neuritis than MS patients in this study, emphasizing that RNFL thinning correlates mostly with the severity of optic neuritis and visual loss and does not help predict the subsequent risk of MS.
b. RNFL thickness and multiple sclerosis severity
More disabled MS patients may have a thinner RNFL on OCT. A two-year longitudinal study of a cohort of 61 MS patients found an inverse correlation at baseline between RNFL thickness and neurologic disability measured by the EDSS score (thinner RNFL correlated with worse disability) (Sepulcre et al., 2007). During follow-up, the subgroup of patients with more active disease developed a thinner temporal quadrant RNFL compared with neurologically stable patients. Another study of 52 MS patients showed thinner RNFL in the temporal quadrant of patients who had progression of their neurologic disability in the prior two years compared with patients who had remained neurologically stable (Toledo et al., 2008). The EDSS score correlated with both average and temporal thickness of the RNFL. A more recent study found the same inverse correlation between RNFL thickness and disease duration or EDSS in a population of 52 clinically isolated syndromes or MS patients who were not receiving any immunomodulating therapy (Spain et al., 2009).
A larger cohort study of 163 patients confirmed a thinner RNFL in patients with progressive MS (primary or secondary) compared to patients with relapsing remitting MS, even when adjusted for age and duration of the disease (Pulicken et al., 2007). Another study measured the RNFL in 23 patients with primary progressive MS and in 27 patients with secondary progressive MS without any history of optic neuritis in the studied eye and found thinning of the RNFL only in the temporal quadrant of patients with primary progressive MS, whereas the group with secondary progressive MS had significant RNFL thinning in overall mean, superior and temporal quadrants (Henderson et al., 2008). Costello et al. (2009) compared the RNFL thickness in patients with isolated optic neuritis, patients with relapsing remitting MS, and patients with secondary progressive MS followed over 2 years. In eyes that had an episode of optic neuritis, average RNFL thickness was similar in all groups at 1 or 2 year follow up, whereas temporal RNFL thickness was thinner in both MS groups compared with isolated optic neuritis patients. In unaffected eyes, secondary progressive MS patients had thinner RNFL at 1 and 2 years compared with relapsing remitting MS patients and those with isolated optic neuritis. Unaffected eyes of relapsing remitting MS patients had thinner temporal quadrant RNFL at 2 years compared with the unaffected eyes of patients with isolated optic neuritis.
These results suggest that measurement of RNFL thickness (particularly the temporal quadrant) in the unaffected eyes of MS patients may be helpful in differentiating MS subtypes and in predicting with MS progression and severity.
c. Does RNFL thinning reflect central nervous system axonal loss in multiple sclerosis?
Since 2006, it has been suggested that RNFL thickness measurement by OCT may be useful as a surrogate marker for brain atrophy in MS (Fisher et al., 2006). RNFL thinning correlates with optic nerve atrophy measured on both conventional MRI (Trip et al., 2006; Narayanan et al., 1997), and Magnetization Transfer Ratio (MTR) (Trip et al., 2007). A study of 61 MS patients showed a moderate correlation between the RNFL thickness and the brain white and grey matter volumes measured on conventional MRI, but not with the volume of T1, T2 or gadolinium–enhanced lesions (Sepulcre et al., 2007). A similar study on 18 MS patients confirmed a relationship between RNFL thickness and normalized brain and white matter volume (Grazioli et al., 2008). This study also suggested that a larger number of T2 lesions correlated with a thinner RNFL. A study of 51 MS patients suggested that the correlation between RNFL thickness and brain MRI measures of cerebral atrophy was better in the subgroup of patients without a clinical history of optic neuritis than in those patients with previous episodes of optic neuritis (Siger et al., 2008). In another study of 40 patients with MS, RNFL thickness independently correlated with the brain parenchymal fraction (BPF) derived from high-resolution anatomic MRI. In this study, BPF also correlated with the EDSS disability score (Toledo et al., 2008). More recently, a similar correlation was found between RNFL thickness and T1 or T2 lesion volume, grey matter atrophy, MTR, and diffusion tensor imaging measures (DTI) in MS patients with or without a history of optic neuropathy (Frohman et al., 2009). These MRI parameters also correlated with low contrast visual acuity, a sensitive marker of optic nerve dysfunction in MS.
5. Can RNFL thickness be used as an outcome in clinical trials for multiple sclerosis?
Some authors have suggested that measurement of RNFL thickness by OCT may be a better way than brain MRI to detect and monitor axonal loss in MS, based on the following observations: 1) OCT is easy to obtain, noninvasive, and much cheaper than MRI. However, interpretation of OCT requires a good understanding of the technique and machine used as well as correlation with a detailed ophthalmic examination. 2) The resolution of OCT is far better than that of brain MRI when measuring early axonal loss. 3) Because there is no myelin in the retina, RNFL measurements are independent of myelin disorders, and may only reflect axonal thinning or loss. However, RNFL do not only contain axons but also supportive tissues, explaining why even patients with complete optic atrophy and no light perception vision still have a peripapillary RNFL thickness of about 40μm (Hood et al., 2009). 4) It is relatively easy to correlate OCT findings with visual function using well validated functional instruments such as visual acuity, low-contrast visual acuity, contrast sensitivity, color vision, visual fields, and visual evoked potentials. 5) There is a good correlation between RNFL thinning observed with OCT and abnormalities of visual function. Indeed, ongoing studies and clinical trials have already started to include RNFL thickness measurements by standardized OCT protocols into their outcome measures.
6. OCT and neuromyelitis optica
Patients with neuromyelitis optica (NMO) and a single episode of optic neuritis have thinner RNFL thickness than MS patients, even when controlling for the severity of the vision loss as a confounding factor (Naismith et al., 2009). This is likely explained by the more severe axonal loss observed early in the course of NMO versus MS-related optic neuritis. De Seze et al. (2008) also showed that a decrease in RNFL thickness correlates with neurologic disability measured by EDSS in NMO. In a recent study, Ratchford et al. (2009) found that a first episode of optic neuritis causes an average RNFL thinning of 31μm in NMO patients compared with only 10μm in MS-related optic neuritis patients. Each additional episode causes 10μm RNFL thinning in NMO patients and no significant change in MS patients. They also observed that RNFL thickness differences between the affected and the non-affected eye in the same patient was greater than 15μm in 75% of NMO patients and in only 24% of MS patients. They suggested that non-MS patients with a history of unilateral optic neuritis longer than 3 months and with inter-eye RNFL thickness differences of 15μm or more should be investigated for a NMO spectrum disorder.
7. OCT and other neurologic diseases
Several studies have demonstrated evidence of RNFL thinning in various neurologic diseases in which there is brain atrophy, such as Alzheimer disease and Parkinson disease suggesting that this technology might also prove useful in other neurodegenerative disorders (Altintas et al., 2008; Berisha et al., 2007; Hajee et al., 2009; Inzelberg et al., 2004; Iseri et al., 2006; Paquet et al., 2007; Parisi et al., 2001). A decrease in average RNFL was been shown in patients with Alzheimer disease compared with age-matched controls, but there was no correlation between RNFL and cognitive impairment (Berisha et al., 2007; Iseri et al., 2006; Paquet et al., 2007; Parisi et al., 2001). Similarly, a few studies suggested decreased average RNFL in patients with Parkinson disease compared with age matched controls, but its correlation with disease duration or disability remains debated (Altintas et al., 2008; Hajee et al., 2009; Inzelberg et al., 2004; Jeon et al., 2006). Such results are not surprising and confirm the possible use of OCT to measure the RNFL thickness and macular volume as surrogate markers for axonal loss in neurologic diseases other than MS; however, more studies will be needed before recommending the use of OCT in individual patients with degenerative neurologic disorders or as an outcome measure in clinical trials.
8. The new generation of spectral domain OCT
The newest generation of OCT machines is called “spectral domain OCT”, because they use a spectrograph and Fourier transformation of the signal to decrease the acquisition time by a factor of 50 (Wojtkowski et al., 2004). Refinement of the laser beam has also increased the axial resolution to between 3 and 4 μm (Wojtkowski et al., 2005). Spectral OCT has made it possible to represent volume and not just a two-dimensional image as in time-domain OCT (OCT-3). The increased resolution of spectral domain OCT allows automatic identification of all retinal layers and measurement of macular thickness and volume (Figures 1, 2) (Garvin et al., 2009). Unfortunately, data obtained with spectral domain cannot be directly compared to previously acquired data with OCT-3 and among the various spectral-domain OCT machines that are currently being used around the world. This limitation needs to be kept in mind when considering using spectral domain OCT in clinical trials.
Conclusions
Measurement of RNFL thickness with OCT is already used as one of the major endpoints in ongoing clinical trials, confirming that OCT has become an important biomarker in the investigation of the efficacy of therapeutic regimens in MS and other neurological disorders.
However it is important to emphasize that the use of OCT in daily clinical neuro-ophthalmologic practice remains very limited at this point in time. Measurements of RNFL thickness and macular volume by OCT may become part of the routine battery of tests performed to follow MS patients and measure disease activity and effects of treatments in the future.
Supplementary Material
Acknowledgments
This work was supported in part by a departmental grant (Department of Ophthalmology) from Research to Prevent Blindness, Inc, New York, New York, and by core grant P30-EY06360 (Department of Ophthalmology) from the National Institute of Health, Bethesda, Maryland. Dr Newman is a recipient of a Research to Prevent Blindness Lew R. Wasserman Merit Award. Dr Lamirel is supported by Research Grants from Institut Servier (Paris, France), Fondation Planiol (Varennes, France) and the Philippe Foundation Inc. (New York, USA).
Footnotes
We have no conflict of interest.
References
- Ahn HC, Son HW, Kim JS, Lee JH. Quantitative analysis of retinal nerve fiber layer thickness of normal children and adolescents. Korean J Ophthalmol. 2005;19:195–200. doi: 10.3341/kjo.2005.19.3.195. [DOI] [PubMed] [Google Scholar]
- Altintas O, Iseri P, Ozkan B, Caglar Y. Correlation between retinal morphological and functional findings and clinical severity in Parkinson's disease. Doc Ophthalmol. 2008;116:137–46. doi: 10.1007/s10633-007-9091-8. [DOI] [PubMed] [Google Scholar]
- Barkhof F, Calabresi PA, Miller DH, Reingold SC. Imaging outcomes for neuroprotection and repair in multiple sclerosis trials. Nat Rev Neurol. 2009;5:256–66. doi: 10.1038/nrneurol.2009.41. [DOI] [PubMed] [Google Scholar]
- Berisha F, Feke GT, Trempe CL, McMeel JW, Schepens CL. Retinal abnormalities in early Alzheimer's disease. Invest Ophthalmol Vis Sci. 2007;48:2285–9. doi: 10.1167/iovs.06-1029. [DOI] [PubMed] [Google Scholar]
- Burkholder BM, Osborne B, Loguidice MJ, Bisker E, Frohman TC, Conger A, et al. Macular volume determined by optical coherence tomography as a measure of neuronal loss in multiple sclerosis. Arch Neurol. 2009;66:1366–72. doi: 10.1001/archneurol.2009.230. [DOI] [PubMed] [Google Scholar]
- Cheng H, Laron M, Schiffman JS, Tang RA, Frishman LJ. The relationship between visual field and retinal nerve fiber layer measurements in patients with multiple sclerosis. Invest Ophthalmol Vis Sci. 2007;48:5798–805. doi: 10.1167/iovs.07-0738. [DOI] [PMC free article] [PubMed] [Google Scholar]
- Costello F, Coupland S, Hodge W, Lorello GR, Koroluk J, Pan YI, et al. Quantifying axonal loss after optic neuritis with optical coherence tomography. Ann Neurol. 2006;59:963–9. doi: 10.1002/ana.20851. [DOI] [PubMed] [Google Scholar]
- Costello F, Hodge W, Pan YI, Eggenberger E, Coupland S, Kardon RH. Tracking retinal nerve fiber layer loss after optic neuritis: a prospective study using optical coherence tomography. Mult Scler. 2008a;14:893–905. doi: 10.1177/1352458508091367. [DOI] [PubMed] [Google Scholar]
- Costello F, Hodge W, Pan YI, Freedman M, DeMeulemeester C. Differences in retinal nerve fiber layer atrophy between multiple sclerosis subtypes. J Neurol Sci. 2009;281:74–9. doi: 10.1016/j.jns.2009.02.354. [DOI] [PubMed] [Google Scholar]
- Costello F, Hodge W, Pan YI, Metz L, Kardon RH. Retinal nerve fiber layer and future risk of multiple sclerosis. Can J Neurol Sci. 2008b;35:482–7. doi: 10.1017/s031716710000915x. [DOI] [PubMed] [Google Scholar]
- Danesh-Meyer HV, Papchenko T, Savino PJ, Law A, Evans J, Gamble GD. In vivo retinal nerve fiber layer thickness measured by optical coherence tomography predicts visual recovery after surgery for parachiasmal tumors. Invest Ophthalmol Vis Sci. 2008;49:1879–85. doi: 10.1167/iovs.07-1127. [DOI] [PubMed] [Google Scholar]
- de Seze J, Blanc F, Jeanjean L, Zephir H, Labauge P, Bouyon M, et al. Optical coherence tomography in neuromyelitis optica. Arch Neurol. 2008;65:920–3. doi: 10.1001/archneur.65.7.920. [DOI] [PubMed] [Google Scholar]
- De Stefano N, Matthews PM, Fu L, Narayanan S, Stanley J, Francis GS, et al. Axonal damage correlates with disability in patients with relapsing-remitting multiple sclerosis. Results of a longitudinal magnetic resonance spectroscopy study. Brain. 1998;121:1469–77. doi: 10.1093/brain/121.8.1469. [DOI] [PubMed] [Google Scholar]
- Fisher JB, Jacobs DA, Markowitz CE, Galetta SL, Volpe NJ, Nano-Schiavi ML, et al. Relation of visual function to retinal nerve fiber layer thickness in multiple sclerosis. Ophthalmology. 2006;113:324–32. doi: 10.1016/j.ophtha.2005.10.040. [DOI] [PubMed] [Google Scholar]
- Frisen L, Hoyt WF. Insidious atrophy of retinal nerve fibers in multiple sclerosis. Funduscopic identification in patients with and without visual complaints. Arch Ophthalmol. 1974;92:91–7. doi: 10.1001/archopht.1974.01010010097001. [DOI] [PubMed] [Google Scholar]
- Frohman EM, Costello F, Stuve O, Calabresi P, Miller DH, Hickman SJ, et al. Modeling axonal degeneration within the anterior visual system: implications for demonstrating neuroprotection in multiple sclerosis. Arch Neurol. 2008a;65:26–35. doi: 10.1001/archneurol.2007.10. [DOI] [PubMed] [Google Scholar]
- Frohman EM, Dwyer MG, Frohman T, Cox JL, Salter A, Greenberg BM, et al. Relationship of optic nerve and brain conventional and non-conventional MRI measures and retinal nerve fiber layer thickness, as assessed by OCT and GDx: a pilot study. J Neurol Sci. 2009;282:96–105. doi: 10.1016/j.jns.2009.04.010. [DOI] [PubMed] [Google Scholar]
- Frohman EM, Fujimoto JG, Frohman TC, Calabresi PA, Cutter G, Balcer LJ. Optical coherence tomography: a window into the mechanisms of multiple sclerosis. Nat Clin Pract Neurol. 2008b;4:664–75. doi: 10.1038/ncpneuro0950. [DOI] [PMC free article] [PubMed] [Google Scholar]
- Garvin MK, Abramoff MD, Wu X, Russell SR, Burns TL, Sonka M. Automated 3-D intraretinal layer segmentation of macular spectral-domain optical coherence tomography images. IEEE Trans Med Imaging. 2009;28:1436–47. doi: 10.1109/TMI.2009.2016958. [DOI] [PMC free article] [PubMed] [Google Scholar]
- Grazioli E, Zivadinov R, Weinstock-Guttman B, Lincoff N, Baier M, Wong JR, et al. Retinal nerve fiber layer thickness is associated with brain MRI outcomes in multiple sclerosis. J Neurol Sci. 2008;268:12–7. doi: 10.1016/j.jns.2007.10.020. [DOI] [PubMed] [Google Scholar]
- Gundogan FC, Demirkaya S, Sobaci G. Is optical coherence tomography really a new biomarker candidate in multiple sclerosis?--A structural and functional evaluation. Invest Ophthalmol Vis Sci. 2007;48:5773–81. doi: 10.1167/iovs.07-0834. [DOI] [PubMed] [Google Scholar]
- Hajee ME, March WF, Lazzaro DR, Wolintz AH, Shrier EM, Glazman S, et al. Inner retinal layer thinning in Parkinson disease. Arch Ophthalmol. 2009;127:737–41. doi: 10.1001/archophthalmol.2009.106. [DOI] [PubMed] [Google Scholar]
- Harwerth RS, Vilupuru AS, Rangaswamy NV, Smith EL., 3rd The relationship between nerve fiber layer and perimetry measurements. Invest Ophthalmol Vis Sci. 2007;48:763–73. doi: 10.1167/iovs.06-0688. [DOI] [PubMed] [Google Scholar]
- Henderson AP, Trip SA, Schlottmann PG, Altmann DR, Garway-Heath DF, Plant GT, et al. An investigation of the retinal nerve fibre layer in progressive multiple sclerosis using optical coherence tomography. Brain. 2008;131:277–87. doi: 10.1093/brain/awm285. [DOI] [PubMed] [Google Scholar]
- Hood DC, Anderson SC, Wall M, Raza AS, Kardon RH. A Test of a Linear Model of Glaucomatous Structure-Function Loss Reveals Sources of Variability in Retinal Nerve Fiber and Visual Field Measurements. Invest Ophthalmol Vis Sci. 2009;50:4254–66. doi: 10.1167/iovs.08-2697. [DOI] [PMC free article] [PubMed] [Google Scholar]
- Ikuta F, Zimmerman HM. Distribution of plaques in seventy autopsy cases of multiple sclerosis in the United States. Neurology. 1976;26:26–8. doi: 10.1212/wnl.26.6_part_2.26. [DOI] [PubMed] [Google Scholar]
- Inzelberg R, Ramirez JA, Nisipeanu P, Ophir A. Retinal nerve fiber layer thinning in Parkinson disease. Vision Res. 2004;44:2793–7. doi: 10.1016/j.visres.2004.06.009. [DOI] [PubMed] [Google Scholar]
- Iseri PK, Altinas O, Tokay T, Yuksel N. Relationship between cognitive impairment and retinal morphological and visual functional abnormalities in Alzheimer disease. J Neuroophthalmol. 2006;26:18–24. doi: 10.1097/01.wno.0000204645.56873.26. [DOI] [PubMed] [Google Scholar]
- Jeanjean L, Castelnovo G, Carlander B, Villain M, Mura F, Dupeyron G, et al. Retinal atrophy using optical coherence tomography (OCT) in 15 patients with multiple sclerosis and comparison with healthy subjects. Rev Neurol (Paris) 2008;164:927–34. doi: 10.1016/j.neurol.2008.03.008. [DOI] [PubMed] [Google Scholar]
- Jeon SW, Shure MA, Baker KB, Huang D, Rollins AM, Chahlavi A, et al. A feasibility study of optical coherence tomography for guiding deep brain probes. J Neurosci Methods. 2006;154:96–101. doi: 10.1016/j.jneumeth.2005.12.008. [DOI] [PMC free article] [PubMed] [Google Scholar]
- Klistorner A, Arvind H, Nguyen T, Garrick R, Paine M, Graham S, et al. Multifocal VEP and OCT in optic neuritis: a topographical study of the structure-function relationship. Doc Ophthalmol. 2009;118:129–37. doi: 10.1007/s10633-008-9147-4. [DOI] [PubMed] [Google Scholar]
- Lamirel C, Newman NJ, Biousse V. The Use of Optical Coherence Tomography in Neurology. Rev Neurol Dis. 2009;6:105–120. [PubMed] [Google Scholar]
- Merle H, Olindo S, Donnio A, Beral L, Richer R, Smadja D, et al. Retinal nerve fiber layer thickness and spatial and temporal contrast sensitivity in multiple sclerosis. Eur J Ophthalmol. 2009 doi: 10.1177/112067211002000122. [DOI] [PubMed] [Google Scholar]
- Naismith RT, Tutlam NT, Xu J, Klawiter EC, Shepherd J, Trinkaus K, et al. Optical coherence tomography differs in neuromyelitis optica compared with multiple sclerosis. Neurology. 2009;72:1077–82. doi: 10.1212/01.wnl.0000345042.53843.d5. [DOI] [PMC free article] [PubMed] [Google Scholar]
- Narayanan S, Fu L, Pioro E, De Stefano N, Collins DL, Francis GS, et al. Imaging of axonal damage in multiple sclerosis: spatial distribution of magnetic resonance imaging lesions. Ann Neurol. 1997;41:385–91. doi: 10.1002/ana.410410314. [DOI] [PubMed] [Google Scholar]
- Noval S, Contreras I, Rebolleda G, Munoz-Negrete FJ. Optical coherence tomography versus automated perimetry for follow-up of optic neuritis. Acta Ophthalmol Scand. 2006;84:790–4. doi: 10.1111/j.1600-0420.2006.00724.x. [DOI] [PubMed] [Google Scholar]
- Outteryck O, Zephir H, Defoort S, Bouyon M, Debruyne P, Bouacha I, et al. Optical coherence tomography in clinically isolated syndrome: no evidence of subclinical retinal axonal loss. Arch Neurol. 2009;66:1373–7. doi: 10.1001/archneurol.2009.265. [DOI] [PubMed] [Google Scholar]
- Paquet C, Boissonnot M, Roger F, Dighiero P, Gil R, Hugon J. Abnormal retinal thickness in patients with mild cognitive impairment and Alzheimer's disease. Neurosci Lett. 2007;420:97–9. doi: 10.1016/j.neulet.2007.02.090. [DOI] [PubMed] [Google Scholar]
- Parisi V, Manni G, Spadaro M, Colacino G, Restuccia R, Marchi S, et al. Correlation between morphological and functional retinal impairment in multiple sclerosis patients. Invest Ophthalmol Vis Sci. 1999;40:2520–7. [PubMed] [Google Scholar]
- Parisi V, Restuccia R, Fattapposta F, Mina C, Bucci MG, Pierelli F. Morphological and functional retinal impairment in Alzheimer's disease patients. Clin Neurophysiol. 2001;112:1860–7. doi: 10.1016/s1388-2457(01)00620-4. [DOI] [PubMed] [Google Scholar]
- Pro MJ, Pons ME, Liebmann JM, Ritch R, Zafar S, Lefton D, et al. Imaging of the optic disc and retinal nerve fiber layer in acute optic neuritis. J Neurol Sci. 2006;250:114–9. doi: 10.1016/j.jns.2006.08.012. [DOI] [PubMed] [Google Scholar]
- Pueyo V, Ara JR, Almarcegui C, Martin J, Guerri N, Garcia E, et al. Sub-clinical atrophy of the retinal nerve fibre layer in multiple sclerosis. Acta Ophthalmol. 2009 doi: 10.1111/j.1755-3768.2009.01527.x. [DOI] [PubMed] [Google Scholar]
- Pueyo V, Martin J, Fernandez J, Almarcegui C, Ara J, Egea C, et al. Axonal loss in the retinal nerve fiber layer in patients with multiple sclerosis. Mult Scler. 2008;14:609–14. doi: 10.1177/1352458507087326. [DOI] [PubMed] [Google Scholar]
- Pulicken M, Gordon-Lipkin E, Balcer LJ, Frohman E, Cutter G, Calabresi PA. Optical coherence tomography and disease subtype in multiple sclerosis. Neurology. 2007;69:2085–92. doi: 10.1212/01.wnl.0000294876.49861.dc. [DOI] [PubMed] [Google Scholar]
- Ratchford JN, Quigg ME, Conger A, Frohman T, Frohman E, Balcer LJ, et al. Optical coherence tomography helps differentiate neuromyelitis optica and MS optic neuropathies. Neurology. 2009;73:302–8. doi: 10.1212/WNL.0b013e3181af78b8. [DOI] [PMC free article] [PubMed] [Google Scholar]
- Rebolleda G, Munoz-Negrete FJ. Follow-up of Mild Papilledema in Idiopathic Intracranial Hypertension with Optical Coherence Tomography. Invest Ophthalmol Vis Sci. 2008;50:5197–200. doi: 10.1167/iovs.08-2528. [DOI] [PubMed] [Google Scholar]
- Sakata LM, Deleon-Ortega J, Sakata V, Girkin CA. Optical coherence tomography of the retina and optic nerve - a review. Clin Experiment Ophthalmol. 2009;37:90–9. doi: 10.1111/j.1442-9071.2009.02015.x. [DOI] [PubMed] [Google Scholar]
- Sepulcre J, Murie-Fernandez M, Salinas-Alaman A, Garcia-Layana A, Bejarano B, Villoslada P. Diagnostic accuracy of retinal abnormalities in predicting disease activity in MS. Neurology. 2007;68:1488–94. doi: 10.1212/01.wnl.0000260612.51849.ed. [DOI] [PubMed] [Google Scholar]
- Sergott RC, Frohman E, Glanzman R, Al-Sabbagh A. The role of optical coherence tomography in multiple sclerosis: expert panel consensus. J Neurol Sci. 2007;263:3–14. doi: 10.1016/j.jns.2007.05.024. [DOI] [PubMed] [Google Scholar]
- Siger M, Dziegielewski K, Jasek L, Bieniek M, Nicpan A, Nawrocki J, et al. Optical coherence tomography in multiple sclerosis : Thickness of the retinal nerve fiber layer as a potential measure of axonal loss and brain atrophy. J Neurol. 2008;255:1555–60. doi: 10.1007/s00415-008-0985-5. [DOI] [PubMed] [Google Scholar]
- Sony P, Sihota R, Tewari HK, Venkatesh P, Singh R. Quantification of the retinal nerve fibre layer thickness in normal Indian eyes with optical coherence tomography. Indian J Ophthalmol. 2004;52:303–9. [PubMed] [Google Scholar]
- Spain RI, Maltenfort M, Sergott RC, Leist TP. Thickness of retinal nerve fiber layer correlates with disease duration in parallel with corticospinal tract dysfunction in untreated multiple sclerosis. J Rehabil Res Dev. 2009;46:633–42. doi: 10.1682/jrrd.2008.11.0156. [DOI] [PubMed] [Google Scholar]
- Swanson EA, Izatt JA, Hee MR, Huang D, Lin CP, Schuman JS, et al. In vivo retinal imaging by optical coherence tomography. Opt Lett. 1993;18:1864–1866. doi: 10.1364/ol.18.001864. [DOI] [PubMed] [Google Scholar]
- Thrower BW. Clinically isolated syndromes: predicting and delaying multiple sclerosis. Neurology. 2007;68:S12–5. doi: 10.1212/01.wnl.0000277704.56189.85. [DOI] [PubMed] [Google Scholar]
- Toledo J, Sepulcre J, Salinas-Alaman A, Garcia-Layana A, Murie-Fernandez M, Bejarano B, et al. Retinal nerve fiber layer atrophy is associated with physical and cognitive disability in multiple sclerosis. Mult Scler. 2008;14:906–12. doi: 10.1177/1352458508090221. [DOI] [PubMed] [Google Scholar]
- Toussaint D, Perier O, Verstappen A, Bervoets S. Clinicopathological study of the visual pathways, eyes, and cerebral hemispheres in 32 cases of disseminated sclerosis. J Clin Neuroophthalmol. 1983;3:211–20. [PubMed] [Google Scholar]
- Trip SA, Schlottmann PG, Jones SJ, Altmann DR, Garway-Heath DF, Thompson AJ, et al. Retinal nerve fiber layer axonal loss and visual dysfunction in optic neuritis. Ann Neurol. 2005;58:383–91. doi: 10.1002/ana.20575. [DOI] [PubMed] [Google Scholar]
- Trip SA, Schlottmann PG, Jones SJ, Li WY, Garway-Heath DF, Thompson AJ, et al. Optic nerve atrophy and retinal nerve fibre layer thinning following optic neuritis: evidence that axonal loss is a substrate of MRI-detected atrophy. Neuroimage. 2006;31:286–93. doi: 10.1016/j.neuroimage.2005.11.051. [DOI] [PubMed] [Google Scholar]
- Trip SA, Schlottmann PG, Jones SJ, Li WY, Garway-Heath DF, Thompson AJ, et al. Optic nerve magnetization transfer imaging and measures of axonal loss and demyelination in optic neuritis. Mult Scler. 2007;13:875–9. doi: 10.1177/1352458507076952. [DOI] [PubMed] [Google Scholar]
- Wojtkowski M, Bajraszewski T, Gorczynska I, Targowski P, Kowalczyk A, Wasilewski W, et al. Ophthalmic imaging by spectral optical coherence tomography. Am J Ophthalmol. 2004;138:412–9. doi: 10.1016/j.ajo.2004.04.049. [DOI] [PubMed] [Google Scholar]
- Wojtkowski M, Srinivasan V, Fujimoto JG, Ko T, Schuman JS, Kowalczyk A, et al. Three-dimensional retinal imaging with high-speed ultrahigh-resolution optical coherence tomography. Ophthalmology. 2005;112:1734–46. doi: 10.1016/j.ophtha.2005.05.023. [DOI] [PMC free article] [PubMed] [Google Scholar]
- Zaveri MS, Conger A, Salter A, Frohman TC, Galetta SL, Markowitz CE, et al. Retinal imaging by laser polarimetry and optical coherence tomography evidence of axonal degeneration in multiple sclerosis. Arch Neurol. 2008;65:924–8. doi: 10.1001/archneur.65.7.924. [DOI] [PubMed] [Google Scholar]
Associated Data
This section collects any data citations, data availability statements, or supplementary materials included in this article.