

Abstract
Frataxin, a conserved nuclear encoded mitochondrial protein, plays a direct role in iron-sulfur cluster biosynthesis within the ISC assembly pathway. Humans with frataxin deficiency have Friedreich’s ataxia, a neurodegenerative disorder characterized by mitochondrial iron overload and disruption in Fe-S cluster synthesis. Biochemical and genetic studies have shown frataxin interacts with the iron-sulfur cluster assembly scaffold protein (in yeast, there are two: Isu1 and Isu2), indicating frataxin plays a direct role in cluster assembly, possibly by serving as an iron chaperone n the assembly pathway. Here we provide molecular details of how yeast frataxin (Yfh1) interacts with Isu1 as a structural module to better understand the multiprotein complex assembly that completes Fe-S cluster assembly; this complex also includes the cysteine desulfurase (Nfs1 in yeast) and the accessory protein (Isd11), together in the mitochondria. Thermodynamic binding parameters for protein partner and iron binding were measured for the yeast orthologs using isothermal titration calorimetry (ITC). Nuclear magnetic resonance spectroscopy was used to provide the molecular details to understand how Yfh1 interacts with Isu1. X-ray absorption studies were used to electronically and structurally characterize how iron is transferred to Isu1 and then incorporated into a Fe-S cluster. These results were combined with previously published data to generate a structural model for how the Fe-S cluster protein assembly complex can come together to accomplish Fe-S cluster assembly.
Keywords: Iron Chaperone, Frataxin, Yfh1, Isu1, Nfs1, NMR, ITC and Iron-Sulfur Cluster Assembly
Iron-sulfur (Fe-S) clusters are central to life and found in nearly every class of organism (1). These ancient but conserved cofactors are bound to proteins involved in a diverse array of essential functions, ranging from DNA repair to respiration. Since Fe-S cofactors are essential for cell viability, it is no surprise proteins that produce these cofactors are tightly controlled and evolutionarily conserved (2–4). In eukaryotes, the major Fe-S cluster assembly machinery is found in the mitochondria. The process of Fe-S cluster synthesis involves the formation of an Fe-S cluster intermediate on a scaffold protein (ISCU in humans or Isu1 or Isu2 in yeast) and subsequent transfer of the cluster to recipient apo-proteins. Formation of the Fe-S cluster by Isu1 requires a source of sulfur and a source of iron. The sulfur originates from cysteine via the activity of the cysteine desulfurase Nfs1, which is coordinated with the essential accessory protein Isd11. The source of the iron for Fe-S clusters has remained a mystery. Frataxin (Yfh1 in yeast), a small acidic mitochondrial protein is directly linked to cluster assembly and has been suggested to serve as an iron chaperone through formation of a complex with Isu1-Nfs1-Isd11 (5–8).
Humans with frataxin deficiency have the cardio-/neurodegenerative disorder Friedreich’s ataxia (FRDA) (9–11). FRDA affects 1 in 50,000 live births and the disorder is caused in ca. 98% of the cases by a transcription disrupting trinucleotide repeat expansion in the first intron of the frataxin gene leading to decreased transcription and protein levels (9). Frataxin is essential for cellular iron homeostasis and deficiency is associated with mitochondrial iron overload, low heme and Fe-S cluster production levels, and elevation in reactive oxygen species formation (12). Numerous reports have shown direct interactions between frataxin and the scaffold protein in mitochondrial lysates or through isolation (5, 6, 8, 13). In addition, frataxin has been shown to facilitate assembly of the Fe-S cluster intermediate on Isu1 (14–16). Combined, these data strongly suggest that frataxin plays a direct role in Fe-S cluster bioassembly, possibly by serving as the iron chaperone or, as recently suggested (14), as a regulator within the assembly pathway.
Participation of frataxin in the Fe-S cluster assembly pathway is directly correlated to the protein’s ability to bind iron and this metal binding ability has been studied extensively for the different frataxin orthologs. Yeast frataxin was the first to show an iron binding ability (17). When placed in an oxygen rich, low salt, high iron to protein ratio environment, the protein forms oligomers that retain metal as ferrihydrite in a manner that resembles the activity of ferritin (17). This ability has been shown to be important under oxidative stress conditions (18). However, frataxin mutations that disrupt oligomerization are functionally competent in promoting Fe-S cluster assembly in vivo, even when produced at low levels, thus oligomerization is not required for the physiological function of frataxin in assembly of Fe-S clusters (8, 19). As a monomer, the different frataxin orthologs bind iron with micromolar binding affinities (15, 16, 20–24). Frataxin binding to the scaffold protein is independent of frataxin aggregation but dependent on the presence of iron (8, 15). It is therefore of direct physiological interest to explore the molecular details of the interaction between frataxin and the scaffold protein in order to better understand the functional details of the cofactor assembly pathway.
In this report, we provide new molecular details pivotal for understanding the interaction between Yfh1 and Isu1. We probe the nature of holo-Yfh1 binding to Isu1 using isothermal titration calorimetry (ITC). Nuclear magnetic resonance spectroscopy was used to map the intermolecular interface where Isu1 binds on Yfh1 to help identify frataxin residues that participate in multiprotein complex formation. X-ray absorption spectroscopy was used to determine the electronic and structural properties of iron at multiple stages during Fe-S cluster assembly on the Isu1 scaffold. Finally, the fold of Isu1 was characterized at different stages during Fe-S cluster assembly using fluorescence spectroscopy. These combined results provide molecular details that are essential to understanding mitochondrial Fe-S cluster assembly.
EXPERIMENTAL
Molecular biology and protein purification
The plasmid for expression of mature Isu1 (minus 35 amino terminal amino acids) containing the D37A mutation (known to prevent Fe-S release from the protein) and the biophysical characterization of the apo-protein was described previously (15). Briefly, the plasmid was transformed into BL21(DE3) CodonPlus cells and grown by auto induction (25) at 25 °C for ca. 24 hrs before harvesting by centrifugation. Protein isolation steps were all performed at 4 °C. Cells were resuspended in 50 mM NaPO4 (pH 7.5), 300 mM NaCl, 20 mM Imidazole and 5 mM β-Me (5 mL/g cells) in the presence of Complete EDTA free Protease inhibitor cocktail (Roche), lysed by two passes through a French Pressure cell followed by 2 rounds of sonication (50% power for 20 seconds) and centrifuged at high speed (21000 rpm) for 1 hour. Crude soluble fraction was filtered (0.20 μm) and loaded onto a HisPrep FF Ni column (Pharmacia) using an Imidazole gradient (20 – 500 mM, protein elutes ~ 120 mM). Isu1 containing fractions were pooled and concentrated to ca. 1mL using 3 kDa cutoff centricons (Millipore) and run over a Sephadex 75 size exclusion column (Pharmacia) equilibrated with 20 mM HEPES buffer (pH 7.5), 150 mM NaCl and 5 mM β-Me. The protein eluted at a volume consistent with a 15.5 kDa size and we were able to attain ≥ 95% pure protein based on gel analysis (typical yields were 15 mg/L).
Apo-Yfh1 was isolated as described previously (22). Briefly, wild type Yfh1 was subcloned into a pET11a expression vector (Novagen), transfected into BL21(DE3) cells and grown by auto induction (Studier 2005) at 37 °C for 18 hrs before harvesting through centrifugation. All subsequent steps were performed at 4 °C. Cells were resuspended in 25mM Tris buffer (pH 8.0), 10mM EDTA and 5mM β-Me with Complete protease inhibitor cocktail, lysed using 2 passes through a French Pressure Cell followed by 2 rounds of sonication at 50% power and spun at high speed (21,000 rpm for 1hr). A 30% Ammonium Sulfate (AS) condition was applied to the supernatant and spun down (8,000 rpm for 10 min). The remaining supernatant was brought to 65% AS and again spun down (8,000 rpm for 10 min). The pellet was then resuspended in a minimal volume of 25 mM Tris (pH 8.0), 10 mM EDTA, 5 mM β-Me and 1 protease inhibitor tablet, set to stir for 20 min before being loaded into a dialysis membrane (10 kDa cutoff) and dialyzed into the same buffer overnight with one buffer change. The resultant protein mixture was filtered twice (0.45 μm and 0.20 μm) before loading onto a Q-Sepharose anion exchange column (Pharmacia) equilibrated with 25 mM Tris buffer (pH 8.0), 10 mM EDTA and 5 mM β-Me, and run with a linear salt gradient (0 – 1 M NaCl, protein elutes at ~ 0.5 M salt). Active fractions were confirmed by SDS PAGE analysis and pooled with protease inhibitor before desalting by dialysis against 25 mM Tris buffer (pH 8.0), 10 mM EDTA and 5 mM β-Me overnight with one buffer change. Protein was brought up to 1M ammonium sulfate (Sigma), filtered and loaded onto a Phenyl-Sepharose column equilibrated to 25 mM Tris buffer (pH 8.0), 10 mM EDTA, 5 mM β-Me and 1M ammonium sulfate, and run with a reverse ammonium sulfate linear gradient (protein elutes at ~ 0.8 M salt). Active fractions were pooled and dialyzed overnight into 20 mM HEPES buffer (pH 7.5), 150 mM NaCl and 5 mM β-Me, and concentrated using 10 kDa cutoff centricons (Millipore) for a typical yield of 60 mg/L.
Isothermal Titration Calorimetry
ITC measurements were performed to determine the binding affinity and stoichiometry between monomeric yeast frataxin, ferrous iron and/or Isu1. Experiments were performed anaerobically at 30 °C on a VP-ITC titration microcalorimeter (Micro Cal Inc.). ITC experiments were performed for Yfh1 + Fe, Yfh1 + Isu1 and holo-Yfh1 + Isu1, with an iron to frataxin stoichiometric ratio of 1:1. Holo-Yfh1 samples were prepared anaerobically under solution conditions that stabilize the protein as a monomer (20 mM HEPES (pH 7.5), 150 mM NaCl and 5 mM β-Me) in the same manner previously described (21); monomeric state was verified using size-exclusion chromatography (data not shown). Experiments contained 30 μM protein in the adiabatic cell and 500 μM titrant in the syringe. After an initial 2 μL injection, 29 additional injections of 10 μL were spaced out by 10 min each with constant stirring (500 rpm). All protein/metal buffers were matched by dialysis before loading into the ITC. Protein samples were extensively degassed and buffers were purged with Ar(g) before data collection to maintain and stabilize the ferrous iron. Spectra were collected on duplicate and triplicate independent sample sets. Data was fit and analyzed using the Origin 5.0 software package supplied by Micro Cal (GE life sciences), which uses a non-linear least squares curve fitting algorithm to determine the stoichiometric ratio, dissociation constant and change in enthalpy of the reaction.
Nuclear Magnetic Resonance Spectroscopy
15N labeled Yfh1 was isolated from E. coli transfected with the Yfh1 plasmid, grown in M9 minimal media supplemented with 15N NH4Cl at 37 °C for 4 hours after induction with 1mM IPTG and isolated as described above. 1H-15N TROSY-heteronuclear single quantum coherence (HSQC) data collected on a Varian INOVA 600 MHz spectrometer equipped with a triple resonance 1H/13C/15N Varian cold probe with z-axis pulsed field gradients (26). Titrations were performed in septa-sealed NMR tubes under anaerobic conditions following 2 independent buffer conditions: 1) 25 mM NaPO4 buffer (pH 7.5) with 2 mM DTT buffer, and 2) 20 mM HEPES buffer (pH 7.5), 150 mM NaCl and 5 mM β-Me. Protein concentrations were ca. 200 μM 15N-labelled Yfh1 after addition of one equivalent of ferrous iron and one equivalent of Isu1 dimer. Data were collected on apo-Yfh1, holo-Yfh1, apo-Yfh1 + Isu1 and the holo-Yfh1 + Isu1 complex samples. Protein samples were placed in the NMR spectrometer and allowed to equilibrate at 30 °C for 30 minutes prior to sample collection. Full 1H/15N TROSY-HSQC spectra were collected with a 1H sweep width of 7804 Hz, with 2048 points and 64 transients and at a 15N sweep width of 2500 Hz, 512 increments. Spectra were referenced using a DSS standard, transformed using NMRPipe (27) and peak positions were calculated using the program SPARKY (28). Normalized chemical shifts were calculated using the published peaks files following the equation: δ = 25((δHN)2 + (δN/5)2)0.5. Results presented in Figure 2B represent the average of both experiments. Residues that underwent significant chemical shift perturbations were identified using the program MOLMOL in Figure 2C on the apo-yeast frataxin solution structure (PDBID 2GA5).
Figure 2.

NMR chemical shift mapping of Yfh1 residues affected by Isu1 binding. A) 1H/15N HSQC spectra for Fe-Yfh1 in the presence (red) and absence (black) of unlabeled apo-Isu1. Reproducible Fe-Yfh1:Isu1 spectra were collected at a 2:1 iron to Yfh1 stoichiometric ratio and a 1:1 Yfh1:Isu1 ratio in phosphate buffer. Solid line boxed region is expanded in Figure 2A. B) Averaged normalized chemical shift changes for Fe-Isu1 with and without Isu1. The line represents the threshold value calculated based on the resolution of the data. C) Residues identified on the apo-frataxin structure have normalized chemical shift (d) values greater than 1 (colored red).
X-ray Absorption Spectroscopy
X-ray absorption spectroscopy was used to study the electronic properties and ligand coordination geometry of iron at different stages during Fe-S cluster assembly. All samples were prepared anaerobically within a glove box (PlasLabs) using protein and iron solutions that were initially degassed on a Schlenk line and stored under an Ar(g) atmosphere. XAS samples were prepared at ~ 0.5 mM final protein concentrations in 20 mM HEPES buffer (pH 7.0), 150 mM NaCl and 5mM β-Me. The individual samples prepared were the following: 1) Isu1 incubated with 0.95 equivalent of ferrous iron, 2) Yfh1 incubated with 0.95 equivalent of ferrous iron for 10 minutes at room temperature before addition of Isu1, 3) Isu1 incubated with 0.95 equivalent of ferrous iron for 10 minutes at room temperature before addition of 1 equivalent of Na2S, and finally, 4) Yfh1 incubated with 0.95 equivalent of iron for 10 minutes at room temperature before addition of Isu1 and 1 equivalent of Na2S. All samples were allowed to incubate for an additional 60 minutes in an Ar(g) atmosphere to ensure cluster and complex formation. Samples were diluted with 30% glycerol as a glassing agent, loaded into Lucite sample cells wrapped with Kapton tape, flash frozen in liquid nitrogen, removed from the glove box and stored in liquid nitrogen until data collection was performed.
XAS data were collected at the Stanford Synchrotron Radiation Laboratory (SSRL), beamlines 7-3 and 9-3, and at the National Synchrotron Light Source (NSLS), beamline X3-b. SSRL beamline 7-3 was equipped with a single rhodium-coated silicon mirror and a Si[220] double crystal monochromator, and harmonic rejection was achieved by detuning the monochromator 50%. SSRL beamline 9-3 was equipped with a Si[220] double crystal monochromator and a harmonic rejection mirror, so spectra were collected under fully tuned conditions. NSLS beamline X-3b used a Si[111] single crystal monochromator equipped with a nickel coated cylindrically bent mirror to achieve harmonic rejection and vertical focusing. Samples were maintained at 10 K using Oxford Instrument continuous-flow liquid helium cryostats at SSRL locations and at ca. 24 K using a He Displex Cryostat at NSLS. Protein fluorescence excitation spectra were collected using 30-element Ge solid-state array detectors at SSRL locations and a 13-element Ge solid-state detector at NSLS. XAS spectra were measured using 5 eV steps in the pre-edge regions (6900 – 7094), 0.25 eV steps in the edge regions (7095–7135 eV) and 0.05 Å−1 increments in the extended X-ray absorption fine structure (EXAFS) region (to k = 13.5 Å−1), integrating from 1 to 20 seconds in a k3 weighted manner for a total scan length of approximately 40 minutes. X-ray energies were calibrated by collecting an iron foil absorption spectrum simultaneously with collection of protein data. The first inflection point for the Fe foil edge was assigned at 7111.3 eV. Each fluorescence channel of each scan was examined for spectral anomalies prior to averaging and spectra were closely monitored for photoreduction. SSRL protein data represent the average of 5 to 6 scans, while NSLS protein data represent the average of 8 to 9 scans.
XAS data were processed using the Macintosh OS X version of the EXAFSPAK program suite(29) integrated with the Feff v7.2 software for theoretical model generation. XAS data reduction utilized a Gaussian function in the pre-edge region and a three-region cubic spline in the EXAFS region. EXAFS data were converted to k-space using an E0 value of 7130 eV. The k-cubed weighted EXAFS was truncated at 1.0 and 13.0 Å−1 for filtering purposes and Fourier transformed. The final fitting results listed in Table 3 are from averaged values obtained from simulations of raw unfiltered data. Edge inflection energies were calculated as the maximum of the 1st derivative of the XANES spectra. Analysis of the XANES 1s → 3d transitions was completed using the EDG_FIT subroutine within EXAFSPAK. Only spectra collected using the higher resolution Si[220] monochromator crystals were subjected to edge analysis. Pre- and post-edge splines were fit to the experimental spectra within the energy range of 7090 to 7100 eV and 7120 to 7125 eV, respectively. The extrapolated line was then subtracted from raw data to obtain baseline corrected spectra. Pre-edge features were modeled using pseudo-Voigt line shapes (simple sums of Lorentzian and Gaussian functions), and the energy position, the full width at half-maximum (FWHM) and the peak heights for each transition were varied. A fixed 50:50 ratio of Lorentzian to Gaussian functions successfully reproduced the spectral features of the pre-edge transitions. Global peak transition areas were determined for all spectra over the energy range of 7109 to 7117 eV using the program Kaleidagraph. Pre-edge intensity values were calibrated by multiplying values by 100.
Table 3.
Summary of the best fit EXAFS simulation analysis for iron at multiple stages during Fe-S cluster assembly. Values reported are the average of at least two independent data sets.
| Sample | Fe-Nearest Neighbor Ligands a | Fe-Long Range Ligands a | F′ f | ||||||
|---|---|---|---|---|---|---|---|---|---|
| Atom b | R(Å) c | C.N. d | σ2e | Atom b | R(Å) c | C.N. d | σ2e | ||
| Fe-Yfh1g | O/N | 2.12 | 5.0 | 5.80 | C | 3.07 | 2.0 | 4.30 | 0.98 |
| C | 3.30 | 1.5 | 4.41 | ||||||
| Fe-Isu1 | O/N | 2.01 | 1.0 | 1.91 | C | 3.01 | 1.5 | 1.14 | 0.99 |
| O/N | 2.14 | 4.5 | 3.25 | ||||||
| Fe-Isu1 + S | O/N | 2.11 | 2.5 | 5.05 | Fe | 2.69 | 0.5 | 1.70 | 0.69 |
| S | 2.26 | 1.0 | 2.45 | ||||||
| Fe-Yfh1 + Isu1 | O/N | 1.99 | 2.0 | 5.40 | C | 3.07 | 2.5 | 5.58 | 0.32 |
| O/N | 2.15 | 1.5 | 1.50 | C | 3.51 | 2.0 | 1.91 | ||
| C | 4.09 | 1.5 | 1.80 | ||||||
| Fe-Yfh1 + Isu1 + S | O/N | 2.04 | 1.5 | 4.20 | Fe | 2.70 | 0.5 | 1.20 | 0.46 |
| S | 2.28 | 1.0 | 1.88 | ||||||
Independent metal-ligand scattering environment
Scattering atoms: O (Oxygen), N (Nitrogen), C (Carbon), S (Sulfur) and Fe (Iron)
Metal-ligand bond length
Metal-ligand coordination number
Debye-Waller factor given in Å2 × 10³
Number of degrees of freedom weighted mean square deviation between data and fit
EXAFS data fitting analysis performed on both Fourier filtered and raw/unfiltered data gave equivalent structural results. Model and protein EXAFS data were fit using both single and multiple scattering amplitude and phase functions calculated using Feff v7.2. Single scattering Feff v7.2 models were calculated for carbon, oxygen, sulfur and iron coordination to simulate possible iron-ligand environments in our systems (21). Fits to crystallographically characterized model compounds were used to calibrate the scale factor and ΔE0 values. A calibrated scale factor (Sc) of 0.95 and a threshold shift (ΔE0) of −11.5 eV were used during protein data analysis and Sc and E0 were not allowed to vary during the fitting analysis. Simulation protocols and criteria for judging the best fit were outlined previously (30).
Fluorescence Spectroscopy
Fluorescence spectroscopy was used to identify structural changes in Isu1 that occur resulting from the binding of substrate or following cluster production. The fluorescent dye 1,8-Anilinonaphthalenesulfonate (ANS), which selectively binds to solvent exposed hydrophobic regions found in molten globule proteins, is an effective tool to help observe overall changes in the molten globule nature of Isu1 at different states during cluster assembly (31). ANS studies were performed using a 3 mL fluorescence cuvette (Starna) equipped with septa, a 50 μM Isu1 solution, in 20 mM HEPES buffer (pH = 7.5), 150 mM NaCl and 5 mM β-Me. Samples and solutions were degassed on a Schlenk line and stored under Ar(g). Independent samples were prepared by incubating the Isu1 dimer ± 2 equivalents of ferrous iron and/or sulfide. Single time point fluorescence measurements were made for protein samples incubated for 10 minutes before addition of 10 μM ANS followed by a second 10 min incubation before data collection (λexcite = 371 nm, λemission = 490 nm) on a QuantaMaster fluorimeter (PTI). Data was collected at 1 nm intervals with 0.5 second integration times and 5 mm slit widths. Data was collected in duplicate and spectra shown in Figure 5 represents a single smoothed spectrum using a window function of 5 data points. Titration of ANS into Isu1 alone was performed to measure the number of moles of ANS that binds to Isu1 (Bmax) and the binding affinity was obtained through Scatchard analysis of the variation of bound ANS to the protein concentration (32).
Figure 5.

Characterization of Isu1 fold using fluorescence spectroscopy. (A) Molten globule nature of Isu1 by fluorescence spectroscopy. Fluorescence of ANS bound to Isu1 alone (thin-solid line), Isu1 incubated with Fe(II) (thin dashed line), Isu1 incubated with S2− (thin-dotted line) and Isu1 incubated with Fe(II) and then S2− (bold-solid line). (B) Fluorescence titration of Isu1 with ANS monitored at 476 nm. (B, Inset) Scatchard analysis for the binding of ANS to Isu1.
RESULTS
Isothermal Titration Calorimetry
ITC was used to probe the thermodynamic characteristics of the interaction between iron, Yfh1 and Isu1. Our laboratory previously showed monomeric Yfh1 binds 2 ferrous iron atoms with μM binding affinity when mM concentrations of MgSO4 were present in the solution buffer (21). In this current report, we measured the Fe(II) binding affinity and stoichiometry to Yfh1 under solution conditions that stabilize Isu1 (20 mM HEPES (pH 7.5), 150 mM NaCl and 5 mM β–Me) again using ITC. All data were collected anaerobically in the presence of salt and in duplicate using independently prepared protein samples to promote ferrous iron stability, prevent protein aggregation and to test sample reproducibility. Yfh1 exhibited a strong single exothermic binding interaction when binding 2 iron atoms (Figure 1A), similar to what was observed in our published MgSO4 salt study. Data were best fit using a two independent-site substrate binding model with corresponding KD values of one Fe(II) atom at 113 ± 2 nM and one Fe(II) atom at 1.64 ± 1.68 μM (Table 1). These affinities are similar but tighter than the average of 3 μM binding affinities observed for the two bound iron atoms in our previous study.
Figure 1.

Raw isothermal titration calorimetry data (top) and binding isotherm data (bottom) of: A) Fe(II) titration into Yfh1, B) Fe(II) titrated into Isu1, C) Yfh1 titrated into Isu1, D) Fe-Yfh1 titrated into Isu1. A grey line in each bottom panel shows the simulated fit to the binding isotherm data.
Table 1.
Average simulation results for ITC analysis. Averaged values of stoichiometry versus Isu1 monomer (N1 and N2) and dissociation constant (KD1 and KD2) are given with error bars.
| Sample | N1 | KD1 | N2 | KD2 |
|---|---|---|---|---|
| Fe-Yfh1 | 1.08 ± 0.30 | 1.64 ± 1.68 μM | 1.02 ± 0.38 | 113 ± 2 nM |
| Fe-Isu1 | 1.19 ± 0.66 | 234 ± 35 nM | 0.97 ± 0.31 | 6 ± 4 nM |
| Yfh1+Isu1 | -- | -- | -- | -- |
| Fe-Yfh1 + Isu1 | 1.67 ± 0.28 | 166 ± 112 nM | 0.52 ± 0.14 | 5 ± 3 nM |
ITC was used to measure energy and stoichiometry of iron ± Yfh1 binding to apo-Isu1. Aqueous ferrous iron titrated into Isu1 yields a single exothermic binding event (Figure 1B). Heat released data were best simulated using a two independent substrate binding site model with both iron atoms binding at nanomolar affinity (KD1 = 234 ± 35 nM and KD2 = 6 ± 4 nM) per Isu1 monomer (Table 1). Titrations of apo-Yfh1 into apo-Isu1 showed no appreciable heat absorbed or released indicating a lack of a binding event in the absence of added iron (Figure 1C). However, titration of holo-Yfh1 into Isu1 yielded a strong biphasic exothermic binding event with saturation occurring at approximately 2 equivalents of holo-Yfh1 monomer (with 1 Fe bound) per each Isu1 monomer in the Isu1 protein dimer (Figure 1D). Binding occurred at nanomolar affinities (KD1 = 166 ± 112 nM and KD2 = 5 ± 3 nM).
Nuclear Magnetic Resonance Spectroscopy
NMR spectroscopy was used to identify which Yfh1 amino acids reside at the Isu1 binding interface. 15N-1H HSQC-TROSY data was collected on apo-Yfh1, holo-Yfh1, apo-Yfh1 + apo-Isu1, and holo-Yfh1 + apo-Isu1. Data was collected under two different buffer conditions: 1) 25 mM NaPO4 (pH 7.5) with 2 mM DTT buffer; and 2) 20 mM HEPES (pH 7.5), 150 mM NaCl and 5 mM β-Me buffer. During the iron titrations, specific Yfh1 amide resonances were observed to change upon addition of iron, as previously reported (21, 22). Titrations under both solution conditions yielded similar results except that data collected in phosphate buffer did not show the amide resonance line broadening effects in the presence of the paramagnetic metal that were observed in the HEPES buffer titration (21). Upon further addition of unlabeled apo-Isu1 into labeled holo-Yfh1 (Figure 2A), an additional set of amide resonances underwent a chemical shift perturbation indicating selective changes in the frataxin amino acid chemical environments caused by Isu1 binding. Normalized chemical shift changes were calculated under both solution conditions and the averaged normalized chemical shift changes are given in Figure 2B. Only residues with normalized chemical shift changes above the calculated spectral resolution of our data are highlighted in red on the apo-Yfh1 solution structure (Figure 2C). Specific Yfh1 residues affected by the addition of Isu1 comprise portions of both Yfh1 iron-binding sites identified (21, 22) in addition to a major portion of the β-sheet surface of frataxin. Specific residues perturbed by the addition of unlabeled Isu1 into labeled holo-Yfh1 include: H83, D86, L91, E93, A94, H95 (broadly the Yfh1 helix 1 Fe-binding region); V102, E103 (the Yfh1 strand 1 Fe-binding region); L104, S105, G107, T110, L111, Y119, V120, Q124, N127 (on the Yfh1 β-sheet surface); and N154, V166, and I170 (on the Yfh1 strand 6-loop and helix 2 region).
X-ray Absorption Spectroscopy
XANES analysis of the XAS spectra for metal bound to Yfh1 ± Isu1 ± S2− were examined to characterize the electronic and structural properties of bound iron at different stages of cluster assembly. Complete XAS spectra were collected on multiple independent versions of the following samples: A) Fe(II) + apo-Yfh1, B) Fe(II) + apo-Isu1, C) Fe(II) + S2− + apo-Isu1, D) Fe-Yfh1 + Isu1 and E) Fe-Yfh1 + S2− + apo-Isu1. XANES spectra of all samples show similar edge features (Figure 3) and the analysis of the first derivative of the edge inflection energies show values consistent with the bulk iron being stable in the ferrous form (Table 2). Pre-edge 1s→3d electronic features (i.e., pre-edge energy and absorption area) in the XANES spectra (Figure 3, inset) are consistent with iron, in the samples without sulfide, being six coordinate high-spin Fe(II) with a small shift from octahedral metal-ligand bond symmetry as the samples go from Fe-Yfh1, Fe-Isu1, Fe-Yfh1-Isu1. In samples containing sulfide, 1s→3d pre-edge transition energies and areas are consistent with a significant portion of the metal being held in a tetrahedral Fe(II)-ligand coordination environment (33).
Figure 3.

Iron XANES spectra A) Fe-Yfh1, B) Fe-Isu1, C) Fe-Isu1 + S2−, D) Fe-Yfh1 + Isu1 and E) Fe-Yfh1 + S2− + Isu1. Individual spectra were equally offset for clarity. Inset: Expansion of the individual 1s→3d transition peaks in the same order as listed in the full figure.
Table 2.
Analysis of pre-edge and edge features from XANES spectra given in Figure 4. Pre-edge transition energies and areas determined using EDG_FIT software. Edge inflection energies quantified as maximum value of calculated first derivative of the XAS edge feature.
| Sample | Pre-Edge Peak Energy (eV) | Total Pre-Edge Area | Edge Inflection Energy (eV) |
|---|---|---|---|
| Fe-Yfh1 | 7111.27 ± 0.02‡ 7112.28 ± 0.03‡ 7113.38 ± 0.02‡ |
5.5 ± 0.7‡ | 7122.4 ± 0.1‡ |
| Fe-Isu1 | 7111.90 ± 0.14 7113.80 ± 0.28 |
8.8 ± 0.3 | 7123.1 ± 0.2 |
| Fe-Isu1 + S | 7112.63 ± 0.18 | 22.3 ± 10.0 | 7123.5 ± 0.2 |
| Fe-Yfh1 + Isu1 | 7111.70 ± 0.28 7113.68 ± 0.11 |
10.6 ± 3.0 | 7123.0 ± 0.3 |
| Fe-Yfh1 + S + Isu1 | 7112.90 ± 0.28 | 16.2 ± 0.9 | 7123.0 ± 0.7 |
| Fe(II) (aq) | 7111.18 ± 0.07* 7112.03 ± 0.15* 7113.58 ± 0.03* |
3.9 ± 0.3* | 7122.9 ± 0.1‡ |
Metrical parameters regarding iron-ligand identity, iron coordination number and metal-ligand bond lengths were determined by analysis of the EXAFS portion of the XAS data for the samples listed above. We previously showed iron bound to Yfh1 (Figure 4A, B) is 6 coordinate in a highly symmetric oxygen/nitrogen (O/N) ligand coordination environment, with an average bond length of 2.12 Å (Table 3). Ferrous iron bound to Isu1 (Figure 4C, D) has two unique nearest neighbor ligand coordination environments, both O/N based with ca. 1 O/N ligand at 2.01 Å and ca. 5 O/N ligands centered at 2.14 Å. Interestingly, metal bound to Isu1 alone does not occur via cysteine sulfur ligands, as there is no evidence for sulfur ligation. Long-range scattering in both samples were best fit with carbon scattering at distances ranging from 3.00 to 3.30 Å. Iron, in the Yfh1-Isu1 complex, shows nearest neighbor ligand coordination distinct from either Fe-Yfh1 or Fe-Isu1 alone or as a linear combination of both. The nearest neighbor ligand coordination in the Fe-Yfh1-Isu1 sample (Figure 4G, H) is made up of two independent environments centered at 1.99 Å and 2.15 Å; these average bond lengths are consistent with 6 coordinate Fe(II)-(O/N) model compounds. While the coordination numbers are similar in both environments (C.N. = 2 and 1.5, respectively), the large Debye-Waller factor in the 1.99 Å environment is consistent with significant disorder in this ligand environment producing an abnormally low coordination number for this set of ligands. Long-range scattering in this sample is consistent with multiple carbon based ligands centered at 3.07 Å, 3.51 Å and 4.09 Å.
Figure 4.

EXAFS and Fourier transforms of EXAFS data for iron at different stages of Fe-S cluster assembly. Raw EXAFS data in black for: A) Fe-Yfh1, C) Fe-Isu1, E) Fe-Isu1 + S2−, G) Fe-Yfh1 + Isu1 and I) Fe-Yfh1 + S2− + Isu1. Corresponding Fourier transform plots of raw EXAFS data in black for: B) Fe-Yfh1, D) Fe-Isu1, F) Fe-Isu1 + S2−, H) Fe-Yfh1 + Isu1 and J) Fe-Yfh1 + S2− + Isu1.
Inclusion of sulfur to the above samples causes a significant change in the Fe coordination environment. Sulfur added to Isu1 with iron bound (Figure 4E, F) alters the iron nearest neighbor coordination environment so that it includes both O/N and S scattering. The best-fit spectral simulation for the iron coordination includes 2.5 O/N ligands at 2.11 Å, a single sulfur atom at 2.26 Å and a distinct Fe•••Fe interaction at 2.69 Å; bond lengths consistent with a portion of the iron (< 50%) being coordinated in a Fe-S cluster (34). Addition of sulfur to the Fe-Yfh1-Isu1 complex (Figure 4I, J) shifts the nearest neighbor metal-ligand environment to 1.5 O/N ligands centered at 2.04 Å, 1 S atom at 2.28 Å and a distinct Fe•••Fe interaction at 2.70 Å, again consistent with a portion of the metal (< 50%) being coordinated in a Fe-S cluster. No long-range carbon scattering in the range of R > 3.0 Å was detected in either sulfur-containing sample.
Fluorescence Spectroscopy
Fluorescence spectroscopy was used to characterize Isu1 structural changes coupled to iron or sulfide binding, or following Fe-S cluster formation. Binding of the fluorescent probe ANS is often used to characterize the globular nature of biomolecules, since ANS selectively binds to solvent exposed hydrophobic regions in molten globule proteins. Binding induces a fluorescence signal in the vicinity of 500 nm (λexcite = 371nm), whereas well-folded proteins bind little dye and exhibit little fluorescence. Apo-Isu1 exposed to ANS exhibits a large fluorescence signal centered at 480 nm (Figure 5A, light solid line). At these concentrations, ANS in buffer by itself had negligible fluorescence (control not shown). Reverse titration analysis of ANS into Isu1 indicated a maximum concentration of ligand bound to Isu1 (Bmax) of 34.44 ± 0.49 μM. The dissociation constant (KD) for the dissociation of ANS to Isu1, obtained from Scatchard analysis, was 7.73 μM ± 0.31. The linear nature of the bound/free vs. free ANS from the Scatchard analysis (Figure 5B; inset) indicates a single ANS binding site on the protein.
The effect of structural changes on Isu1 coupled with Fe(II) or S2− binding was also tested by fluorescence spectroscopy. Addition of either ferrous iron (Figure 5A, long dashed line) or sulfide (Figure 5A, short dashed line) to the Isu1/ANS mixture exhibits only subtle changes in fluorescence intensity, although the fluorescence maximum was red-shifted to 490 nm in both cases, indicating an increase in polarity of the ANS binding environment coupled with substrate binding (35). Interestingly, incubation of both ferrous iron and sulfide to Isu1 prior to dye addition results in a substantial decrease of signal intensity (Figure 5A, bold solid line), suggesting a reduction in ANS accessibility to Isu1 (or an increase in Isu1 fold) coupled to the formation of a complete Fe-S cluster.
DISCUSSION
Mounting evidence suggests that de novo Fe-S cluster assembly within the ISC pathway occurs via formation of a multiprotein complex consisting of the cysteine desulfurase, the assembly scaffold, frataxin and, in eukaryotes, the accessory protein Isd11(4, 36). Here we provide molecular details of the frataxin interaction with the scaffold protein, one event in multiprotein complex formation. In yeast, a direct interaction between Yfh1 and Isu1 is well documented, confirming that binding can occur separately from multiprotein complex formation and suggesting that contact between these two partner partners may drive mutiprotein complex formation. Frataxin also interacts separately with the cysteine desulfurase and with Isd11, and so future investigation of these interactions distinct from multiprotein complex formation is also certainly justified. Our goal is to dissect each protein-protein interaction separately, starting with the frataxin-scaffold protein interaction, and then building towards a global understanding of structural changes that occur during multiprotein complex formation. Key differences between the prokaryotic and eukaryotic systems (for example the presence of Isd11 in eukaryotes) indicate interactions between protein orthologs may be partially unique for the system under investigation, so clarification of these interactions within the yeast system may help explain key differences in the function of frataxin between different species (i.e. iron delivery or storage vs. pathway regulation). In addition, this report follows the structural path of iron delivery to Isu1 during multiple stages of Fe-S cluster assembly. In summary, we provide in this report the structural and thermodynamic details essential for understanding Fe-S cluster assembly at a molecular level, short of having the complete multiprotein complex structure.
Our NMR mapping results indicate that Yfh1 binds to Isu1 utilizing the frataxin α1/β1 acidic ridge and a large section of the β-sheet surface of the protein. Included in this binding region are the two Yfh1 iron binding sites previously identified by NMR (21). Overlap of these Yfh1 iron binding sites with the Isu1 interaction interface would be consistent with an iron delivery function for frataxin. The Yfh1 surface shown here to bind to Isu1 includes key residues shown to be essential for Fe-S cluster assembly. Others have shown substitution of conserved acidic residues (D86, E89 on α1 or D101, E103 on β1) by lysine impairs Fe–S cluster assembly, weakens the interaction between Yfh1 and Isu1, and increases oxidative damage in the cell (37). Mutations of residues in the third β-strand region (either N122 itself or as a N122, K123, Q124 triple mutant) or at positions Q129, W131 (β4) and R141 (β5) also show severe functional defects and decreased affinity of Yfh1 for Isu1 (8, 13). Frataxin’s α1/β1 acidic ridge has also been shown to participate in the bacterial frataxin binding surface for the cysteine desulfurase (14), so it seems possible that the cysteine desulfurase and scaffold bind contiguously to this region of frataxin.
Binding between Yfh1 and Isu1 is selective by nature (8, 13, 38, 39). Yfh1 or Isu1 individually bind iron, but with different affinities, suggesting that energetic factors could be key determinants in the selective delivery of iron from Yfh1 to Isu1 if frataxin is serving as an iron chaperone. Binding affinities for iron to the different frataxin orthologs all occur in the micromolar range (see review (7)) where as binding affinities for iron to the different scaffold protein orthologs are generally sub-micromolar (16). Binding between Yfh1 and Isu1 is also iron dependent. Interestingly, while Yfh1 binds 2 iron atoms, the binding site on Yfh1 is weaker than the tighter binding measured between holo-Yfh1 and Isu1. The presence of Nfs1 and Isd11 will surely alter these binding affinities, and experiments directed at measuring these additional binding interactions are currently underway. However, our results indicate that it would be energetically favorable for holo-Yfh1 and apo-Isu1 to interact in the presence of iron. This protein-protein binding would then allow metal transfer to Isu1, and following removal of metal from frataxin would cause Yfh1 release from Isu1.
Snapshots of the structural and electronic details of iron during the different stages in the Yfh1-Isu1 interaction provide insights into how metal is utilized during cluster assembly. Our data highlight, in the absence of sulfide, that iron exists in at least three stages, starting with its binding to Yfh1, then in the Yfh1-Isu1 complex, and ending with its binding to Isu1 alone. In all three states, iron is stable as high-spin six coordinate Fe(II) coordinated by only oxygen or nitrogen based ligands. Analysis of the metrical details of the metal-ligand structure indicate that the coordination environment of Fe(II) bound to Isu1 is distinct from Fe(II) on Yfh1 alone or in the Yfh1-Isu1 complex, suggesting that metal bounding to Isu1 alone is the end point following delivery. Surprisingly, there is no evidence for sulfur ligation of iron bound to Isu1. Our data therefore suggest that when Isu1 initially binds iron, the protein utilizes a site distinct from the cysteine rich assembly site.
Introduction of sulfide to iron bound to Isu1 (either in complex with Yfh1 or alone) induces the formation of a multinuclear Fe species structurally consistent with a 2Fe-2S cluster. Shifts in the pre-edge feature and edge energy are consistent with a percentage of the iron (at a 50% lower limit) being shifted to a 4 coordinate sulfur containing structure. Metrical parameters for Isu1 bound iron in this Fe-S structure indicate two iron atoms occur at ca. 2.7 Å, consistent with the formation of an authentic 2Fe-2S cluster (34). In addition, these results are consistent with our recent spectroscopic characterization of the formation of a Fe-S cluster based on the 435 nm chromophore seen in the UV-vis assembly assay for Isu1 in the presence of both Fe and S (15).
The global fold of Isu1 becomes more defined as a result of Fe-S cluster formation. Structures of multiple IscU orthologs exhibit shared features including the presence of an α + β core (40–44). In many cases, homogeneity in structure and the extent of the ortholog’s fold is influenced by the presence of metal. ANS binding fluorescence was used to determine the molten globular nature of the T. maritima IscU in solution (45). Our data indicate binding of Fe2+ or S2− alone by Isu1 has only a minimal affect on the protein’s fold, although a red-shift seen in fluorescence is consistent with substrates influencing an increase in the molecule’s global environmental polarity (35). Concurrent with or following Fe-S cluster formation, the Isu1 structure shifts to an increased fold with a hydrophobic core that better excludes solvent. This increase in fold is consistent with the well-folded A. aeolicus IscU structure that was determined with a Fe-S cluster bound (46). It should be noted, our experiments were performed on the D37A Isu1 mutant to ensure retention of the bound Fe-S cluster; this mutant was selected so we could study Isu1 with an intact cluster. In the D37A Isu1 mutant, in the absence of the conserved aspartic acid, a conserved histidine preceding the most C-terminal cysteine is believed to supply the fourth ligand to the cluster (47) thereby locking the cluster in place. While there are certainly structural differences resulting from this mutation, we expect that the changes will be local relative to the overall protein fold since these residues are in a surface exposed location. We would further expect that the wild type Isu1 protein would release the cluster intermediate as part of a later step in Fe-S cluster assembly, subsequently returning to its initial flexible state. The increased flexibility obtained upon cofactor release would likely help prime Isu1 for the next round of cluster assembly.
Mounting evidence suggests that yeast mitochondrial Fe-S cluster assembly requires interactions between proteins forming a whole or subset of a Nfs1/Isd11/Isu1/Yfh1 multiprotein complex. Insight into the structure of this complex can be gained from studies of orthologous protein interactions. Structural details for the bacterial IscS/IscU complex have recently emerged, providing direct insight into how cysteine desulfurase and the scaffold interact (44). In the structure, IscU binds to the C-terminal region of IscS in close proximity to the cysteine desulfurase critical active site cysteine (Cys328). In the process, bound IscU projects its three conserved cysteine active site residues toward the IscS loop that carries Cys328. Interestingly, binding of IscU to IscS induces an increase in the fold of the N-terminal region of the scaffold protein. Mutagenesis studies of bacterial frataxin (CyaY) binding to IscS showed frataxin interacting with the cysteine desulfurase in a region in close proximity but distinct from Cys328; binding of CyaY did not disrupt sulfur transfer from IscS to IscU. NMR chemical shift mapping studies showed CyaY interacting with IscS through multiple residues on frataxin’s acidic (helix-1/strand-1) acidic ridge (14). Combined, these studies provide structural details for how IscU and IscS interact, and for how IscS and CyaY interact. However, molecular details regarding frataxin’s interaction with the scaffold protein remain ambiguous.
Our results, when combined with the above listed structural details, allow us to propose a structural model for how Yfh1 interacts with Isu1 during the initial stages of Fe-S cluster assembly. A large portion of frataxin’s β-sheet surface, along with the N-terminal helix, form the interface with Isu1, and this interaction is iron dependent. This Isu1 interacting surface of frataxin encompasses the two Yfh1 iron binding sites. When utilized, this would position Yfh1 for iron delivery or for assisting in stabilization of the intermolecular interface. An interaction with the cysteine desulfurase residues in one of the Nfs1 monomers that participate in CyaY binding would position frataxin so it could interact with the second cysteine desulfurase monomer in the dimer; this would occur in close proximity to the scaffold protein binding site (44). By modeling the Isu1 and Nfs1 structures from the bacterial orthologs, we developed a model for how these three proteins could come together to perform cluster assembly (Figure 6). In our model, Yfh1 could bind to Isu1 and also possibly to Nfs1 in the active site regions using residues identified above to be involved in protein-protein interactions with only minimal distortion of the Isu1/Nfs1 protein complex structure (red residues in Figure 6). In our model, frataxin binding would require subtle movement of the Nfs1 dimer/Isu1 orientation, and this movement has already been proposed to bring cysteine desulfurase and the scaffold protein together (44)). Structural details for frataxin’s interaction with Isd11 are currently under investigation and while not included in detail in our model, the accessory protein could modify the movement of Isu1/Nfs1 relative to frataxin’s position by also binding in this region. Sulfur delivery for Fe-S cluster assembly may occur coordinately with these protein interactions. In our model, iron is delivered to Isu1 using surface exposed residues amenable for both frataxin binding and close to the Fe-S cluster assembly site. Following iron delivery, frataxin would dissociate from the multiprotein complex prompting Isu1 to complete Fe-S cluster assembly. Structural and biochemical experiments are currently under way to test this model and to further characterize the individual interaction of frataxin with each additional binding partner.
Figure 6.
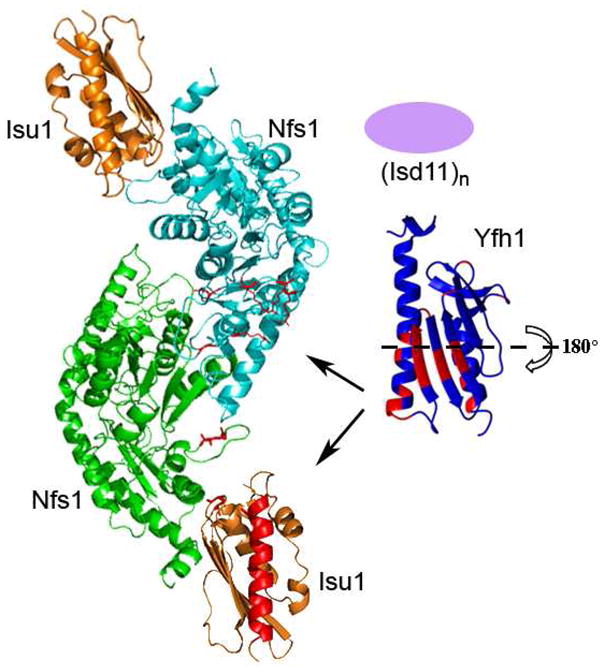
Model for the formation of the multiprotein complex required for Fe-S cluster assembly in the ISU pathway. The Isu1 and Nfs1 structures are modeled based on the bacterial IscS/U structure (PDB code 3LVL). Residues identified in red on Nfs1 were identified as being essential to the binding of frataxin (14, 44). Frataxin’s Isu1 binding surface is displayed but the protein must undergo a 180° horizontal axis rotation to fit in the binding pocket. Finally, while Isd11 is essential for in vivo Fe-S cluster assembly, structural details for the protein are lacking so the protein is shown as only an oval.
Acknowledgments
Portions of this research were carried out at both the Stanford Synchrotron Radiation Laboratory (SSRL) and at the National Synchrotron Light Source (NSLS). SSRL is a national user facility operated by Stanford University on behalf of the U.S. Department of Energy, Office of Basic Energy Sciences. The SSRL Structural Molecular Biology Program is supported by the Department of Energy, Office of Biological and Environmental Research, and by the NIH, National Center for Research Resources, Biomedical Technology Program. NSLS, located at Brookhaven National Laboratory, is supported by the U.S. Department of Energy, Division of Materials Sciences and Division of Chemical Sciences, under Contract No. DE-AC02-98CH10886.
Abbreviations
- NMR
Nuclear Magnetic Resonance
- XAS
X-ray absorption spectroscopy
- XANES
X-ray absorption near edge structure
- EXAFS
Extended X-ray absorption fine structure
- ITC
Isothermal titration calorimetry
- ANS
1,8-Anilinonaphthalenesulfonate
Footnotes
This work was supported by the American Heart Association for K.C.K. (0610139Z) and by the National Institutes of Health for A.D. (DK53953) and T.L.S. (DK068139).
References
- 1.Beinert H, Holm RH, Munck E. Iron-sulfur clusters: nature’s modular, multipurpose structures. Science. 1997;277:653–659. doi: 10.1126/science.277.5326.653. [DOI] [PubMed] [Google Scholar]
- 2.Johnson DC, Dean DR, Smith AD, Johnson MK. Structure, function, and formation of biological iron-sulfur clusters. Annu Rev Biochem. 2005;74:247–281. doi: 10.1146/annurev.biochem.74.082803.133518. [DOI] [PubMed] [Google Scholar]
- 3.Fontecave M, Ollagnier-de-Choudens S. Iron-sulfur cluster biosynthesis in bacteria: Mechanisms of cluster assembly and transfer. Arch Biochem Biophys. 2008;474:226–237. doi: 10.1016/j.abb.2007.12.014. [DOI] [PubMed] [Google Scholar]
- 4.Lill R. Function and biogenesis of iron-sulphur proteins. Nature. 2009;460:831–838. doi: 10.1038/nature08301. [DOI] [PubMed] [Google Scholar]
- 5.Gerber J, Muhlenhoff U, Lill R. An interaction between frataxin and Isu1/Nfs1 that is crucial for Fe/S cluster synthesis on Isu1. EMBO Rep. 2003;4:906–911. doi: 10.1038/sj.embor.embor918. [DOI] [PMC free article] [PubMed] [Google Scholar]
- 6.Layer G, Ollagnier-de Choudens S, Sanakis Y, Fontecave M. Iron-sulfur cluster biosynthesis: characterization of Escherichia coli CYaY as an iron donor for the assembly of [2Fe-2S] clusters in the scaffold IscU. The Journal of biological chemistry. 2006;281:16256–16263. doi: 10.1074/jbc.M513569200. [DOI] [PubMed] [Google Scholar]
- 7.Bencze KZ, Kondapalli KC, Cook JD, McMahon S, Millan-Pacheco C, Pastor N, Stemmler TL. The structure and function of frataxin. Crit Rev Biochem Mol Biol. 2006;41:269–291. doi: 10.1080/10409230600846058. [DOI] [PMC free article] [PubMed] [Google Scholar]
- 8.Wang T, Craig EA. Binding of yeast frataxin to the scaffold for Fe-S cluster biogenesis, Isu. The Journal of biological chemistry. 2008;283:12674–12679. doi: 10.1074/jbc.M800399200. [DOI] [PMC free article] [PubMed] [Google Scholar]
- 9.Campuzano V, Montermini L, Molto MD, Pianese L, Cossee M, Cavalcanti F, Monros E, Rodius F, Duclos F, Monticelli A, Zara F, Canizares J, Koutnikova H, Bidichandani SI, Gellera C, Brice A, Trouillas P, De Michele G, Filla A, De Frutos R, Palau F, Patel PI, Di Donato S, Mandel JL, Cocozza S, Koenig M, Pandolfo M. Friedreich’s ataxia: autosomal recessive disease caused by an intronic GAA triplet repeat expansion. Science. 1996;271:1423–1427. doi: 10.1126/science.271.5254.1423. [DOI] [PubMed] [Google Scholar]
- 10.Babcock M, de Silva D, Oaks R, Davis-Kaplan S, Jiralerspong S, Montermini L, Pandolfo M, Kaplan J. Regulation of mitochondrial iron accumulation by Yfh1p, a putative homolog of frataxin. Science. 1997;276:1709–1712. doi: 10.1126/science.276.5319.1709. [DOI] [PubMed] [Google Scholar]
- 11.Rotig A, de Lonlay P, Chretien D, Foury F, Koenig M, Sidi D, Munnich A, Rustin P. Aconitase and mitochondrial iron-sulphur protein deficiency in Friedreich ataxia. Nat Genet. 1997;17:215–217. doi: 10.1038/ng1097-215. [DOI] [PubMed] [Google Scholar]
- 12.Huang ML, Becker EM, Whitnall M, Rahmanto YS, Ponka P, Richardson DR. Elucidation of the mechanism of mitochondrial iron loading in Friedreich’s ataxia by analysis of a mouse mutant. Proceedings of the National Academy of Sciences of the United States of America. 2009;106:16381–16386. doi: 10.1073/pnas.0906784106. [DOI] [PMC free article] [PubMed] [Google Scholar]
- 13.Leidgens S, De Smet S, Foury F. Frataxin interacts with Isu1 through a conserved tryptophan in its beta-sheet. Hum Mol Genet. 2010;19:276–286. doi: 10.1093/hmg/ddp495. [DOI] [PubMed] [Google Scholar]
- 14.Adinolfi S, Iannuzzi C, Prischi F, Pastore C, Iametti S, Martin SR, Bonomi F, Pastore A. Bacterial frataxin CyaY is the gatekeeper of iron-sulfur cluster formation catalyzed by IscS. Nat Struct Mol Biol. 2009;16:390–396. doi: 10.1038/nsmb.1579. [DOI] [PubMed] [Google Scholar]
- 15.Kondapalli KC, Kok NM, Dancis A, Stemmler TL. Drosophila frataxin: an iron chaperone during cellular Fe-S cluster bioassembly. Biochemistry. 2008;47:6917–6927. doi: 10.1021/bi800366d. [DOI] [PMC free article] [PubMed] [Google Scholar]
- 16.Yoon T, Cowan JA. Iron-sulfur cluster biosynthesis. Characterization of frataxin as an iron donor for assembly of [2Fe-2S] clusters in ISU-type proteins. J Am Chem Soc. 2003;125:6078–6084. doi: 10.1021/ja027967i. [DOI] [PubMed] [Google Scholar]
- 17.Adamec J, Rusnak F, Owen WG, Naylor S, Benson LM, Gacy AM, Isaya G. Iron-dependent self-assembly of recombinant yeast frataxin: implications for Friedreich ataxia. Am J Hum Genet. 2000;67:549–562. doi: 10.1086/303056. [DOI] [PMC free article] [PubMed] [Google Scholar]
- 18.Gakh O, Adamec J, Gacy AM, Twesten RD, Owen WG, Isaya G. Physical evidence that yeast frataxin is an iron storage protein. Biochemistry. 2002;41:6798–6804. doi: 10.1021/bi025566+. [DOI] [PubMed] [Google Scholar]
- 19.Aloria K, Schilke B, Andrew A, Craig EA. Iron-induced oligomerization of yeast frataxin homologue Yfh1 is dispensable in vivo. EMBO Rep. 2004;5:1096–1101. doi: 10.1038/sj.embor.7400272. [DOI] [PMC free article] [PubMed] [Google Scholar]
- 20.Bou-Abdallah F, Adinolfi S, Pastore A, Laue TM, Dennis Chasteen N. Iron binding and oxidation kinetics in frataxin CyaY of Escherichia coli. J Mol Biol. 2004;341:605–615. doi: 10.1016/j.jmb.2004.05.072. [DOI] [PubMed] [Google Scholar]
- 21.Cook JD, Bencze KZ, Jankovic AD, Crater AK, Busch CN, Bradley PB, Stemmler AJ, Spaller MR, Stemmler TL. Monomeric yeast frataxin is an iron-binding protein. Biochemistry. 2006;45:7767–7777. doi: 10.1021/bi060424r. [DOI] [PMC free article] [PubMed] [Google Scholar]
- 22.He Y, Alam SL, Proteasa SV, Zhang Y, Lesuisse E, Dancis A, Stemmler TL. Yeast frataxin solution structure, iron binding, and ferrochelatase interaction. Biochemistry. 2004;43:16254–16262. doi: 10.1021/bi0488193. [DOI] [PMC free article] [PubMed] [Google Scholar]
- 23.Nair M, Adinolfi S, Pastore C, Kelly G, Temussi P, Pastore A. Solution structure of the bacterial frataxin ortholog, CyaY: mapping the iron binding sites. Structure (Camb) 2004;12:2037–2048. doi: 10.1016/j.str.2004.08.012. [DOI] [PubMed] [Google Scholar]
- 24.Huang J, Dizin E, Cowan JA. Mapping iron binding sites on human frataxin: implications for cluster assembly on the ISU Fe-S cluster scaffold protein. J Biol Inorg Chem. 2008;13:825–836. doi: 10.1007/s00775-008-0369-4. [DOI] [PubMed] [Google Scholar]
- 25.Studier FW. Protein production by auto-induction in high density shaking cultures. Protein Expr Purif. 2005;41:207–234. doi: 10.1016/j.pep.2005.01.016. [DOI] [PubMed] [Google Scholar]
- 26.Pervushin K, Braun D, Fernandez C, Wuthrich K. [15N,1H]/[13C,1H]-TROSY for simultaneous detection of backbone 15N-1H, aromatic 13C-1H and side-chain 15N-1H2 correlations in large proteins. J Biomol NMR. 2000;17:195–202. doi: 10.1023/a:1008399320576. [DOI] [PubMed] [Google Scholar]
- 27.Delaglio F, Grzesiek S, Vuister GW, Zhu G, Pfeifer J, Bax A. NMRPipe: a multidimensional spectral processing system based on UNIX pipes. J Biomol NMR. 1995;6:277–293. doi: 10.1007/BF00197809. [DOI] [PubMed] [Google Scholar]
- 28.Goddard TD, Kneller DG. SPARKY 3. University of California; San Francisco: 2001. [Google Scholar]
- 29.George GN, George SJ, Pickering IJ. EXAFSPAK. Menlo Park, CA: 2001. http://www-ssrl.slac.stanford.edu/~george/exafspak/exafs.htm. [Google Scholar]
- 30.Bencze KZ, Kondapalli KC, Stemmler TL. X-Ray Absorption Spectroscopy. In: Scott RA, Lukehart CM, editors. Applications of Physical Methods in Inorganic and Bioinorganic Chemistry: Handbook, Encyclopedia of Inorganic Chemistry. 2. John Wiley & Sons, LTD; Chichester, UK: 2007. pp. 513–528. [Google Scholar]
- 31.Semisotnov GV, Rodionova NA, Razgulyaev OI, Uversky VN, Gripas AF, Gilmanshin RI. Study of the “molten globule” intermediate state in protein folding by a hydrophobic fluorescent probe. Biopolymers. 1991;31:119–128. doi: 10.1002/bip.360310111. [DOI] [PubMed] [Google Scholar]
- 32.Reddy GB, Das KP, Petrash JM, Surewicz WK. Temperature-dependent chaperone activity and structural properties of human alphaA- and alphaB-crystallins. The Journal of biological chemistry. 2000;275:4565–4570. doi: 10.1074/jbc.275.7.4565. [DOI] [PubMed] [Google Scholar]
- 33.Roe AL, Schneider DJ, Mayer RL, Pyrz JW, Widon J, Que L., Jr X-ray absorption spectroscopy of iron-tyrosinate proteins. J Am Chem Soc, USA. 1984;106:1676–1681. [Google Scholar]
- 34.Sazinsky MH, LeMoine B, Orofino M, Davydov R, Bencze KZ, Stemmler TL, Hoffman BM, Arguello JM, Rosenzweig AC. Characterization and structure of a Zn2+ and [2Fe-2S]-containing copper chaperone from Archaeoglobus fulgidus. The Journal of biological chemistry. 2007;282:25950–25959. doi: 10.1074/jbc.M703311200. [DOI] [PMC free article] [PubMed] [Google Scholar]
- 35.Hawe A, Sutter M, Jiskoot W. Extrinsic fluorescent dyes as tools for protein characterization. Pharm Res. 2008;25:1487–1499. doi: 10.1007/s11095-007-9516-9. [DOI] [PMC free article] [PubMed] [Google Scholar]
- 36.Raulfs EC, O’Carroll IP, Dos Santos PC, Unciuleac MC, Dean DR. In vivo iron-sulfur cluster formation. Proceedings of the National Academy of Sciences of the United States of America. 2008;105:8591–8596. doi: 10.1073/pnas.0803173105. [DOI] [PMC free article] [PubMed] [Google Scholar]
- 37.Foury F, Pastore A, Trincal M. Acidic residues of yeast frataxin have an essential role in Fe-S cluster assembly. EMBO Rep. 2007;8:194–199. doi: 10.1038/sj.embor.7400881. [DOI] [PMC free article] [PubMed] [Google Scholar]
- 38.Ramazzotti A, Vanmansart V, Foury F. Mitochondrial functional interactions between frataxin and Isu1p, the iron-sulfur cluster scaffold protein, in Saccharomyces cerevisiae. FEBS letters. 2004;557:215–220. doi: 10.1016/s0014-5793(03)01498-4. [DOI] [PubMed] [Google Scholar]
- 39.Li H, Gakh O, Smith DYt, Isaya G. Oligomeric yeast frataxin drives assembly of core machinery for mitochondrial iron-sulfur cluster synthesis. The Journal of biological chemistry. 2009;284:21971–21980. doi: 10.1074/jbc.M109.011197. [DOI] [PMC free article] [PubMed] [Google Scholar]
- 40.Bertini I, Cowan JA, Del Bianco C, Luchinat C, Mansy SS. Thermotoga maritima IscU. Structural characterization and dynamics of a new class of metallochaperone. J Mol Biol. 2003;331:907–924. doi: 10.1016/s0022-2836(03)00768-x. [DOI] [PubMed] [Google Scholar]
- 41.Ramelot TA, Cort JR, Goldsmith-Fischman S, Kornhaber GJ, Xiao R, Shastry R, Acton TB, Honig B, Montelione GT, Kennedy MA. Solution NMR structure of the iron-sulfur cluster assembly protein U (IscU) with zinc bound at the active site. J Mol Biol. 2004;344:567–583. doi: 10.1016/j.jmb.2004.08.038. [DOI] [PubMed] [Google Scholar]
- 42.Adinolfi S, Rizzo F, Masino L, Nair M, Martin SR, Pastore A, Temussi PA. Bacterial IscU is a well folded and functional single domain protein. Eur J Biochem. 2004;271:2093–2100. doi: 10.1111/j.1432-1033.2004.04112.x. [DOI] [PubMed] [Google Scholar]
- 43.Liu J, Oganesyan N, Shin DH, Jancarik J, Yokota H, Kim R, Kim SH. Structural characterization of an iron-sulfur cluster assembly protein IscU in a zinc-bound form. Proteins. 2005;59:875–881. doi: 10.1002/prot.20421. [DOI] [PubMed] [Google Scholar]
- 44.Shi R, Proteau A, Villarroya M, Moukadiri I, Zhang L, Trempe JF, Matte A, Armengod ME, Cygler M. Structural basis for Fe-S cluster assembly and tRNA thiolation mediated by IscS protein-protein interactions. PLoS Biol. 2010;8:1–18. doi: 10.1371/journal.pbio.1000354. [DOI] [PMC free article] [PubMed] [Google Scholar]
- 45.Mansy SS, Cowan JA. Iron-sulfur cluster biosynthesis: toward an understanding of cellular machinery and molecular mechanism. Acc Chem Res. 2004;37:719–725. doi: 10.1021/ar0301781. [DOI] [PubMed] [Google Scholar]
- 46.Shimomura Y, Wada K, Fukuyama K, Takahashi Y. The asymmetric trimeric architecture of [2Fe-2S] IscU: implications for its scaffolding during iron-sulfur cluster biosynthesis. J Mol Biol. 2008;383:133–143. doi: 10.1016/j.jmb.2008.08.015. [DOI] [PubMed] [Google Scholar]
- 47.Bandyopadhyay S, Chandramouli K, Johnson MK. Iron-sulfur cluster biosynthesis. Biochem Soc Trans. 2008;36:1112–1119. doi: 10.1042/BST0361112. [DOI] [PMC free article] [PubMed] [Google Scholar]
- 48.Westre TE, Kennepohl P, DeWitt JG, Hedman B, Hodgson KO, Solomon EI. A Multiplet Analysis of the Fe K-Edge 1s->3d Pre-Edge Features of Iron Complexes. J Am Chem Soc. 1997;119:6297–6314. [Google Scholar]