Abstract
Adenosine deaminase (ADA) is a key enzyme in purine metabolism and crucial for normal immune competence. It is a 40 kDa-monomeric TIM-barrel protein containing a tightly bound Zn2+, which is required for activity. In this study, we have investigated the role of Zn2+with respect to ADA structure and stability. After removing Zn2+, the crystallographic structure of the protein remains highly ordered and similar to that of the holo protein with structural changes limited to regions capping the active site pocket. The stability of the protein, however, is decreased significantly in the absence of Zn2+. Denaturation with urea shows the midpoint to be about 3.5 M for the apo enzyme compared to 6.4 M for the holo enzyme. ADA contains four tryptophan residues distant from the Zn2+site. 19F-NMR studies in the presence and absence of Zn2+ were carried out after incorporation of 6-19F-tryptophan. Chemical shift differences were observed for three of the four tryptophan residues suggesting that, in contrast to the X-ray data, Zn2+-induced structural changes are propagated throughout the protein. Changes throughout the structure as suggested by the NMR data may explain the lower stability of the Zn2+-free protein. Real-time 19F-NMR spectroscopy measuring the loss of Zn2+ showed that structural changes correlated with the loss of enzymatic activity.
1. Introduction
About 30% of proteins within cells bind to metals 1. The presence of the metal ions is not only required for their biological function or regulation but also for protein stabilization. In spite of increasing attention in the past few years, it is still not clear how metals are involved in the folding and stability of native proteins 2–6. Adenosine deaminase (ADA, EC 3.5.4.4), a 40 kDa monomeric protein, contains a tightly bound Zn2+. ADA is known to be a key enzyme in purine metabolism, catalyzing the irreversible deamination of adenosine or 2’-deoxyadenosine to inosine or 2’-deoxyinosine and ammonia. The enzyme is found in virtually all mammalian cells. Lack of enzymatic activity is associated with an autosomal recessive immunodeficiency disorder, loss of functional T and B lymphocytes and occurrence of the disease called severe combined immunodeficiency (SCID) 7–9. ADA is a triosephosphate isomerase (TIM)-barrel or (β/α)8-barrel structure, consisting of eight parallel β-strands and eight peripheral α-helices that surround the central β-strands 10–12. The TIM-barrel is one of the most common structural scaffolds, seen in at least 15 different enzyme families 13–15. Almost all TIM-barrel proteins are enzymes with diverse catalytic functions and very low sequence similarity. Interestingly, the active sites of TIM-barrel enzymes have conserved topology despite the diverse catalytic residues and substrate specificities; they are funnel-shaped pockets formed by the C-terminal ends of the β-strands and the βα loops that link β-strands with the subsequent α-helices. Many TIM-barrel proteins, including ADA, contain metal ions at active sites but the role of the metal in the stability of the proteins is rarely reported. In this study we examined the properties of the murine ADA (mADA), for which the sequence is 83% identical and more than 90% homologous to human ADA. We compare the structure and urea denaturation of apo (without the Zn2+ cofactor) and holo mADA, for insights that may imply some common mechanism in metal containing TIM-barrel proteins.
In mADA, the Zn2+ cofactor located at the active site pocket is coordinated to residues His15, His17, His214, and Asp295. As part of the enzymatic mechanism the Zn2+ polarizes a water molecule, which has hydrogen bonds to His238 and Asp295, and attacks the substrate to form a tetrahedral intermediate at the C6 position of the purine ring 10–12,16. Zn2+ binds to mADA tightly, with the dissociation constant estimated to be lower than 10−9 M 17. Removing Zn2+ 17 or mutating amino acids involved in metal coordination 18,19 leads to loss of the enzyme activity, confirming the role of Zn2+ in catalytic function of ADA. However, the role of Zn2+ in the folding and stability of the protein is not clear. Here we show that while X-ray studies of the apo protein show structural changes near the Zn2+ binding site, the NMR studies show that removal of the Zn2+ appears to affect more distant regions of the protein and may account for the lower stability of the Zn2+-free protein.
2. Methods
Dipicolinic acid (DPA), ethylenediaminetetraacetic acid (EDTA), 6-19F-DL-tryptophan and adenosine were purchased from Sigma (St. Louis, MO). Chelex 100 resin was from Bio-Rad (Hercules, CA). Fura-2 was obtained from Molecular Probes (Eugene, OR). 2'-Deoxycoformycin was obtained from the Developmental Therapeutic Program, National Cancer Institute. Ultrapure urea was a product of United States Biochemical (Cleveland, OH). All other chemicals were reagent grade. The concentration of urea was determined by refractive index at 25 °C 20. All buffers were depleted of metal using the Chelex 100 resin. Plasticware and Milli-Q purified water (18.2 MΩ) were used throughout. All plasticware was soaked in 1 mM EDTA buffer for a day and rinsed with Milli-Q water.
Holo unlabeled and 6-19F-Trp labeled mADA were expressed in E. coli strain W3110trpA33 using the construct pQE80L/mADA and purified as described elsewhere 21. Protein concentrations were determined using the Bio-Rad protein assay reagent. The concentration of active ADA enzyme was determined by active site titration with deoxycoformycin 22.
Enzyme Activity Assays
ADA activity was measured on a Cary50Bio spectrophotometer (Varian) by following the decrease in adenosine absorption at 265 nm and 25 °C. The assay was initiated by addition of 5 µL of enzyme (final concentration 5 nM) to 995 µL assay mixture containing 75 µM adenosine in 20 mM Tris-HCl, pH 7.4, 2 mM DTT, and 1 mM EDTA. Since Zn2+, Cu2+ and Mn2+ and other metal ions were found to be a competitive or noncompetitive inhibitors of holo mADA 17, EDTA (1 mM) was added to the assay to remove trace amount of such metals. EDTA up to 10 mM had no effect on enzymatic activity of holo mADA (Shu and Frieden, unpublished data).
Gel Filtration Chromatography
Holo or apo mADA (200 µL) at a concentration about 0.5 mg/mL was loaded onto a Superose 12 HR 10/30 column (Amersham Pharmacia), connected to a ÄKTA FPLC system (Amersham Pharmacia). The column was pre-equilibrated using buffer of 20 mM Tris-HCl, pH 7.4, 2 mM DTT, 1 mM EDTA and 150 mM NaCl. The elution was monitored by the absorbance at 280 nm using a flow rate of 0.4 mL/min. The chromatograms were analyzed using the software UNICON 3.0 (Amersham Pharmacia). Gel filtration molecular weight markers (MW-GF-1000 kit, Sigma) were used and eluted under the same condition to obtain a standard curve and equation for estimating the molecular weight of eluted fractions in each measured sample.
Circular Dichroism Spectroscopy
Near- and far-UV CD spectra were recorded on a Jasco-J715 spectropolarimeter with a 1-cm and 0.1-cm path cell, respectively. Spectra were recorded at 25 °C as an average of 6 scans from 250 to 350 nm (near-UV) and from 200 to 260 nm (far-UV). The scan rate was 20 or 50 nm/min with a response time of the spectrapolarimeter of 1 s. The protein concentration used was 25 µM for near-UV and 5 µM for far-UV CD experiments. Data were collected in 20 mM Tris-HCl, pH 7.4, 2 mM DTT containing 1 mM EDTA.
Fluorescence Spectroscopy
The fluorescence emission spectrum was measured on a PTI fluorometer (Photon Technology International, Canada) using an excitation wavelength of 290 nm at 25 °C. The protein concentration was 1 µM in 20 mM Tris-HCl, pH 7.4, 2 mM DTT and 1 mM EDTA.
Real-time Unfolding Experiments
Stopped-flow circular dichroism was measured by using an Applied Photophysics RX1000 rapid-kinetics accessory equipped with a 0.2-cm path-length cell and fitted to a Jasco-J715 spectropolarimeter. Stopped-flow fluorescence measurements were performed by an Applied Photophysics SX.18MV spectrofluorimeter (Letherhead, U.K.). Drive syringes of 0.5 mL (containing protein stock solution) and 2.5 ml (containing 9.6 M urea) were used, resulting in a final urea concentration of 8 M. To measure the slow unfolding process of holo mADA, the CD and intrinsic fluorescence signal were recorded in a time-base mode on the Jasco-J715 spectropolarimeter and on the PTI fluorometer, respectively. The final protein concentration was 5 µM for CD and 1 µM for fluorescence measurement in 20 mM Tris-HCl, pH 7.4, 2 mM DTT with 0–10 mM EDTA. All experiments were performed at 25 °C.
Dissociation of Zn2+ from holo mADA monitored by Fura-2
Fura-2, which binds Zn2+ tightly with a dissociation constant (Kd) of approximately 3 nM 23,24, is a fluorescent probe that detects free Zn2+. The fluorescent Fura-2 assay can directly quantify the concentration of free Zn2+ in protein solutions 25. In this study, the free Zn2+ level in either apo or holo mADA solution was measured by fluorimetric Fura-2 assay at 25 °C on a PTI fluorometer with an excitation wavelength of 330 nm and an emission wavelength of 505 nm. No free Zn2+ was detected in either apo or holo mADA under native conditions (data not shown).
19F NMR Spectroscopy
NMR spectra were recorded on a Varian Unity-Plus 500 MHz spectrometer operating at 470 MHz for 19F nuclear spin using a Varian Cryo-Q dedicated 5 mm probe as previously described 21. Data were acquired for 0.501 sec using Varian VNMR s2pul pulse sequence and a spectral width of 6499.8 Hz. Spectra were collected as 512 transients at 25 °C. The protein concentration was 85 µM in 20 mM Tris-HCl, pH 7.4, 2 mM DTT, 1 mM EDTA, 5% D2O and 0.1 mM 4-19F-Phe (as an internal reference). Deconvolution of all 19F-NMR spectra was performed using Bayesian analysis to obtain the relative intensity of each resonance 26.
X-ray Crystallography
Crystals of holo and apo mADA were obtained using the hanging drop vapor-diffusion method. For both samples, 2 µL of 10 mg/mL protein solution and 2 µL of the reservoir solution containing 20% PEG 3350 and 200 mM ammonium sulfate, pH 4.7 for apo mADA or 25%PEG 6000, 20 mM Tris-HCl and pH 8.5 for holo mADA and were mixed directly and equilibrated against the reservoir solution. The crystals were grown at 295 K and formed within 2–7 days. Although data for the two structures were obtained at different pH values, the structures appear to be insensitive to pH (unpublished observations).
X-ray data were recorded from a single crystal from each sample at 100 K using 15% glycerol as a cryoprotectant. For the holo mADA crystal, X-ray data were collected to 1.6 Å resolution on an ADSC Quantum-315 CCD detector at the Biocars Beamline 14-BM-C of the Advanced Photon Source, Argonne National Laboratories, Argonne, IL. For the apo mADA, the X-ray data were collected to 2.2 Å, on a Rigaku Raxis IV detector, using a Ni-filtered, mirror-focused X-ray beam obtained from a Rigaku RU200 X-ray generator operated at 5 keV power. Data processing including indexing, integration and scaling was performed using the HKL 2000 package 27. There were two molecules in the asymmetric unit for both crystal forms.
The structures were solved by molecular replacement using MOLREP from the ccp4 package 28. The coordinates from the complex of holo mADA bound with purine riboside at 1.9 Å resolution (PDB code 1a4m 12), were used as the starting model, and all cofactors, inhibitors and solvent molecules were omitted. The structure refinement and calculations of electron density map were carried out using REFMAC5 29,30 and 5% of the reflections were selected randomly and set aside as a test set for cross validation 31. Model building and analysis of the structures were carried out on a Silicon Graphic workstation using COOT 32. Rigid body refinement before several cycles of positional and temperature factor refinement followed by interactive model building and automatic solvent placement with manual examination, were carried out. Ramachandran plots were calculated by COOT 32. The cell parameters, space group information, data collection statistics, refinement and model parameters are presented in Table 1.
Table 1.
Data collection and refinement for the holo and apo mADA.
| Ligand-free holo mADA | Apo mADA | |
|---|---|---|
| Wavelength (Å) | 0.90 | 1.54 |
| pH | 8.5 | 4.7 |
| Space group | P21 | C2 |
| Unit cell dimension | a=46.7 Å, b=93.8 Å, c=88.0 Å, β=105.3° | a=98.8 Å, b=93.8 Å, c=86.2 Å, β=96.8° |
| No. molecules per asymmetric unit | 2 | 2 |
| Res. Range (last shell) (Å) | 40–1.6 (1.66-1.60) | 40–2.2 (2.24-2.20) |
| No. observations | 418105 | 120694 |
| Unique observations | 92164 | 37983 |
| Redundancy (last shell) | 4.5 (3.0) | 3.2 (2.5) |
| Completeness (last shell) | 95.9 (79.7) | 95.7(89.9) |
| Rmerge a (last shell) (%) | 6.4 (37.4) | 9.3(36.9) |
| Mean I/σ(I)b (last shell) | 18.8 (2.2) | 10.7(2.5) |
| Refinement | ||
| Resolution (Å) | 40–1.6 | 40–2.2 |
| Rcryst c | 0.168 | 0.199 |
| Rfree d | 0.205 | 0.269 |
| Protein atoms | 5584 | 5584 |
| water molecules | 648 | 265 |
| Zn/GOL/Tris/Sulfate | 2/2/2/0 | 0/2/0/1 |
| Rmsd bond lengthse (Å) | 0.012 | 0.012 |
| Rmsd anglese (°) | 1.3 | 1.3 |
| Rms ΔB (Å2) (mm/ms/ss)f | 0.7/0.6/2.3 | 0.7/0.4/1.9 |
| <B> protein (Å2) | 17.6 | 327.5 |
| <B> water molecules (Å2) | 32.8 | 32.1 |
| Preferred regiong Ramachandran plot (%) | 96.7 | 95.8 |
| Allowed regiong Ramachandran plot (%) | 2.4 | 3.5 |
| Outliers (%) | 0.9 | 0.7 |
Rmerge=ΣhΣi|I(h)−Ii(h)]| ΣhΣiIi(h), where Ii(h) and I(h) are the ith and mean measurements of reflection h.
I/σ(I) is the average signal to noise ratio for merged reflection intensities.
R=Σh|Fo-Fc|/Σh|Fo|, where Fo and Fc are the observed and calculated structure factor amplitudes of reflection h.
Rfree is the test reflection data set, about 5 % selected randomly for cross validation during crystallographic refinement 31.
Root-mean-squared deviation (Rmsd) from ideal bond lengths and angles and Rmsd in B-factors of bonded atoms.
mm, main chain to main chain; ms, main chain to side chain, ss, side chain to side chain.
Regions preferred or allowed by a Ramachandran plot.
3. Results
Preparation of Apo mADA
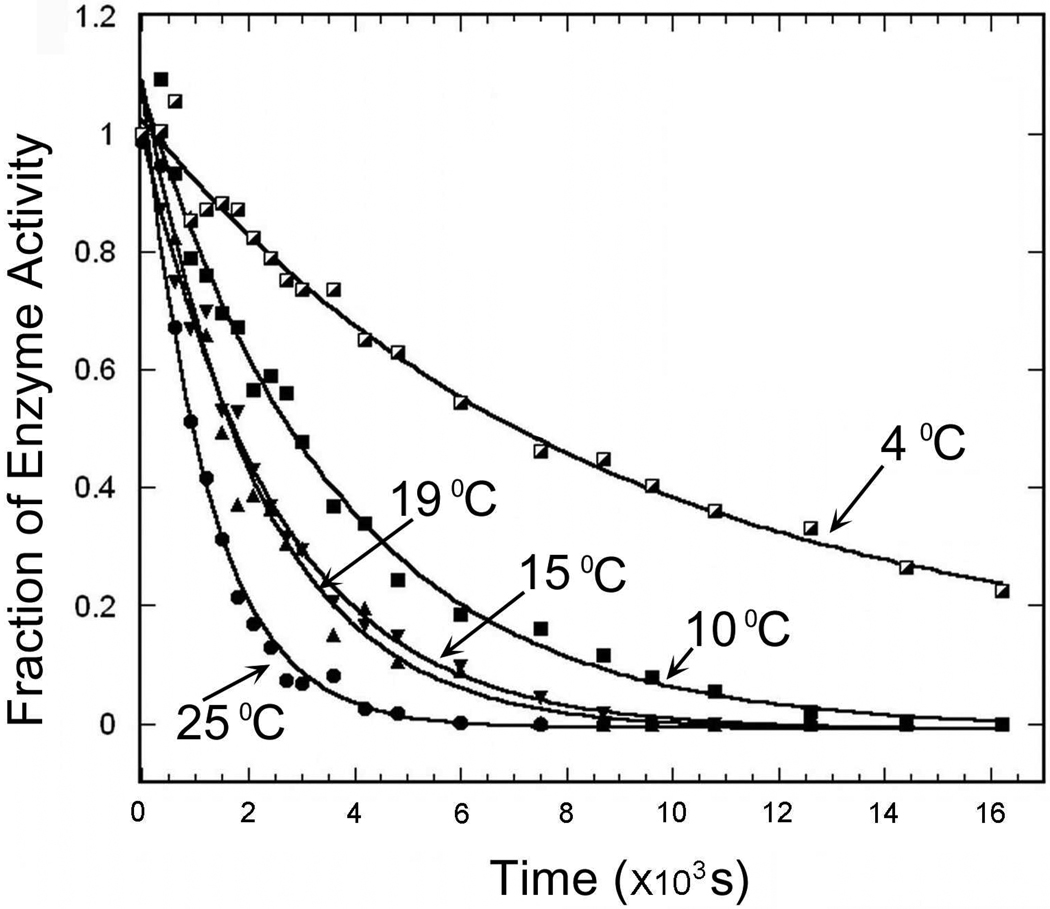
Apo mADA was prepared similarly to the procedure given by Cooper et al. 17 with minor changes. In our procedure, holo mADA (42 mg/mL) was diluted 80-fold into 10 mM dipicolinic acid (DPA) in 50 mM MES, pH 5.5, and 2 mM DTT (chelating buffer) and incubated at room temperature for 1 h after which the residual enzyme activity (i. e., the residual holo protein) was less than 5%. The protein was further dialyzed at 4 °C against two changes of the chelating buffer over 24 h, followed by four changes of 20 mM Tris-HCl, pH 7.4, 2 mM DTT, 1 mM EDTA over 48 h. The supernatant from the dialyzed protein solution, after centrifugation, contained Zn2+-free mADA with less than 1% of the original activity. The yield of apo protein was about 80% of the initial protein concentration. The material is monomeric as shown by gel filtration FPLC and native PAGE (data not shown). The rate of DPA-induced Zn2+ loss from ADA was temperature-dependent (Figure 1), increasing linearly with temperature. The Zn2+ cofactor could be removed rapidly from the holo protein after 1 h of pre-incubation at room temperature, resulting in a total chelating time of 1 day with little precipitation. Apo mADA prepared here appears similar to the holo protein in secondary and tertiary structure as detected by CD and fluorescence spectroscopy, (data not shown). Enzymatic activity can be fully restored by adding a suitable amount of Zn2+ to the apo protein, consistent with the previous report 17.
Figure 1.
DPA-induced loss of the Zn2+ cofactor at different temperature as monitored by enzyme activity. The chelating buffer (10 mM DPA in 50 mM MES, pH 5.5 and 2 mM DTT) was pre-incubated at the indicated temperature and holo mADA was diluted into the chelating buffer. ADA activity was measured as a function of time.
Urea Denaturation
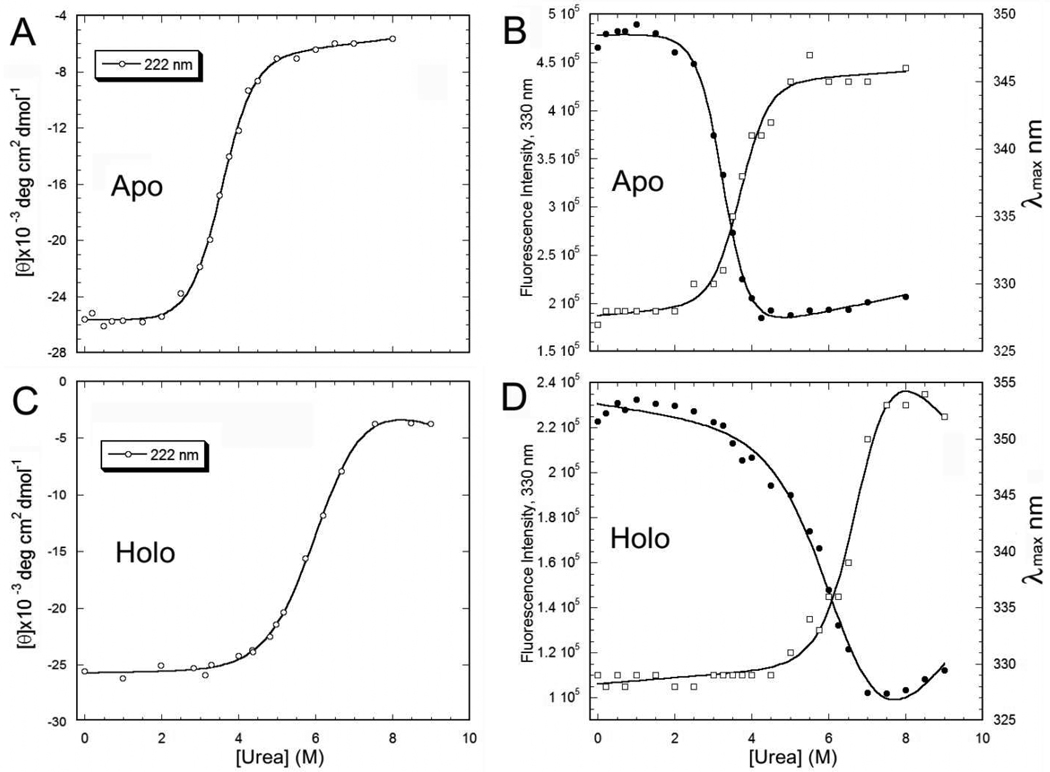
Urea denaturation of apo and holo mADA was performed as previously described 21 and monitored by both CD and fluorescence. The equilibrium data were analyzed using the linear extrapolation method and fitting to a two-state model 33. The protein stability of apo mADA is substantially different from that of holo mADA as shown by urea denaturation using CD and fluorescence spectroscopy. Apo mADA has a midpoint in its denaturation curve at about 3.5 M urea (Figures 2A and B), significantly lower than that of holo mADA, which has a midpoint of more than 6.4 M urea (Figures 2C and D, Table 2). We also observed that the equilibrium unfolding curve is similar for holo mADA in the presence or absence of EDTA (1 mM ) (data not shown). Although EDTA can chelate Zn2+ (kd approx. 10−7 M 34), at urea concentrations below the denaturation midpoint Zn2+ remains bound to the holo protein.
Figure 2.
Comparison of urea denaturation of apo and holo mADA. A) and C) monitored by far-UV CD at 222 nm. B) and D) monitored by fluorescence intensity at 330 nm (●) and emission maximum wavelength (□) (Imax nm). All protein samples were incubated in 20 mM Tris-HCl, pH 7.4, 2 mM DTT and 1 mM EDTA and urea at room temperature for 22 h before measurements. The signal change was fit to a two-state model (cf. Table 2).
Table 2.
Equilibrium unfolding parameters of holo and apo mADAa.
| Experiment | Sample | ΔG0 (Kcal/mol) |
m (Kcal/mol/M) |
[Urea]1/2 (M) |
|---|---|---|---|---|
| CD Ellipticity At 222 nm | Apo | 5.05 | 1.42 | 3.56 |
| Holo + EDTA | 5.63 | 0.92 | 6.12 | |
| Fluorescence | Apo, intensity (330 nm) | 5.69 | 1.75 | 3.25 |
| Apo, maximum emission | 5.93 | 1.60 | 3.71 | |
| Holo + EDTA, intensity (330 nm) | 4.98 | 0.78 | 6.38 | |
| Holo + EDTA, maximum emission | 8.74 | 1.28 | 6.83 |
The parameters were derived from the fit of the data shown in Fig. 2 using a two-state model. ‘m’ is the slope of the denaturation curve. The average midpoints of urea denaturation observed by different experiments are 3.51±0.23 M for apo and 6.44±0.36 M for holo mADA, respectively.
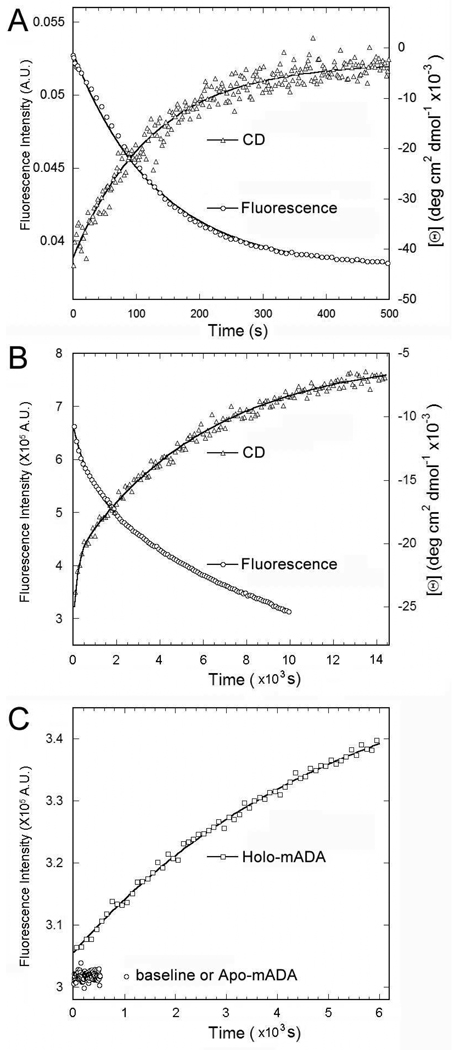
The kinetics of unfolding in 8 M urea were measured using CD and tryptophan fluorescence spectroscopy (Figure 3 and Table 3). A single kinetic process with half-time about 90 s was observed for apo mADA (Figure 3A) while two obvious phases were observed for holo mADA (Figure 3B). The first phase shows about a 20% loss of the total structural signal with a half-time of approximately 100 s, similar to the unfolding of apo mADA. The remaining 80% shows a rate constant similar to that for the dissociation of Zn2+ from the protein in 8 M urea indicating that the slow phase is associated with loss of the Zn2+ cofactor (see below). The unfolding kinetics of holo mADA is similar in the presence or absence of 1–10 mM EDTA (data not shown), consistent with the equilibrium unfolding experiments.
Figure 3.
Comparison of unfolding kinetics for apo and holo mADA by 8 M urea. A) and B) CD (222 nm) and intrinsic fluorescence (excitation at 290 nm and emission at 330 nm) signal change for apo and holo mADA were recorded from 0 to 8 M urea. C) The fluorescence intensity of Fura-2 (excitation at 330 nm and emission at 505 nm) increased when holo mADA was added into the Fura-2 buffer containing 8 M urea.
Table 3.
Rate constants and amplitudes for unfolding of mADA in 8 M urea
| Sample | Experiment | Rate constant (k1, 10−3 s−1) | Rate constant (k2, 10−4 s−1) |
|---|---|---|---|
| Apo mADA a | CD Fluorescence |
7.9 7.6 |
N/A N/A |
| Holo mADA b | CD Fluorescence |
5.5 6.5 |
1.6 2.1 |
| Fura-2 + Zn2+ (holo mADA) c |
Fluorescence | 0.2 | N/A |
Kinetic unfolding data (Figure 3) were fit using Kaleidagraph (Synergy Software, Reading, PA). Errors are less than 5% of all values.
The unfolding of apo mADA (Figure 3A) was fit to a single-exponential function. A two exponential function did not fit better.
The unfolding of holo mADA (Figure 3B) was fit to a two-exponential function. The rate constant of the first phase varied from 1.7 to 10 × 10−3 s−1 between different repeats of the manual mixing experiments, and experiments near average are shown in Figure 3B. The rate constant of the second phase was relatively constant, about 2× 10⁻⁴ s−1.
The increase of fluorescence intensity upon Fura-2 binding to Zn2+ dissociated from holo mADA (Figure 3C) was fit to a single-exponential function.
Figure 3C shows the Fura-2 assay for dissociation of Zn2+ from ADA in 8 M urea. Fura-2 fluorescence was recorded after diluting a protein stock solution (at 42 mg/mL) into buffer containing 20 mM Tris-HCl, 2 mM DTT, 8 M urea and 50 µM Fura-2 at pH 7.4. The rate constant for the increase of Fura-2 fluorescence is consistent with that of the slow phase of structure loss observed above in holo mADA unfolding (cf. Figure 3B). Hence, the release of Zn2+ occurs concomitantly with, rather than prior to, the slow phase of holo mADA unfolding.
19F NMR of apo and holo mADA
There are four tryptophan residues (at positions 117, 161, 264 and 272) in ADA that are conserved in the human, murine and bovine enzymes. They are located in different structural elements of the protein and all are more than 12 Å distant from the Zn2+ cofactor of the catalytic center. Our previous studies on holo mADA have shown that mADA labeled with 6-19F-Trp is similar to the unlabeled wild-type protein in terms of the enzyme activity, structure and stability and that the 19F NMR signal from the four 6-19F-Trp residues can report site-specific structural change in the folding and enzymatic ligand binding process 21,35.
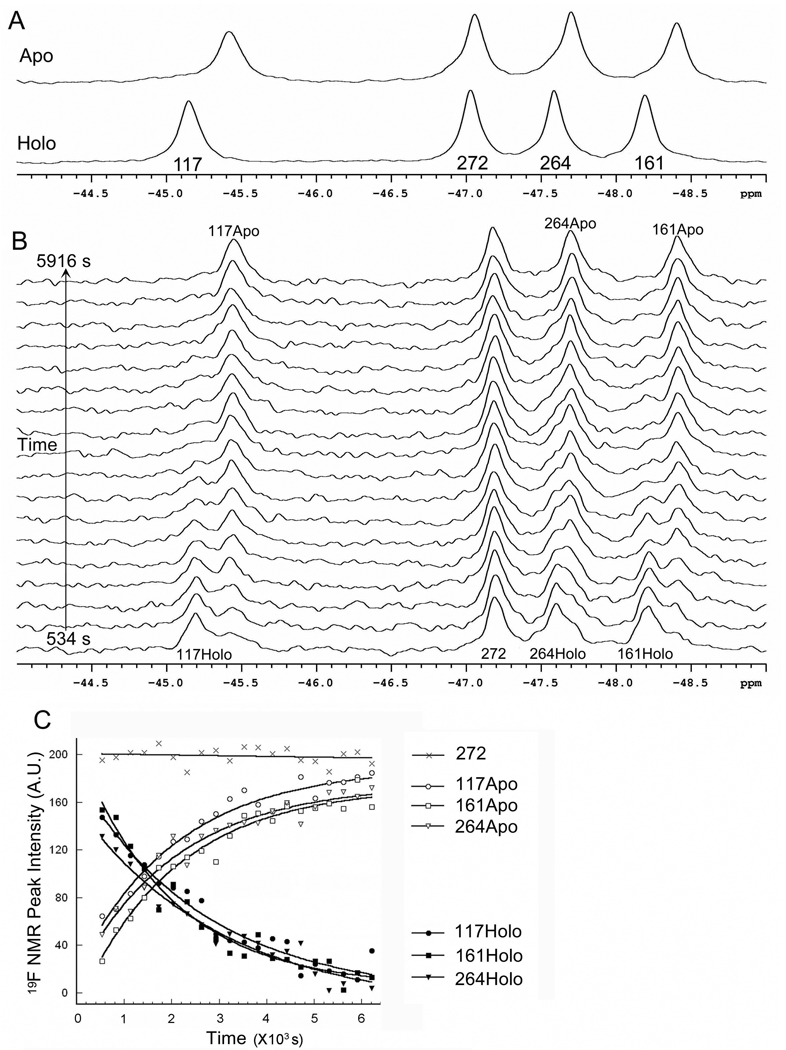
Figure 4A shows the 19F-NMR spectra of 6-19F-Trp labeled apo and holo mADA. Relative to the holo protein, the 6-19F-Trp peaks of the apo protein have moved slightly up field. At pH 7.4, the chemical shift change is 0.27 ppm for Trp117, 0.21 ppm for Trp161, and 0.11 ppm for Trp264, respectively. There is no obvious change for Trp272 between the apo and holo mADA. The slight difference in chemical shift for Trp117, Trp161 and Trp264 suggests that the chemical environment of the three tryptophan residues has changed after removal of the Zn2+ cofactor.
Figure 4.
A) Comparison of 19F-NMR spectra of 6-19F-Trp labeled apo and holo mADA. B) DPA-induced real-time structural change from the holo to apo mADA. The spectrum of each time point was the signal averaged from 64 scans at 20 °C after diluting holo mADA into 10 mM DPA in 50 mM MES, pH 5.5, 2 mM DTT, and 5% D2O. C) Intensity change of 19F NMR peaks from B). The changes in 19F NMR peak intensity were fit to a single exponential function. Rate constants are shown in Table 4.
Because of the difference in chemical shift between apo and holo mADA, 19F NMR can be used to follow the real-time spectral changes during the loss of Zn2+. As shown in Figure 4B, dilution of holo mADA into buffer containing 10 mM DPA at pH 5.5, three of the four 19F-Trp NMR spectral peaks (all but Trp272) decreased in intensity with time, while those from the Zn2+ free apo protein increased. The rate constants of the intensity changes of the three (Figure 4 and Table 4) correlate well with that monitored by the loss of the enzyme activity (cf. Figure 1). indicating consistency between the structural change and the enzyme activity change. The loss of Zn2+ induced by chelator DPA, done at pH 5.5, directly affects the ligation between His residues and the Zn2+ but not the global protein structure.
Table 4.
Rate constant (k) for the NMR peak intensity change during removal of Zn2+ from holo mADA by 10 mM DPA at 20 °C and pH 5.5a.
| Tryptophan | k, 10−4 s−1 |
|---|---|
| 117 Holo | 3.8±0.7 |
| 161 Holo | 5.1±0.8 |
| 264 Holo | 3.3±0.7 |
| 117 Apo | 4.8±0.7 |
| 161 Apo | 4.9±0.7 |
| 264 Apo | 4.7±0.9 |
That both apo and holo mADA peaks are observed means that these forms are in slow exchange on the NMR time scale.
Crystal Structures of apo and holo mADA
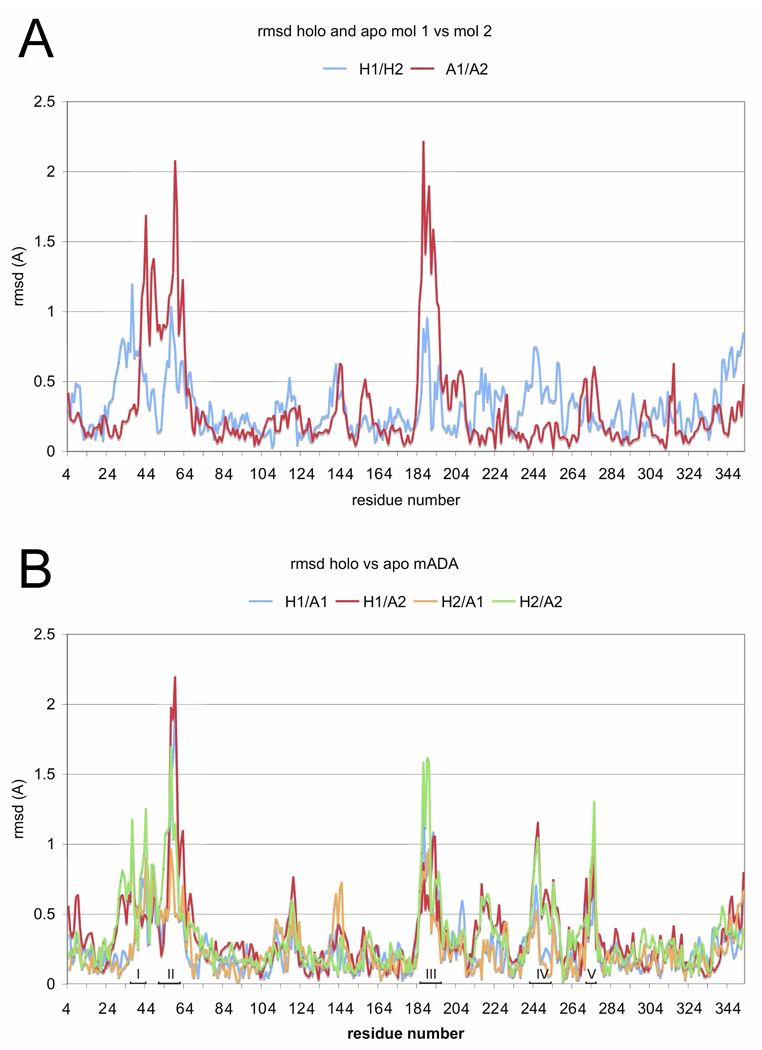
The crystal structures of apo and holo mADA were solved at 2.2 and 1.6 Å resolution, respectively. Both crystals contain two molecules of mADA in the asymmetric unit. Within each crystal the two molecules differ, respectively, by 0.37 Å and 0.46 Å rmsd between equivalent Cα atoms (Figure 5A). The structure of apo mADA is well ordered and similar to the holo protein, differing by 0.31–0.44 Å rmsd between equivalent Cα atoms among the four combinations of molecule types (Figure 5B). The apo structure is also very similar to that previously determined for holo mADA bound to the HDPR inhibitor previously determined at pH 7 to 1.95 Å resolution (PDB code 1a4m 12).
Figure 5.
Plots for apo and holo mADA comparing root mean square deviation (rmsd) vs residue number. A) Rmsd between equivalent Cα atoms of molecules 1 and 2 of holo mADA (H1/H2) and of apo mADA (A1/A2). B) Rmsd between equivalent Cα atoms of holo vs apo mADA for molecules H1, H2, A1, A2. Five peptide segments containing residues differing by 1 Å or more between the holo and apo mADA are indicated on the abscissa and are labeled by Roman numerals I–V (see legend to Figure 6).
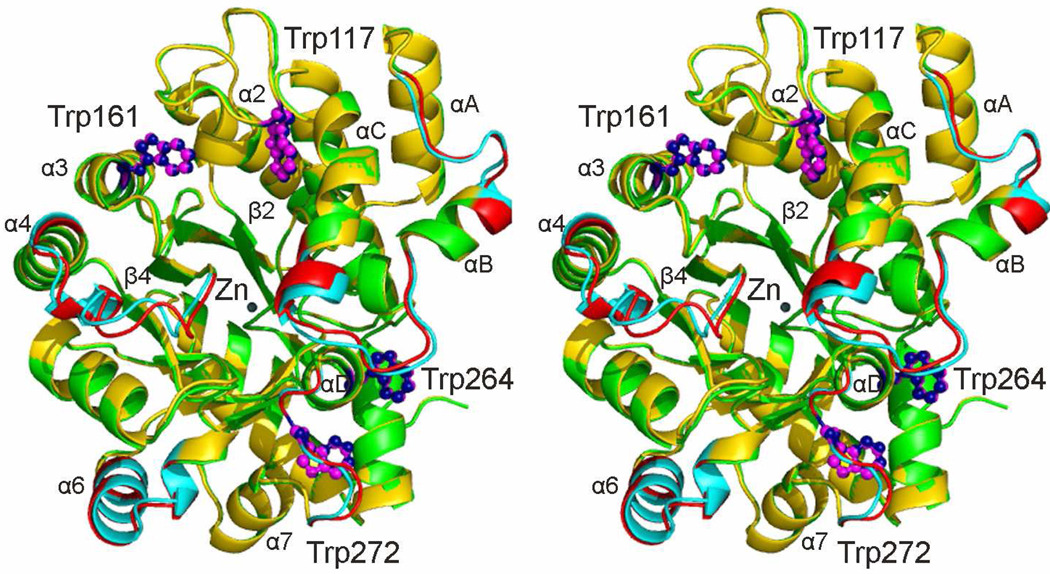
The structures of the apo and holo mADA molecules showing the largest structural differences from each other, chains B of each (Figure 5B, overall rmsd=0.34 Å), are compared in Figure 6. The largest deviation observed with differences between Cα atoms greater than 1 Å, are contained within segments located in a largely helical loop between strand β1 and helix α1, in the loop between strand β4 and helix α4, within helix α6, and between strand β7 and helix α7. Most of these segments are contained within portions of the sequence at the C-terminal end of the β8 barrel that comprises the Zn2+ binding site and that envelop the active site pocket.
Figure 6.
Stereo ribbon diagram comparing molecules 2 of holo and apo mADA. Several secondary structural elements are labeled including some elements of the β8α8 TIM barrel, three α-helices (αA, αB and αC) located between strand β1 and helix α1, and helix αD located between strand β7 and helix α7. Holo mADA is shown in gold and apo mADA in green except for 5 peptide segments containing residues differing by 1 Å or more, where they are shown in cyan and red, respectively. The four tryptophan side chains for each molecule are labeled and shown as magenta or dark blue sticks, respectively, and the zinc ion is labeled and shown in dark slate gray. The first and second peptide segment (37–45 and 51–62, Figure 5) are located between helices αA and αB and between helices αB and αC, respectively. The third segment, 185–196, is located between strand β4 and helix α4, the fourth (242–254) within helix α6 and the fifth (270–276) between helices α7 and αD.
Under the conditions used for data collection, both holo and apo mADA contain a molecule of glycerol bound in the vicinity of the active site pocket. The glycerol atoms O1 and O3 are bound to the side chains of His17 and Asp19, respectively, and to two water molecules. The six atoms of glycerol (C1, O1, C2, O2, C3, O3) occupy the positions of six of the atoms (C3ξ to O5ξ) of the ribose component of the inhibitor HDPR reported previously (PDB code 1a4m 12). As will be discussed in a subsequent publication, it seems possible that glycerol binding may induce a closed structure of the protein.
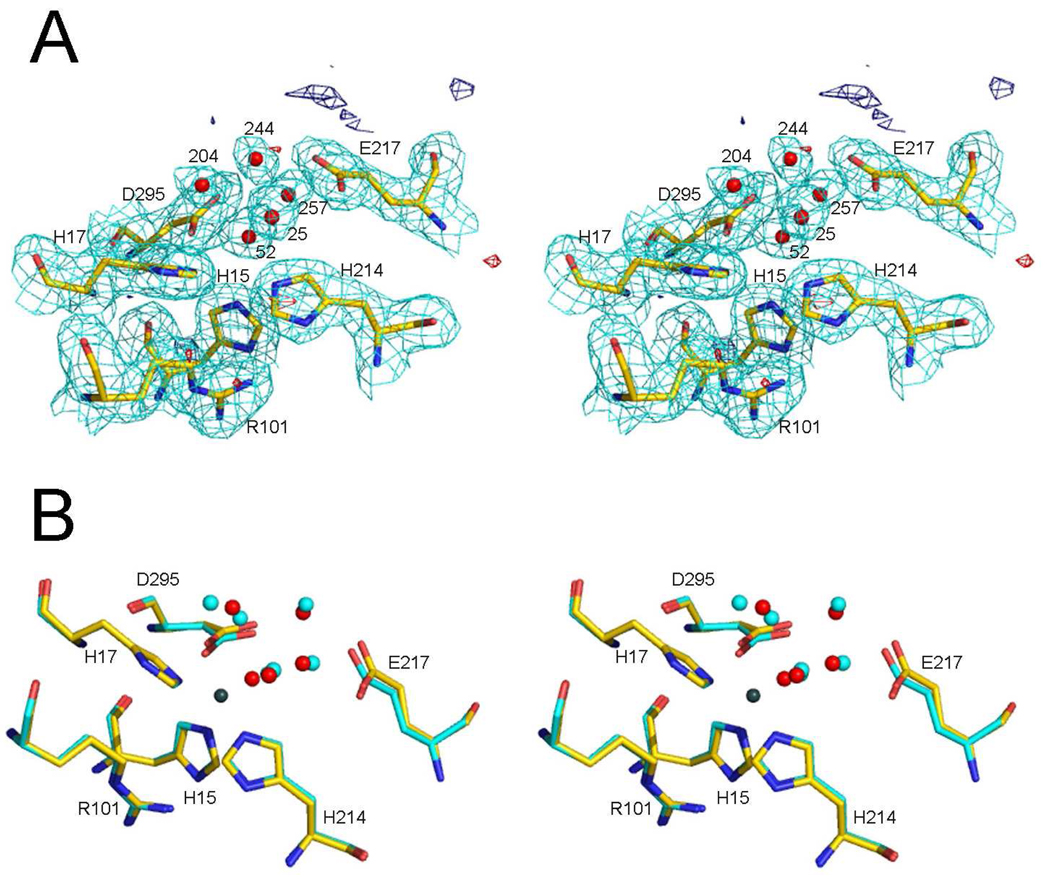
The structure of apo mADA exhibits no evidence for any residual Zn2+ bound in the active site, the final electron density and difference density being featureless at both the expected metal sites. In molecule 1, the structural differences between the holo and apo mADA are negligible in the Zn2+ binding region with bond distances at the metal binding site being highly conserved. The Zn2+ ligands of holo mADA, His15, His17, His214 and Asp295 are located in the same positions in apo mADA and form H-bonds to a water molecule (#52) located about 1.5 Å from the Zn2+ site (Figure 7). This water is H-bonded to atom Nε2 of His238 and to a second water molecule, in addition to the four Zn2+ binding ligands, making it hexacoordinate.
Figure 7.
Stereo views showing comparisons of the zinc-binding regions of holo mADA molecules 1 with apo mADA molecule 1. A) Molecule 1 of apo mADA superimposed on the 2Fo-Fc and Fo-Fc difference electron densities. The 2Fo-Fc map is contoured at the 1σ level (cyan) using an atomic radial cutoff of 1.6 Å; the Fo-Fc map is contoured at the +3σ and −3σ levels (dark blue and red) respectively using an atomic radial cutoff of 4 angstroms. The atom coloring is carbon (green), nitrogen (blue), oxygen (red). In addition to three histidine, one arginine, one glutamate and one aspartate residues of the zinc-binding region, five water molecules are shown. B) Superposition of molecule 1 of holo and apo mADA showing the same resides and water molecules as panel A plus 5 water molecules of holo mADA (cyan spheres) and the Zn2+ (gray). The atom coloring is the same as in panel A except for the carbon atoms of holo mADA which are shown in cyan.
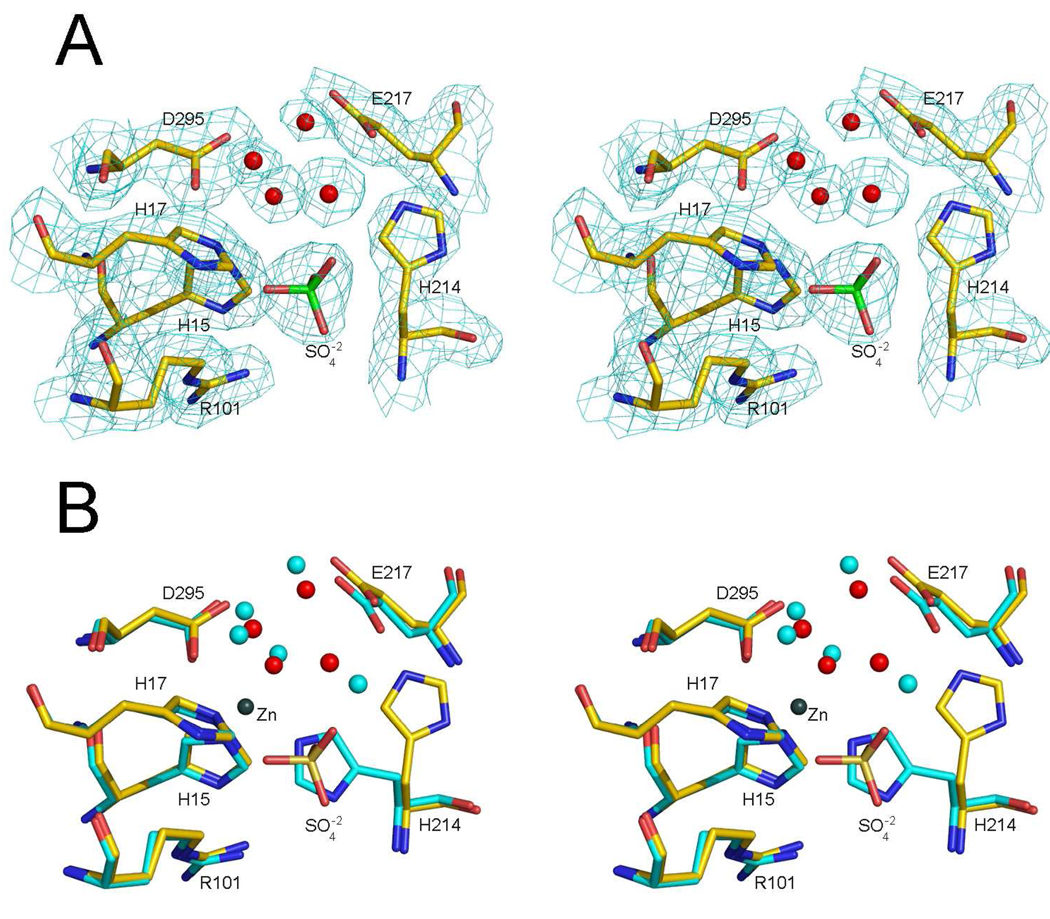
In molecule 2 of apo mADA, the change from the holo mADA is more substantial, (Figure 8), with the side chain of His214 having moved to a new position, about 5.5 Å away, via a torsional rotation of approximately 90° about the Cβ-Cγ bond. In its place a sulfate anion is bound to the protein. In its new orientation the histidine side chain forms an H-bond to the Oδ1 atom of Glu217. The new position of the histidine side chain and of the sulfate anion fits well to the electron density of a simulated annealing omit map computed with His214 of molecule removed. Attempts to refine His214 in two alternated conformations resulted in unsatisfactory Fo-Fc difference maps in contrast to the sulfate anion. In its current configuration, His214 of molecule 2 forms an H-bond with to the Oδ1 atom of Glu217 whereas the sulfate anion forms H-bonds or electrostatic interactions with the surrounding histidine side chains and water molecules.
Figure 8.
Stereo views showing comparisons of the zinc-binding regions of holo mADA molecules 2 with apo mADA molecule 2. A) Molecule 2 of apo mADA superimposed on the simulated annealing omit difference electron densitie. The omit map is contoured at the 1σ level (cyan) using an atomic radial cutoff of 1.6 Å. The atom coloring is carbon (green), nitrogen (blue), oxygen (red). In addition to three histidine, one argenine, one glutamate and one aspartate residues of the zinc-binding region, five water molecules are shown. B) Superposition of molecule 2 of holo and apo mADA showing the same resides and water molecules as panel A plus 5 water molecules of holo mADA (cyan spheres) and the Zn2+ (gray). The atom coloring is the same as in panel A except for the carbon atoms of holo mADA which are shown in cyan.
4. Discussion
Some studies have focused on the structural differences between the apo and holo proteins. For example, structural studies of the apo protein of Cu, Zn superoxide dismutase 36,37 have shown that the apo protein retains most secondary and tertiary structure of the holo form but the metal-binding sites and some related regions are disordered and highly mobile. There can be, however, technical difficulties in addressing the question of the role of a metal cofactor because proteins in the absence of metal may form aggregates or be so unstable as to preclude NMR or X-ray studies.
In the present study, we have taken advantage of both of the high resolution structures and the changes in 19F NMR signal from 6-19F-Trp residues to indicate structural changes. The X-ray data of Figure 6 indicates differences only near the Zn2+ binding site. In contrast, the NMR data show differences in chemical shift for three 19F NMR peaks (Trp 117, 161, and 264) indicating that the chemical environment or local structure around these residues is different in the presence compared to the absence of Zn2+. Trp117, 161 and 264 are distant (more than 12 Å away) from the Zn2+ binding site. Trp117 is located in a small helix of the large loop between central β2 strand and peripheral α2 helix (Figure 6). Trp161 is located in the peripheral α3 helix. Trp264 and Trp272 are located in the large connecting loop between β7 and α7. Moreover, the four tryptophan residues can be divided into two groups by spatial distance; Trp117 and Trp161 are spatially adjacent, as are Trp264 and Trp272. The distance between two fluorine nuclei is about 8.5 Å for Trp117 and Trp161, and 9.2 Å for Trp264 and Trp272. Trp272, which shows no change in 19F NMR chemical shift, is located in a small cul de sac between helices “D” and α7 (Figure 6) and is apparently isolated from the large active site pocket.
It appears that there is some limited variability in the structure of both holo and apo mADA between molecules within the same crystal (Figure 5A) and between molecules of the holo and apo forms of the enzyme (Figure 5B). These localized differences can reach up to 1.5 to 2.0 Å displacement of Cα atoms. Given that the crystallographic data show such relatively minor structural changes, the changes in protein stability (Figure 2) and in the m value (Table 2) between the apo and holo proteins are surprising but perhaps not unusual. Indeed, if only the limited crystal structures differences between the apo and holo proteins occurred in solution, it would be almost impossible to explain differences in stability. We suggest, therefore, that the NMR data shown in Figure 4A, where the molecular structures are not constrained by the crystal lattice, more accurately represents these differences. These data show that removing of the Zn2+ cofactor affects the chemical environment or local structure changes around Trp117, 161 and 264 (but not Trp272) even though these tryptophan residues are distant from the Zn2+ binding site of mADA (see Figure 6). From the crystal structure.
Clearly, changes in just 3 tryptophan residues are only representative of dynamic/structural differences throughout the molecule. With regard to the lower m values in the apo protein, recent results 38,39 suggest that urea m values are determined mainly by backbone exposure to solvent on unfolding as discussed by Pace et al 40. Thus the apo protein would appear to exhibit more or larger breathing motions than the holo protein. It is of interest there are many disease-associated point mutations located around Trp117 or Trp161. For example, the mutations of P104L, L106V and L107P, all close to Trp117, are related to SCID or partial ADA-deficiency 9,41,42. The disease-related mutations G74V, G74D, G74C, R76W, P126Q, and V129M also appear to be near the Trp117 and Trp161 regions in structure. It is possible that those residues are related to the Zn2+ cofactor as are Trp117 and 161, and a single mutation at any of these residues could be propagated to the Zn2+ cofactor to affect the stability and activity of the protein even though the protein retains a native or wild type-like structure.
Acknowledgements
This work was supported, in whole or in part, by National Institutes of Health Grants DK13332 (to C.F.) and HL49413, HL58141, HL73813, and HL95315 (to E.D.C.). C. F. is grateful to Robert A. Alberty for stimulating his interest in enzymology as a graduate student, mentor and friend.
References
- 1.Hasnain SS. J Synchrotron Radiat. 2004;11:7. doi: 10.1107/s0909049503024166. [DOI] [PubMed] [Google Scholar]
- 2.Wittung-Stafshede P. Acc Chem Res. 2002;35:201. doi: 10.1021/ar010106e. [DOI] [PubMed] [Google Scholar]
- 3.Wilson CJ, Apiyo D, Wittung-Stafshede P. Q Rev Biophys. 2004;37:285. doi: 10.1017/S003358350500404X. [DOI] [PubMed] [Google Scholar]
- 4.Wittung-Stafshede P. Inorg Chem. 2004;43:7926. doi: 10.1021/ic049398g. [DOI] [PubMed] [Google Scholar]
- 5.Gudiksen KL, Urbach AR, Gitlin I, Yang J, Vazquez JA, Costello CE, Whitesides GM. Anal Chem. 2004;76:7151. doi: 10.1021/ac0488560. [DOI] [PubMed] [Google Scholar]
- 6.Coyne HJ, Ciofi-Baffoni S, Banci L, Bertini I, Zhang L, George GN, Winge DR. J Biol Chem. 2007 doi: 10.1074/jbc.M610303200. [DOI] [PubMed] [Google Scholar]
- 7.Giblett ER, Anderson JE, Cohen F, Pollara B, Meuwissen HJ. Lancet. 1972;2:1067. doi: 10.1016/s0140-6736(72)92345-8. [DOI] [PubMed] [Google Scholar]
- 8.Hershfield MS, Mitchell BS. Immunodeficiency diseases caused by adenosine deaminase deficiency and purine nucleoside phosphorylase deficiency. In: Scriver CR, Beaudet AL, Sly WS, Valle D, editors. The Metabolic and Molecular Bases of Inherited Disease. 8th ed. New York: McGraw-Hill Inc.; 2001. p. 2585. [Google Scholar]
- 9.Hershfield MS. Curr Opin Immunol. 2003;15:571. doi: 10.1016/s0952-7915(03)00104-3. [DOI] [PubMed] [Google Scholar]
- 10.Wilson DK, Rudolph FB, Quiocho FA. Science. 1991;252:1278. doi: 10.1126/science.1925539. [DOI] [PubMed] [Google Scholar]
- 11.Wilson DK, Quiocho FA. Nat Struct Biol. 1994;1:691. doi: 10.1038/nsb1094-691. [DOI] [PubMed] [Google Scholar]
- 12.Wang Z, Quiocho FA. Biochemistry. 1998;37:8314. doi: 10.1021/bi980324o. [DOI] [PubMed] [Google Scholar]
- 13.Farber GK, Petsko GA. Trends Biochem Sci. 1990;15:228. doi: 10.1016/0968-0004(90)90035-a. [DOI] [PubMed] [Google Scholar]
- 14.Branden C-I. Current Opinion in Structural Biology. 1991;1:978. doi: 10.1016/s0959-440x(97)80152-2. [DOI] [PubMed] [Google Scholar]
- 15.Nagano N, Orengo CA, Thornton JM. J Mol Biol. 2002;321:741. doi: 10.1016/s0022-2836(02)00649-6. [DOI] [PubMed] [Google Scholar]
- 16.Kurz LC, Frieden C. Biochemistry. 1987;26:8450. doi: 10.1021/bi00399a063. [DOI] [PubMed] [Google Scholar]
- 17.Cooper BF, Sideraki V, Wilson DK, Dominguez DY, Clark SW, Quiocho FA, Rudolph FB. Protein Sci. 1997;6:1031. doi: 10.1002/pro.5560060509. [DOI] [PMC free article] [PubMed] [Google Scholar]
- 18.Bhaumik D, Medin J, Gathy K, Coleman MS. J Biol Chem. 1993;268:5464. [PubMed] [Google Scholar]
- 19.Sideraki V, Mohamedali KA, Wilson DK, Chang Z, Kellems RE, Quiocho FA, Rudolph FB. Biochemistry. 1996;35:7862. doi: 10.1021/bi952920d. [DOI] [PubMed] [Google Scholar]
- 20.Pace CN. Methods Enzymol. 1986;131:266. doi: 10.1016/0076-6879(86)31045-0. [DOI] [PubMed] [Google Scholar]
- 21.Shu Q, Frieden C. Biochemistry. 2004;43:1432. doi: 10.1021/bi035651x. [DOI] [PubMed] [Google Scholar]
- 22.Kurz LC, LaZard D, Frieden C. Biochemistry. 1985;24:1342. doi: 10.1021/bi00327a011. [DOI] [PubMed] [Google Scholar]
- 23.Grynkiewicz G, Poenie M, Tsien RY. J Biol Chem. 1985;260:3440. [PubMed] [Google Scholar]
- 24.Atar D, Backx PH, Appel MM, Gao WD, Marban E. J Biol Chem. 1995;270:2473. doi: 10.1074/jbc.270.6.2473. [DOI] [PubMed] [Google Scholar]
- 25.McCall KA, Fierke CA. Anal Biochem. 2000;284:307. doi: 10.1006/abio.2000.4706. [DOI] [PubMed] [Google Scholar]
- 26.Bretthorst GL, Kotyk JJ, Ackerman JJ. Magn Reson Med. 1989;9:282. doi: 10.1002/mrm.1910090214. [DOI] [PubMed] [Google Scholar]
- 27.Otwinowski Z, Minor W. Meth Enzymol. 1997;276:307. doi: 10.1016/S0076-6879(97)76066-X. [DOI] [PubMed] [Google Scholar]
- 28.CCP4. Acta Crystallogr. D Biol Crystallogr. 1994;50:760. doi: 10.1107/S0907444994003112. [DOI] [PubMed] [Google Scholar]
- 29.Murshudov GN, Vagin AA, Dodson EJ. Acta Crystallogr D Biol Crystallogr. 1997;53:240. doi: 10.1107/S0907444996012255. [DOI] [PubMed] [Google Scholar]
- 30.Winn MD. J Synchrotron Radiat. 2003;10:23. doi: 10.1107/s0909049502017235. [DOI] [PubMed] [Google Scholar]
- 31.Kleywegt GJ, Brunger AT. Structure. 1996;4:897. doi: 10.1016/s0969-2126(96)00097-4. [DOI] [PubMed] [Google Scholar]
- 32.Emsley P, Cowtan K. Acta Crystallogr D Biol Crystallogr. 2004;60:2126. doi: 10.1107/S0907444904019158. [DOI] [PubMed] [Google Scholar]
- 33.Pace CN, Scholtz JM. Protein structure : a practical approach. In: Creighton TE, editor. Protein structure : a practical approach. 2nd ed. Oxford ; New York: IRL Press at Oxford University Press; 1997. p. 299. [Google Scholar]
- 34.Wommer S, Rival S, Heinz U, Galleni M, Frere JM, Franceschini N, Amicosante G, Rasmussen B, Bauer R, Adolph HW. J Biol Chem. 2002;277:24142. doi: 10.1074/jbc.M202467200. [DOI] [PubMed] [Google Scholar]
- 35.Shu Q, Frieden C. J Mol Biol. 2005;345:599. doi: 10.1016/j.jmb.2004.10.057. [DOI] [PubMed] [Google Scholar]
- 36.Strange RW, Antonyuk S, Hough MA, Doucette PA, Rodriguez JA, Hart PJ, Hayward LJ, Valentine JS, Hasnain SS. J Mol Biol. 2003;328:877. doi: 10.1016/s0022-2836(03)00355-3. [DOI] [PubMed] [Google Scholar]
- 37.Banci L, Bertini I, Cramaro F, Del Conte R, Viezzoli MS. Biochemistry. 2003;42:9543. doi: 10.1021/bi034324m. [DOI] [PubMed] [Google Scholar]
- 38.Auton M, Holthauzen LM, Bolen DW. Proc Natl Acad Sci U S A. 2007;104:15317. doi: 10.1073/pnas.0706251104. [DOI] [PMC free article] [PubMed] [Google Scholar]
- 39.Cannon JG, Anderson CF, Record MT., Jr J Phys Chem B. 2007;111:9675. doi: 10.1021/jp072037c. [DOI] [PubMed] [Google Scholar]
- 40.Pace CN, Huyghues-Despointes BM, Fu H, Takano K, Scholtz JM, Grimsley GR. Protein Sci. 2010;19:929. doi: 10.1002/pro.370. [DOI] [PMC free article] [PubMed] [Google Scholar]
- 41.Scriver CR. The metabolic and molecular basis of inherited disease. 8th ed. New York: McGraw-Hill Medical Pub. Division; 2001. [Google Scholar]
- 42.Hershfield MS. Semin Hematol. 1998;35:291. [PubMed] [Google Scholar]


