Abstract
The interleukin-10-deficient (IL10−/−) mouse develops colon inflammation in response to normal intestinal microflora and has been used as a model of Crohn's disease. Short-Column LCMS metabolite profiling of urine from IL10−/− and wild-type (WT) mice was used, in two independent experiments, to identify mass spectral ions differing in intensity between these two genotypes. Three differential metabolites were identified as xanthurenic acid and as the glucuronides of xanthurenic acid and of α-CEHC (2,5,7,8-tetramethyl-2-(2′-carboxyethyl)-6-hydroxychroman). The significance of several differential metabolites as potential biomarkers of colon inflammation was evaluated in an experiment which compared metabolite concentrations in IL10−/− and WT mice housed, either under conventional conditions and dosed with intestinal microflora, or maintained under specific pathogen-free (SPF) conditions. Concentrations of xanthurenic acid, α-CEHC glucuronide, and an unidentified metabolite m/z 495−/497+ were associated with the degree of inflammation in IL10−/− mice and may prove useful as biomarkers of colon inflammation.
1. Introduction
Crohn's disease is a chronic relapsing inflammatory disorder of the bowel which is characterized by recurring episodes of inflammation especially in the small and large intestine accompanied by abdominal pain and persistent diarrhea [1]. Crohn's disease has been attributed to a dysregulation of the intestinal mucosal immune response towards normal intestinal microflora and results from a complex interaction of genetic [2, 3] and environmental factors [4]. The complex aetiology and absence of a cure means that the management of Crohn's disease requires the continuing assessment of the inflammation status of the patient so that the efficacy of treatments can be determined. Current methods of assessing bowel inflammation require the sampling of intestinal tissue for histological evaluation or blood for measuring plasma biomarkers of inflammation. Metabolomic characterization, largely by NMR, of urine [5], faeces [6–8], and colon mucosal tissues [9] from Crohn's disease patients has revealed a range of metabolites whose concentrations are perturbed in association with established inflammation. Urinary biomarkers predictive of inflammation status would be preferable to sampling of intestinal tissue or blood as the collection of urine samples is relatively noninvasive and multiple samples can more readily be obtained.
A number of metabolomic studies of mouse models of Crohn's disease have been used to study the biochemical changes associated with inflammation and to identify possible biomarkers. LCMS metabolite profiling of serum from mice treated with dextran sulphate sodium (DSS) to induce colitis showed that colon inflammation was increased by DSS-inhibition of stearoyl-CoA desaturase 1 (SCD1)-mediated oleic acid biogenesis [10]. Examination by NMR of colonic mucosal samples from Sprague Dawley rats treated with 2% carrageenan for 1 or 2 weeks to induce inflammation showed increases in concentrations of creatinine, phosphatidylcholine and unsaturated lipids [11]. The interleukin-10-deficient (IL10−/−) mouse shows physiological, and biochemical similarities to Crohn's disease [3] including the development of intestinal inflammation in response to the presence of intestinal microflora and has been widely used as a model of Crohn's disease [12]. Interleukin-10 (IL10) is an immunosuppressive cytokine that down-regulates cell-mediated immune responses and has an important role in maintaining intestinal mucosal immunity [13]. Metabolic profiling of plasma of IL10−/− mice by NMR indicated the inflamed state was characterised by impaired metabolism of glyco- and lipoproteins and loss of energy homeostasis with higher levels of fatty acid oxidation and glycolysis and interconversion of amino acids to produce energy [14]. NMR metabolite profiling of 24-hour pooled urine [15] and GCMS analysis of spot urine samples [16] from IL10−/− mice identified changes in urinary metabolites associated with colon inflammation providing insights into biochemical changes associated with disease progression. In particular, fucose and xanthurenic acid were identified as early biomarkers of inflammation in the urine of IL10−/− mice [17].
The use of multiple metabolomic platforms extends the range of metabolites and hence the possible perturbations in biochemical pathways that may be observed. Recently, in a cross-platform comparison of metabolomics methods, LCMS was recommended as providing the best combination of versatility and robustness on a single platform [18]. Direct infusion (DI) MS/MS [19, 20] is a recently developed metabolomic analysis tool developed for the rapid screening of complex biological samples. DI-MS/MS combines the analytical power of MS/MS for metabolite characterisation with the advantages of minimal sample handling and high sample throughput.
For nontargeted urinary metabolite profiling, we have modified the DI-MS/MS procedure using a short 20-mm reversed-phase column (Short-Column LCMS) to separate and discard to waste highly ionic material and urea which would otherwise dominate the MS data [21]. In this study, we demonstrate the use of this methodology to rapidly screen sample sets and to identify metabolite differences between the urine from IL10−/− and wild-type mice that were not detected with other techniques. Structural identification of three of these differential metabolites using MS/MS, high resolution MS, and chemical synthesis has provided further insight into the metabolic changes associated with the IL10−/− deficiency. Finally the usefulness of these metabolites as biomarkers of colon inflammation was tested in an experiment where IL10−/− mice were either dosed with intestinal microflora to initiate inflammation or maintained under specific pathogen-free (SPF) conditions to limit the development of inflammation.
2. Materials and Methods
2.1. Animal Experiments
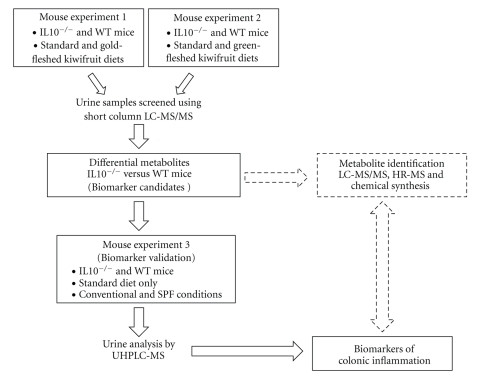
All animal studies were reviewed and approved by the Crown Research Institute Animal Ethics Committee in Hamilton, New Zealand, according to the New Zealand Animal Welfare Act (1999). Male IL10−/− mice of C57BL/6 background strain (B6.129P2-Il10tm1Cgn) and wild-type C57BL/6 mice (The Jackson Laboratory, Bar Harbor, Maine, USA) of average age upon arrival of 4, 5.3, and 4.4 weeks old were used for experiments 1, 2 [16], and 3 [17], respectively. For experiments 1 and 2 (Figure 1), each mouse was housed individually in a shoebox-style cage under conventional conditions and fed powdered AIN76A diet with food intake adjusted to equal the mean amount of food consumed by IL10−/− mice the previous week. Four days after arrival, mice were orally dosed with a mixture of Enterococcus faecalis, E. Faecium, and complex intestinal flora to ensure the same initial microbial exposure and the development of consistent intestinal inflammation [22]. In experiment 1, yellow-fleshed kiwifruit (Actinidia chinensis) and in experiment 2, green-fleshed kiwifruit (A. delicoisa “Hayward”), fruit extracts were added to the diets of some mice [16] to test their possible anti-inflammatory effects [23]. Transcriptomic and proteomic results of diet treatments will be reported elsewhere. In experiment 3, all mice were fed powdered AIN76A diet only. Approximately half the IL10−/− and wild-type mice were maintained under conventional conditions as above and the other half were maintained under SPF conditions and not dosed with intestinal microflora to maintain a lower level of colon inflammation in the IL10−/− mice throughout the experiment [17]. Spot urine samples were collected from each experiment on four collection days when the average age of mice was 5.5, 7, 8.5, and 10.5 weeks old (experiment 1), 7, 9, 11.5 and 12 weeks old (experiment 2) [16], and 6.3, 8.0, 9.4 and 10.4 weeks old (experiment 3) [17]. Final urine samples for experiments 1 and 2 were collected immediately before mice were euthanized and after a cycle of feeding, fasting, and feeding designed to standardize the timing of the final food intake. Mice from each treatment of experiment 3 were euthanized after three and six weeks for histology and measurement of serum amyloid-A (SAA) protein concentrations [17].
Figure 1.
Overall design of mouse experiments 1, 2, and 3 and process used to identify and validate urinary biomarkers of colonic inflammation in the IL10−/− mouse model of Crohn's disease.
2.2. Sample Preparation of Urine for LCMS
Urine (4 μL) was diluted with 0.1% formic acid (200 μL) in an Eppendorf tube, centrifuged at 12100 g for 2 minutes to precipitate particulates and an aliquot transferred to a vial before injection into the LCMS. Randomised batches of samples for each time point were analyzed sequentially.
2.3. Short-Column LCMS for Biomarker Identification
Samples were analyzed by a rapid LC-MS procedure [21] using a Thermo Surveyor pump and auto-sampler connected to a Thermo LTQ linear ion-trap mass spectrometer (Thermo Electron Corporation, San Jose, CA) using negative electrospray ionization. The capillary temperature was 275°C and source ionization voltage was −4000 V. A 20 μL aliquot of diluted urine was loaded onto a Strata-X on-line extraction cartridge (20 × 2.0 mm, Phenomenex, Torrence, CA) with water (300 μL min−1). For the first 0.5 min. the flow from the cartridge was diverted away from the mass spectrometer to waste, after which all flow entered the electrospray source. Samples were eluted with a gradient comprising water containing 0.1% formic acid (A) and acetonitrile containing 0.1% formic acid (B). The cartridge was eluted with solvent A for 1.5 min, then with a linear gradient to 100% B over 3 min and held at 100% B for 3 min. The initial solvent (100% A) was restored over a 0.5-minute linear gradient and eluted for 1.5 min at 600 μL min−1 and for 0.5 min at 300 μL min−1. The ion trap was programmed to collect an MS1 spectrum from 100 to 1000 m/z followed by MS2 and MS3 spectra from collision-induced dissociation of the most intense ions in the MS1 spectrum, using a 12-second exclusion list to cycle through coeluting ions.
2.4. LCMS/MS for Metabolite Characterization
Samples selected for further metabolite characterisation were analyzed by LCMS/MS in negative and positive electrospray ionization mode using a Thermo LTQ ion-trap mass spectrometer with temperature and voltage settings as above. The HPLC system consisted of two binary Jasco X-LC 3185PU pumps (Jasco Corporation, Tokyo, Japan) connected to a HTS-PAL auto-sampler (CTC Analytics, Zwingen, Switzerland). A 15 μL aliquot of diluted urine was loaded onto a Luna C18 column (150 × 2.0 mm, 5 μm particle size, Phenomenex, Torrence, CA) with a mobile phase flow rate of 200 μL min−1. For the first 3 min, the flow from the column was diverted away from the mass spectrometer to waste, after which all flow entered the electrospray source. Samples were eluted with a gradient comprising water containing 0.1% formic acid (A) and acetonitrile containing 0.1% formic acid (B). The gradient was 95% solvent A for the first 3 min, then a linear gradient to 98% B over 27 min. This was held at 98% B for 3 min and then the initial solvent (95% A) was restored over a 1 min linear gradient and re-equilibrated for 6 min. The ion trap was programmed to collect a MS1 spectrum from 150 to 850 m/z followed by MS2, MS3, and MS4 spectra from collision- induced dissociation of the most intense target ion from a parent ion list comprising candidate negative ions as in Table 1 or the appropriate product ion spectrum. MS data was analysed with XCalibur software (Thermo Electron Corporation, San Jose, CA). Ion trees were compiled from extracted product ion spectra.
Table 1.
Biomarker Candidate ions (m/z) selected from Short-Column LCMS and LC-MS/MS analysis of urine samples from IL10−/− and wild-type (WT) mice.
| Short-Column LCMS Biomarker ion (m/z) | Average fold change Log2 (IL10−/−/WT) | P value | Early difference observed | Identification, |
|---|---|---|---|---|
| Negative ions | ||||
| 204 | 1.8 (expt. 1) | <.01 (FDR <0.05) | Y | xanthurenic acid |
| 2.5 (expt. 2) | <.01 (FDR <0.05) | |||
| 308 | −1.5 (expt. 1) | <.01 (FDR >0.05)) | ? (expt. 1) | unknown |
| −1.8 (expt. 2) | <.01 (FDR <0.05) | Y (expt. 2) | ||
| 380 | −1.1 (expt. 1) | >.01 | N (expt. 1) | xanthurenic acid glucuronide |
| −1.6 (expt. 2) | >.01 | Y (expt. 2) | ||
| 453 | −1.5 (expt. 1) | <.01 (FDR >0.05) | N (expt. 1) | α-CEHC glucuronide |
| −2.0 (expt. 2) | <.01 (FDR <0.05) | Y (expt. 2) | ||
| 495 | −1.5 (expt. 1) | <.01 (FDR >0.05) | Y (expt. 1) | unknown |
| −2.2 (expt. 2) | <.01 (FDR <0.05) | Y (expt. 2) | ||
| Positive ions | ||||
| 206 | 1.7 (expt. 1) | <.01 (FDR <0.05) | Y (expt. 1) | xanthurenic acid |
| 1.2 (expt. 2) | >.01 | N (expt. 2) | ||
| 382 | −1.2 (expt. 1) | >.01 | N (expt. 1) | xanthurenic acid glucuronide |
| −1.5 (expt. 2) | <.01 (FDR <0.05) | Y (expt. 2) | ||
| 497 | −1.2 (expt. 1) | >.01 | Y (expt. 1) | unknown |
| −1.4 (expt. 2) | <.01 (FDR <0.05) | Y (expt. 2) | ||
2.5. UHPLC-MS
Samples were analyzed using a Jasco X-LC UHPLC and HTS-PAL autosampler connected to the LTQ with instrument settings as described above. A 20 μL aliquot of diluted urine was loaded onto a Zorbax SB-C18 UPHLC column (50 × 3.0 mm, 1.8 μm particle size, Agilent Technologies, Santa Clara, CA, USA) with a mobile phase flow rate of 900 μL min−1. For the first 0.7 min, the flow from the column was diverted away from the mass spectrometer to waste, after which all flow entered the electrospray source. Samples were eluted with a gradient comprising water containing 0.1% formic acid (A) and acetonitrile containing 0.1% formic acid (B). The gradient was 95% solvent A for the first 0.5 min, then with a linear gradient to 100% B over 4.5 min and then restored to the initial solvent (95% A) over a 0.5 min linear gradient and re-equilibrated for 2 min. The ion trap was programmed to collect an MS1 spectrum from 100–1000 m/z followed by MS2 and MS3 spectra from collision-induced dissociation of the most intense ions in the MS1 spectrum, using a 4-second exclusion list to cycle through coeluting ions.
2.6. High Resolution (HR) Mass Spectrometry
Salts and urea were removed from a pooled IL10−/− urine sample by elution of the sample and an aqueous wash through a C-18 SPE cartridge, and the 80% methanol eluate was collected for MS analysis. The eluate was infused into an LTQ-FTMS (Thermo Electron Corporation, San Jose, CA, USA) for MS/MS and high resolution MS analysis under both positive and negative electrospray ionisation conditions. HR ions observed for xanthurenic acid were negative ions, MS2 product ion (m/z 204 → 160) m/z 160.0405 ([M–H–CO2]−, C9H5O2N− requires 160.0398) and positive ions MS1m/z 206.0450 ([M+H]+, C10H7O4N+ requires 206.0448), and MS2 product ion (m/z 206 → 188) m/z 188.0344 (C10H5O3N+ requires 188.0347). HR ions observed for α-CEHC glucuronide were MS1m/z 453.1773 ([M–H]−, C22H29O10− requires 453.1761) and m/z 435.1664 ([M–H–H2O]−, source fragment), C22H27O9− requires 435.1655). HR LCMS ions observed for xanthurenic acid glucuronide were MS1m/z 382.0762 ([M+H+], C16H16NO16 requires 382.0774) and MS2 product ion m/z 206.0450 (C10H8NO4 requires 206.0453).
2.7. Bioinformatic Analysis of Short-Column LCMS/MS Data
Raw data (positive and negative ionization) were converted to mzXML format. Nominal mass binning (integer m/z ± 0.5) was carried out for the full m/z range of 100 to 1000 resulting in 901 nominal bins for each individual sample. Signal intensity at nominal mass resolution was retrieved using continuous wavelet transform (CWT) algorithms [24] for peaks within each bin with S/N > 3 (noise defined as 95% quantile of absolute CWT coefficients of scale one). The median peak intensity of the identified peaks in each bin was used to represent the intensity of that bin. Peak intensity was then normalised by a linear regression of log ion intensity against run sequence. Empirical Bayes moderated t statistics [25] (R Limma package) were applied to identify MS1 ions that were significantly different (FDR adjusted P < .05) between samples from IL10−/− and wild-type mice in each experiment. Linear modelling of the full factorial design with three factors (genotype, diet (experiments 1 and 2), and day of collection of urine samples) was also carried out for each experiment. No significant diet effects were found for the metabolites discussed below.
2.8. Metabolite Identification
Possible metabolite structures were inferred from MS/MS ion trees and high resolution FTMS data using web-based metabolite databases [26] and by comparison with authentic compounds and published mass spectral fragmentation pathways where available. Xanthurenic acid was obtained from Aldrich Chemical Co. Xanthurenic acid sulphate dipotassium salt was prepared by chemical synthesis [27]. α-CEHC glucuronide was synthesised following the method of Pope et al. [28].
3. Results
3.1. Short-Column LCMS Data Analysis
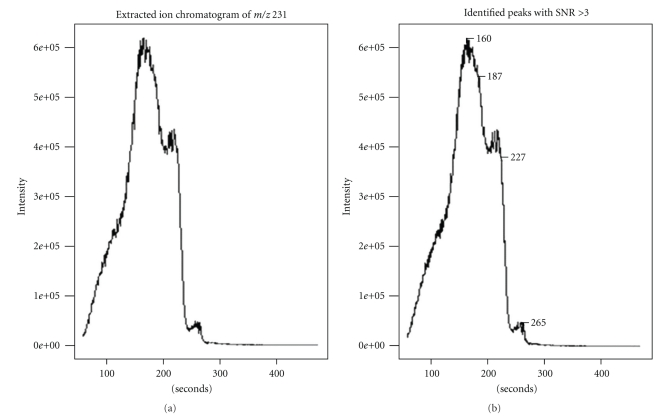
To identify metabolic differences between IL10−/− and wild-type mice, urine samples were collected at four time points from each of two independent experiments (experiments 1 and 2) [16] (Figure 1). Short-Column LCMS using a short (20 mm) solid phase extraction column enabled extremely rapid sample analysis (8 minutes per sample) and avoided blocking the source with salt build-up but provided only minimal chromatographic separation of analytes. The LCMS data for each sample consisted of broad peaks of varying signal intensity on each of the unit mass channels of the mass spectrometer (Figure 2). LCMS data files were processed based on methods developed for the direct-infusion LCMS data analysis [29] but with notable modifications. With the short solid phase extraction column used in these experiments, the signal distributions within mass bins varied with time with variable and non-Gaussian chromatographic peaks. Robust statistics were needed to summarise the signal intensities within each mass bin. Wavelet-based signal identification was used to identify any m/z peaks within each bin with S/N > 3 [24] with the median average of the identified peaks in each bin being used to represent the intensity of that bin.
Figure 2.
Short-Column LCMS ion chromatogram for m/z 231 showing broad partially resolved peaks typically obtained on desorption of analytes from the 20 mm Strata-X on-line extraction cartridge. Wavelet algorithms were used to identify local peaks, and the median intensity of these peaks was taken to represent the intensity of m/z 231.
A progressive decline in ion intensity, as observed by Koulman et al. [20], was observed during the infusion of the large number of urine samples. Several normalization approaches [30] including linear regression, local regression loess and quantile were tested to correct for this decline. The loss of ion intensity was best explained by a linear relationship between the log of ion intensity and the position of samples in the run sequence. Normalization based on this model was carried out for all MS ions and the normalized data were subjected to statistical analysis.
3.2. Selection of Biomarker Candidate Ions from Short-Column LCMS Data
MS1 ions that were significantly different (FDR adjusted P-value P < .05) between samples from IL10−/− and wild-type mice in each experiment were identified using empirical Bayes moderated t-statistics [25] (R Limma package) (Supplementary Materials available online at doi: 10.1155/2011/974701, Table S1). More differential metabolites were found by negative mode Short-Column LCMS, however, there was also a pleasing correspondence between the top candidate ions identified in both experiments (1 and 2) and to a lesser extent between candidate ions identified in both positive and negative ionisation modes. From this initial list, biomarker candidates were selected for further investigation based on additional criteria: the detection and level of significant of ions in both experiments, detection early in the experiment, detection as both positive and negative ions, and the presence of sufficient peak intensity to allow detailed MS/MS analysis. A more complex analysis using linear mixed modelling to incorporate effects of diet and the metabolic variation of individual mice was used to evaluate changes in the metabolic responses over time but did not produce additional candidate ions discriminating the IL10−/− mice. LC-MS/MS analysis of selected samples was then carried out to identify which candidate ions (and ion trees) identified from Short-Column LCMS analysis corresponded to single or to multiple metabolites, to eliminate source fragment ions and adducts, and to obtain expanded MS/MS ion trees of chromatographically resolved metabolites of interest. The mass spectral ions selected by these criteria are listed in Table 1.
3.3. Structural Characterization of Biomarker Candidates
3.3.1. Xanthurenic Acid (m/z 160, 204 [M–H]− and D:\Docs\PUB-MEDCentral\final\JBB2011-974701 206 [M+H]+)
Three major metabolites with m/z 204− were detected in mouse urine by LCMS of which only the major, and earliest eluting metabolite, was elevated in the urine from IL10−/− mice. This metabolite co-eluted with the only significant m/z 160− ion in the samples (also elevated in IL10−/− mice), a likely source fragment which was shown to arise from the m/z 204− ion, (loss of 44 amu) by MS/MS. High resolution FTMS and LCMS comparison with authentic material identified this metabolite as xanthurenic acid.
3.3.2. Xanthurenic Acid Glucuronide (m/z 380 [M–H]− and m/z 382 [M+H]+)
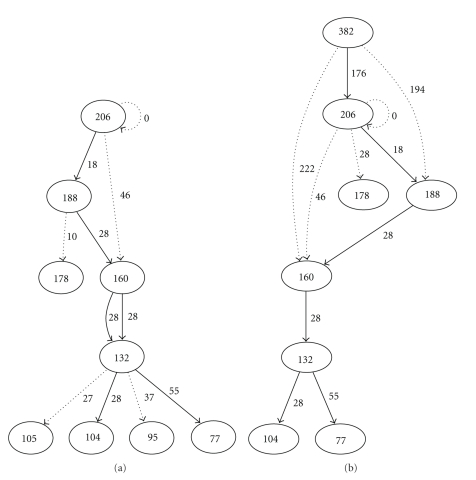
LCMS identified the negative ions at m/z 380 and the positive ion at m/z 382 as resulting from the same metabolite that occurred at lower concentrations in the urine from IL10−/− mice (Table 1). LC-MS/MS showed loss of a glucuronide-derived fragment (176 amu) in both negative and positive ionization modes to form a product ion (m/z 204 or 206 resp.) which underwent further fragmentations as observed for the corresponding xanthurenic acid ions (Figure 3). High resolution MS data is consistent with xanthurenic acid glucuronide, although this remains to be confirmed by chemical synthesis. Xanthurenic acid glucuronide was identified as a differentiating metabolite (FDR adjusted P < .05) in both positive and negative ion LCMS and in both experiments 1 and 2, but with concentrations changing in the opposite direction to that of its aglycone (Table 1).
Figure 3.
LC-MS/MS ion trees (positive ions) for A, xanthurenic acid (m/z 206 [M–H]−) and B, xanthurenic acid glucuronide (m/z 382 [M–H]−) showing major (>80% relative intensity), intermediate (≥30 ≤80%), and minor (>1 <30%) MS/MS fragmentations using bold, normal and dotted arrows, respectively.
3.3.3. α-CEHC Glucuronide (2,5,7,8-Tetramethyl-2-(2′-Carboxyethyl)-6-Hydroxychroman Glucuronide, m/z 453 [M–H]−)
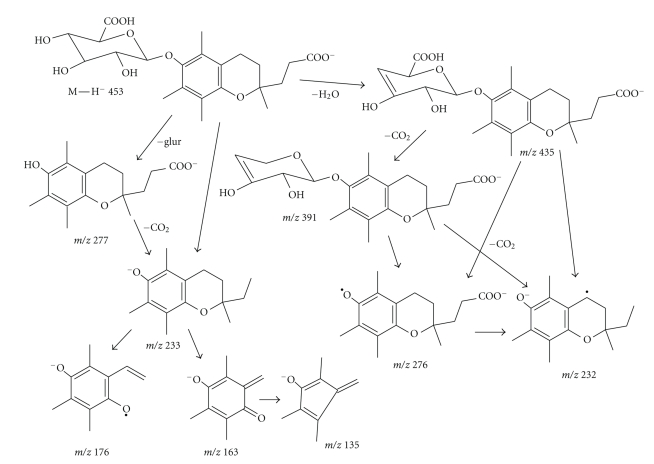
The ion (m/z 453−) occurred at lower concentrations in urine from IL10−/− mice. A metabolite (M+ 454) not containing nitrogen was assumed. LC-MS/MS analysis identified this metabolite as a second glucuronide (MS2 loss of 176 amu to m/z 277) with a subsequent loss of 44 amu, implying a glucuronide acid conjugate. The molecular formula therefore requires a minimum of nine oxygen atoms. FTMS analysis indicated that the major m/z 453− ion in the sample showed the required ion tree and had an accurate mass of 453.1773. Constraining any molecular formula to a minimum of 9 oxygen atoms gave C22H29O10− as the most likely formula for this ion (theoretical value 453.1761). Similarly, the major fragment ion at m/z 435.1664 (loss of 18 amu) is assigned a formula of C22H27O9 (theoretical value 435.1655). The molecular formula is then C22H30O10 with C16H22O4 being the formula of the aglycone (a carboxylic acid). A search for such aglycones in the Human Metabolome Database [31] suggested that this metabolite was the glucuronide of α-CEHC. The MS/MS fragmentation appeared consistent with this structure (Figure 4). α-CEHC glucuronide was prepared by synthesis [28] and the MS/MS and LCMS matched that of the urine metabolite. α-CEHC is a major water-soluble metabolite of vitamin E, which circulates in the blood and is excreted in the urine [28].
Figure 4.
LC-MS/MS fragmentations for α-CEHC (2,5,7,8-tetramethyl-2-(2′-carboxyethyl)-6-hydroxychroman) glucuronide.
3.3.4. Unidentified Metabolites
The m/z 284− ion was detected amongst the most significant differentiating species between IL10−/− and wild-type mice (Table S1), and xanthurenic acid sulphate, a known urinary metabolite of xanthurenic acid [27], seemed a likely candidate. UHPLC-MS analysis, however, showed that this ion was an isotopologue of m/z 283−, also a highly significant differentiating species (Table S1), and eluted at a later retention time than authentic xanthurenic acid sulphate [27]. Xanthurenic acid sulphate (m/z 284 [M–H]−) was not detected by UHPLC-MS (Experiment 3) using an authentic standard.
Two additional ions (m/z 308− and m/z 497+/495−) were significantly reduced in urine from IL10−/− mice (Table 1). The first metabolite (m/z 308) was found only as a negative ion, and LC-MS/MS analysis (MS2 m/z 124, MS3 m/z 107, 80) suggested a taurine conjugate. The second pair of ions (m/z 497+/495−) would seem to be derived from the same metabolite as they appear at the same retention time on LCMS/MS with the same losses of 147 and 75 (glycine) amu from the corresponding pseudomolecular ions. The structures of these metabolites remain unknown.
3.4. Evaluation of Candidates as Biomarkers of Colon Inflammation
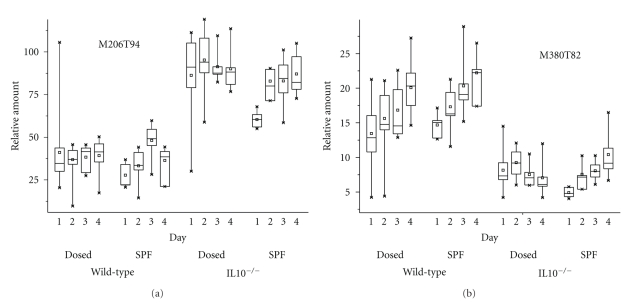
The biological significance of these metabolic differences as biomarkers of colon inflammation was evaluated in experiment 3 that compared IL10−/− and wild-type mice housed either under conventional conditions and dosed with intestinal microflora or maintained under SPF conditions without dosing with intestinal microflora [17]. The rationale for this experiment was that biochemical differences arising from colon inflammation in IL10−/− mice should be reduced when these mice were maintained under SPF conditions [3]. Biochemical differences arising from other genetic differences between the mouse strains [32] or as a consequence of microbial dosing should not be similarly affected. IL10−/− mice housed under these SPF conditions showed decreased colon inflammation as measured by histology scores and SAA levels in serum [17]. Urine samples were analyzed using UHPLC-MS in both positive and negative ionisation modes with both targeted analysis of biomarker candidates and untargeted metabolic profiling of all metabolites. The top scoring metabolites identified as differing between IL10−/− and wild-type mice by untargeted analysis included xanthurenic acid, xanthurenic acid glucuronide, and α-CEHC glucuronide among the top 20 candidates (Supplementary Table S2: ion labels below refer to this table). Amongst the positive ions m/z 206 (M206T94), with isotopologues m/z 207 and 208, was the top ranking candidate showing an average 2.4-fold increase (P < .0001) in urine from IL IL10−/− mice. However, the corresponding negative ion (M204T91) was only the 21st ranking candidate despite the high ranking for this ion in previous experiments. Targeted analysis of xanthurenic acid monitoring the m/z 204− MS1 ion in negative mode showed interference from a closely eluting metabolite.
Xanthurenic acid concentrations were significantly higher in dosed mice (P = .002) with this increase being more apparent between the dosed and SPF IL10−/− animals (P < .001). In addition, SPF IL10−/− mice showed an increase in xanthurenic acid concentrations from the earliest timepoint (P < .001) supporting the hypothesis that xanthurenic acid is an early biomarker of inflammation and consistent with the increasing histology scores and SAA concentrations measured for these mice [17].
UHPLC-MS analysis confirmed that xanthurenic acid glucuronide (M382T85 and M380T82) occurred at significantly higher concentrations in urine from WT mice (P < .0001) (Figure 5) and showed that, while concentrations of this metabolite increased throughout the experiment in both types of mice (P < .001), concentrations in IL10−/− mice were not affected by housing conditions (SPF or conventional) (P = .5). We therefore conclude that the difference in concentrations of this metabolite between IL10−/− and WT mice represents a metabolic difference between the two mouse strains unrelated to the state of inflammation [17, 32]. Concentrations of this metabolite increased with time in IL10−/− mice under SPF conditions. However, similar increases also occurred in WT mice and would seem to be related to the age of the mice rather than to inflammation.
Figure 5.
Relative concentrations of xanthurenic acid (M206T94) and xanthurenic acid glucuronide (M380T82, m/z 380 ([M–H]−), identified by LCMS/MS) measured by UHPLC-MS in urine samples from IL10−/− and wild-type (WT) mice housed either under conventional conditions and dosed with intestinal microflora or maintained under specific pathogen free (SPF) throughout the experiments. Urines samples were collected 7, 19, 29, and 36 days after dosing [17].
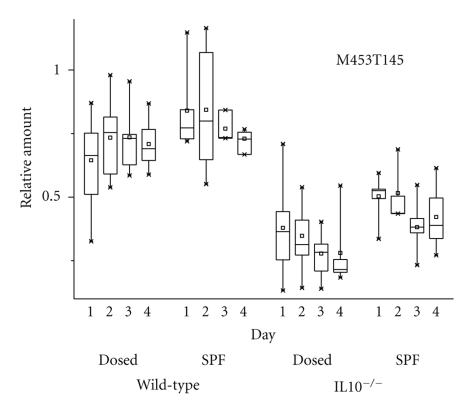
UHPLC-MS analysis showed that α-CEHC glucuronide (M453T145) occurred at significantly higher concentrations in urine from WT mice (Figure 6) and at higher concentrations when either IL10−/− or WT mice were housed under SPF conditions (P < .0001). The concentration of this metabolite in urine from WT mice was unaltered over the course of the experiment (P = .5) but decreased (P = .02) in the IL10−/− mice under both SPF and conventional conditions. Overall these results suggest that reduced concentrations of α-CEHC glucuronide may serve as a marker of inflammation status in the IL10−/− mice.
Figure 6.
Relative concentrations of α-CEHC glucuronide measured by UHPLC-MS in urine samples from IL10−/− and wild-type (WT) mice housed either under conventional conditions and dosed with intestinal microflora or maintained under specific pathogen free (SPF) throughout the experiments. Urines samples were collected 7, 19, 29, and 36 days after dosing [17].
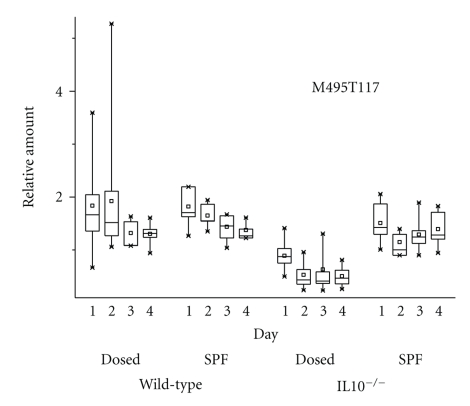
The metabolite with ions M495T117/M497T116 appeared as the 29th and 41st ranking ions that were significantly different between IL10−/− and wild-type samples. Both ions occurred at significantly lower concentrations (P < .001) in urine from IL10−/− mice (Figure 7) confirming results obtained by Short-Column LCMS; however, this suppression was partially removed by SPF treatment (Treatment effect P < .001 for m/z 495 and P = .03 for the less intense m/z 497 ion). Metabolite concentrations in urine from IL10−/− mice were significantly reduced as a result of microbial dosing (P < .0001). Concentrations of the more intense m/z 495− ion were also significantly reduced with time (P = .014 overall; P < .001 for IL10−/− mice). These results suggest that reduced concentrations of this metabolite were related to the extent of colon inflammation in the IL10−/− mouse.
Figure 7.
Relative concentrations of biomarker M495T117 (m/z 495−) measured by UHPLC-MS in urine samples from IL10−/− and wild-type (WT) mice housed either under conventional conditions and dosed with intestinal microflora or maintained under specific pathogen free (SPF) throughout the experiments. Urines samples were collected 7, 19, 29, and 36 days after dosing [17].
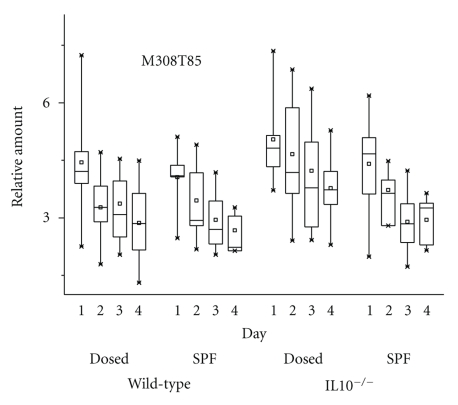
UHPLC-MS analysis confirmed that the metabolite with m/z 308 (M308T85) occurred at slightly higher concentrations in urine from IL10−/− mice (P < .0001) and showed that concentrations were reduced in urine from IL10−/− mice under SPF conditions (P = .003) (Figure 8). However, the downward trend in urinary concentrations of this metabolite with time for all treatments (P < .0001) suggested that its elevated concentrations in IL10−/− mice was not associated with colon inflammation.
Figure 8.
Relative concentrations of biomarker M308T85 (m/z 308−) measured by UHPLC-MS in urine samples from IL10−/− and wild-type (WT) mice housed either under conventional conditions and dosed with intestinal microflora or maintained under specific pathogen free (SPF) throughout the experiments. Urines samples were collected 7, 19, 29, and 36 days after dosing [17].
4. Discussion
Xanthurenic acid was previously identified by GCMS as an early biomarker of inflammation in urine from IL10−/− mice [16, 17] and is a product of tryptophan catabolism through the kynurenine pathway. This pathway is activated by proinflammatory stimuli such as bacterial lipopolysaccharides and interferon-γ cytokine [33]; however, metabolites of this pathway are also associated with the induction of immune tolerance [33–35]. Thus the elevated levels of xanthurenic acid in urine from IL10−/− mice may result from the absence of negative feedback control by IL10 on the production of kynurenine metabolites.
Xanthurenic acid glucuronide, identified on the basis of its high resolution LC-MS/MS fragmentation pattern, was also a differential metabolite. Concentrations of the glucuronide were lower in urine from IL10−/− mice suggesting a shift to higher free xanthurenic concentrations associated with colon inflammation. However, the low urinary concentration of the glucuronide in IL10−/− mice kept under SPF conditions suggested its concentration was not related to inflammation status. Similar observations have been made for short chain dicarboxylic acids that occurred at reduced concentrations in the urine of IL10−/− mice regardless of inflammation status [17]. The origin of such metabolic differences was attributed to residual 129P2 embryonic stem cell-derived genetic material flanking the IL10 gene in the IL10−/− C57BL/6 mouse [17, 32]. The UDP glucuronosyltransferase (UGT1) gene family (http://www.ensembl.org/) also lies within this region of embryonic stem cell-derived genetic material and may contribute to this metabolic difference between mouse strains. Xanthurenic acid 8-O-sulphate and 8-O-glucoside have also been identified in human urine as natriuretic hormones that regulate sodium excretion by the kidney [27]. Xanthurenic acid sulphate was not detected in the present study while xanthurenic acid glucoside (m/z 366 [M-H]−) was only tentatively detected by UHPLC as the differential metabolite (M366T84) (Table S2); higher in the urine from IL10−/− mice.
α-CEHC is a degradation product of vitamin E normally present in urine [28] where its concentration may reflect that of α-tocopherol and of α-CEHC in the liver [36]. Vitamin E is reduced in serum from Crohn's disease patients possibly as a result of reduced concentrations of serum lipids and of reduced absorption of lipids from the diet [37]. The reduced concentrations of α-CEHC glucuronide observed in urine of IL10−/− mice, and their recovery under SPF conditions, is consistent with reduced availability, degradation, and excretion of vitamin E in mice with impaired intestinal function. Reduced concentrations of α-CEHC glucuronide, and of the related metabolite γ-CEHC β-D-glucoside, have also been identified in urine of mice treated with a pregnane X receptor (PXR) activator [38]. It was suggested that these conjugates in urine may be useful urinary biomarkers of PXR activation. PXR is highly expressed in the intestines where it functions as a xenosensor to regulate the expression of metabolic enzymes and the excretion of xenobiotics as well as of toxic endogenous metabolites such as bile acids [39]. PXR activation was shown to be protective in the DSS-induced colitis mouse model of inflammatory bowel disease [40]. In IL10−/− mice, increased intestinal permeability may likewise result in an increased ingress of xenobiotics and toxic endogenous metabolites such as bile acids resulting in activation of PXR and reduced urinary vitamin E metabolites. Urinary α-CEHC glucuronide may thus serve as a good biomarker of intestinal inflammation.
The discovery of α-CEHC glucuronide and other unknown metabolites as potential inflammatory biomarkers illustrates both the power and the limitations of current analytical techniques in metabolomic analysis. Short-Column LCMS analysis enables extremely rapid metabolic profiling of multiple samples with simultaneous collection of characterising MS/MS data. However, the limited separation of individual metabolites hinders the structural and biochemical characterisation of candidate ions and their biological validation. UHPLC-MS allows rapid measurement of chromatographically individual metabolites but with reduced mass spectral data, so that additional MS experimentation is required to characterise metabolites of interest. The challenge of metabolite identification remains a major constraint but is essential for biological validation of biomarker candidates. Comparison of our results with those obtained from other metabolomics studies of urine from Crohn's disease patients or from animal models indicates how the different analytical tools each brings their own selectivity [18] so that the application of new analytical technology, as here, will reveal new metabolic biomarkers. NMR profiling of urine from Crohn's and ulcerative colitis patients has identified a number of metabolites affected by gut microbes, such as formate, hippurate, and p-cresol sulphate, which were able to discriminate between the patient cohorts [5]. Methylhistidine, glycine, guanidoacetate, and citrate were further metabolites important in distinguishing between cohorts. Methylhistamine has previously been reported as a urinary marker of disease activity in Inflammatory Bowel Disease [41]. However, hippurate, p-cresol sulphate, methylhistidine, and methylhistamine were not detected as differentiating metabolites in the present study. More recently, Lin et al. using GCMS [16, 17] have proposed xanthurenic acid and fucose as early discriminating metabolites of colon inflammation in the urine of the IL10−/− mouse. This paper extends those observations raising wider questions about the role of tryptophan catabolism and xanthurenic acid conjugates in the regulation of urinary salt balance [27] and inflammation.
Supplementary Material
Tables of mass spectral ions (Table S1) and mass time identifiers (Table S2) that were significantly different between IL10−/− and WT mice.
Acknowledgments
The authors thank M. Barnett, N. Roy, and R. Broadhurst for their help with mouse experiments and D. Greenwood for FTMS. and They also acknowledge funding from the Foundation for Research, Science and Technology (Contract C06X0702) and Nutrigenomics New Zealand (a collaboration between AgResearch Limited, Plant & Food Research, and The University of Auckland).
References
- 1.Sartor RB. Mechanisms of disease: pathogenesis of Crohn’s disease and ulcerative colitis. Nature Clinical Practice Gastroenterology and Hepatology. 2006;3(7):390–407. doi: 10.1038/ncpgasthep0528. [DOI] [PubMed] [Google Scholar]
- 2.Barrett JC, Hansoul S, Nicolae DL, et al. Genome-wide association defines more than 30 distinct susceptibility loci for Crohn’s disease. Nature Genetics. 2008;40(8):955–962. doi: 10.1038/NG.175. [DOI] [PMC free article] [PubMed] [Google Scholar]
- 3.Glocker E-O, Kotlarz D, Boztug K, et al. Inflammatory bowel disease and mutations affecting the interleukin-10 receptor. The New England Journal of Medicine. 2009;361(21):2033–2045. doi: 10.1056/NEJMoa0907206. [DOI] [PMC free article] [PubMed] [Google Scholar]
- 4.Fell JME, Paintin M, Arnaud-Battandieri F, et al. Mucosal healing and a fall in mucosal pro-inflammatory cytokine mRNA induced by a specific oral polymeric diet in paediatric Crohn’s disease. Alimentary Pharmacology and Therapeutics. 2000;14(3):281–289. doi: 10.1046/j.1365-2036.2000.00707.x. [DOI] [PubMed] [Google Scholar]
- 5.Williams HRT, Cox IJ, Walker DG, et al. Characterization of inflammatory bowel disease with urinary metabolic profiling. American Journal of Gastroenterology. 2009;104(6):1435–1444. doi: 10.1038/ajg.2009.175. [DOI] [PubMed] [Google Scholar]
- 6.Bezabeh T, Somorjai RL, Smith ICP. MR metabolomics of fecal extracts: applications in the study of bowel diseases. Magnetic Resonance in Chemistry. 2009;47(supplement 1):S54–S61. doi: 10.1002/mrc.2530. [DOI] [PubMed] [Google Scholar]
- 7.Marchesi JR, Holmes E, Khan F, et al. Rapid and noninvasive metabonomic characterization of inflammatory bowel disease. Journal of Proteome Research. 2007;6(2):546–551. doi: 10.1021/pr060470d. [DOI] [PubMed] [Google Scholar]
- 8.Jansson J, Willing B, Lucio M, et al. Metabolomics reveals metabolic biomarkers of Crohn’s disease. PLoS ONE. 2009;4(7):1–10. doi: 10.1371/journal.pone.0006386. Article ID e6386. [DOI] [PMC free article] [PubMed] [Google Scholar]
- 9.Balasubramanian K, Kumar S, Singh RR, et al. Metabolism of the colonic mucosa in patients with inflammatory bowel diseases: an in vitro proton magnetic resonance spectroscopy study. Magnetic Resonance Imaging. 2009;27(1):79–86. doi: 10.1016/j.mri.2008.05.014. [DOI] [PubMed] [Google Scholar]
- 10.Chen C, Shah YM, Morimura K, et al. Metabolomics reveals that hepatic stearoyl-CoA desaturase 1 downregulation exacerbates inflammation and acute colitis. Cell Metabolism. 2008;7(2):135–147. doi: 10.1016/j.cmet.2007.12.003. [DOI] [PMC free article] [PubMed] [Google Scholar]
- 11.Varma S, Bird R, Eskin M, Dolenko B, Raju J, Bezabeh T. Detection of inflammatory bowel disease by proton magnetic resonance spectroscopy (1H MRS) using an animal model. Journal of Inflammation. 2007;4, article 24 doi: 10.1186/1476-9255-4-24. [DOI] [PMC free article] [PubMed] [Google Scholar]
- 12.Strober W, Fuss IJ, Blumberg RS. The immunology of mucosal models of inflammation. Annual Review of Immunology. 2002;20:495–549. doi: 10.1146/annurev.immunol.20.100301.064816. [DOI] [PubMed] [Google Scholar]
- 13.Moore KW, de Waal Malefyt R, Coffman RL, O’Garra A. Interleukin-10 and the interleukin-10 receptor. Annual Review of Immunology. 2001;19:683–765. doi: 10.1146/annurev.immunol.19.1.683. [DOI] [PubMed] [Google Scholar]
- 14.Martin F-PJ, Rezzi S, Montoliu I, et al. Metabolic assessment of gradual development of moderate experimental colitis in IL-10 deficient mice. Journal of Proteome Research. 2009;8(5):2376–2387. doi: 10.1021/pr801006e. [DOI] [PubMed] [Google Scholar]
- 15.Murdoch TB, Fu H, MacFarlane S, Sydora BC, Fedorak RN, Slupsky CM. Urinary metabolic profiles of inflammatory bowel disease in interleukin-10 gene-deficient mice. Analytical Chemistry. 2008;80(14):5524–5531. doi: 10.1021/ac8005236. [DOI] [PubMed] [Google Scholar]
- 16.Lin H-M, Edmunds SJ, Helsby NA, Ferguson LR, Rowan DD. Nontargeted urinary metabolite profiling of a mouse model of crohn’s disease. Journal of Proteome Research. 2009;8(4):2045–2057. doi: 10.1021/pr800999t. [DOI] [PubMed] [Google Scholar]
- 17.Lin H-M, Barnett M, Roy N, Joyce N, Zhu WS. Metabolomic analysis identifies inflammatory and non-inflammatory metabolic effects of genetic modification in a mouse model of Crohn's disease. Journal of Proteome Research. 2010;9:1965–1975. doi: 10.1021/pr901130s. [DOI] [PubMed] [Google Scholar]
- 18.Büscher JM, Czernik D, Ewald JC, Sauer U, Zamboni N. Cross-platform comparison of methods for quantitative metabolomics of primary metabolism. Analytical Chemistry. 2009;81(6):2135–2143. doi: 10.1021/ac8022857. [DOI] [PubMed] [Google Scholar]
- 19.Koulman A, Cao M, Faville M, Lane G, Mace W, Rasmussen S. Semi-quantitative and structural metabolic phenotyping by direct infusion ion trap mass spectrometry and its application in genetical metabolomics. Rapid Communications in Mass Spectrometry. 2009;23(15):2253–2263. doi: 10.1002/rcm.4142. [DOI] [PMC free article] [PubMed] [Google Scholar]
- 20.Koulman A, Tapper BA, Fraser K, Cao M, Lane GA, Rasmussen S. High-throughput direct-infusion ion trap mass spectrometry: a new method for metabolomics. Rapid Communications in Mass Spectrometry. 2007;21(3):421–428. doi: 10.1002/rcm.2854. [DOI] [PubMed] [Google Scholar]
- 21.Lane GA, Fraser K, Cao M, et al. Urinary biomarkers of forage feeding from ESI-MS/MS fingerprinting: exploratory studies. New Zealand Society of Animal Production. 2006;66:230–235. [Google Scholar]
- 22.Roy N, Barnett M, Knoch B, Dommels Y, McNabb W. Nutrigenomics applied to an animal model of Inflammatory Bowel Diseases: transcriptomic analysis of the effects of eicosapentaenoic acid- and arachidonic acid-enriched diets. Mutation Research. 2007;622(1-2):103–116. doi: 10.1016/j.mrfmmm.2007.04.003. [DOI] [PubMed] [Google Scholar]
- 23.Philpott M, Mackay L, Ferguson LR, Forbes D, Skinner M. Cell culture models in developing nutrigenomics foods for inflammatory bowel disease. Mutation Research. 2007;622(1-2):94–102. doi: 10.1016/j.mrfmmm.2007.04.013. [DOI] [PubMed] [Google Scholar]
- 24.Du P, Kibbe WA, Lin SM. Improved peak detection in mass spectrum by incorporating continuous wavelet transform-based pattern matching. Bioinformatics. 2006;22(17):2059–2065. doi: 10.1093/bioinformatics/btl355. [DOI] [PubMed] [Google Scholar]
- 25.Smyth GK. Linear models and empirical bayes methods for assessing differential expression in microarray experiments. Statistical Applications in Genetics and Molecular Biology. 2004;3(1, article 3) doi: 10.2202/1544-6115.1027. [DOI] [PubMed] [Google Scholar]
- 26.Tohge T, Fernie AR. Web-based resources for mass-spectrometry-based metabolomics: a user’s guide. Phytochemistry. 2009;70(4):450–456. doi: 10.1016/j.phytochem.2009.02.004. [DOI] [PubMed] [Google Scholar]
- 27.Cain CD, Schroeder FC, Shankel SW, Mitchnick M, Schmertzler M, Bricker NS. Identification of xanthurenic acid 8-O-β-D-glucoside and xanthurenic acid 8-O-sulfate as human natriuretic hormones. Proceedings of the National Academy of Sciences of the United States of America. 2007;104(45):17873–17878. doi: 10.1073/pnas.0705553104. [DOI] [PMC free article] [PubMed] [Google Scholar]
- 28.Pope SAS, Burtin GE, Clayton PT, Madge DJ, Muller DPR. Synthesis and analysis of conjugates of the major vitamin E metabolite, α-CEHC. Free Radical Biology and Medicine. 2002;33(6):807–817. doi: 10.1016/s0891-5849(02)00974-7. [DOI] [PubMed] [Google Scholar]
- 29.Cao M, Koulman A, Johnson LJ, Lane GA, Rasmussen S. Advanced data-mining strategies for the analysis of direct-infusion ion trap mass spectrometry data from the association of perennial ryegrass with its endophytic fungus, Neotyphodium lolii. Plant Physiology. 2008;146(4):1501–1514. doi: 10.1104/pp.107.112458. [DOI] [PMC free article] [PubMed] [Google Scholar]
- 30.Callister SJ, Barry RC, Adkins JN, et al. Normalization approaches for removing systematic biases associated with mass spectrometry and label-free proteomics. Journal of Proteome Research. 2006;5(2):277–286. doi: 10.1021/pr050300l. [DOI] [PMC free article] [PubMed] [Google Scholar]
- 31.Wishart DS, Tzur D, Knox C, et al. HMDB: the human metabolome database. Nucleic Acids Research. 2007;35(1):D521–D526. doi: 10.1093/nar/gkl923. [DOI] [PMC free article] [PubMed] [Google Scholar]
- 32.Eisener-Dorman AF, Lawrence DA, Bolivar VJ. Cautionary insights on knockout mouse studies: the gene or not the gene? Brain, Behavior, and Immunity. 2009;23(3):318–324. doi: 10.1016/j.bbi.2008.09.001. [DOI] [PMC free article] [PubMed] [Google Scholar]
- 33.Mellor AL, Munn DH. IDO expression by dendritic cells: tolerance and tryptophan catabolism. Nature Reviews Immunology. 2004;4(10):762–774. doi: 10.1038/nri1457. [DOI] [PubMed] [Google Scholar]
- 34.Belladonna ML, Orabona C, Grohmann U, Puccetti P. TGF-β and kynurenines as the key to infectious tolerance. Trends in Molecular Medicine. 2009;15(2):41–49. doi: 10.1016/j.molmed.2008.11.006. [DOI] [PubMed] [Google Scholar]
- 35.Moffett JR, Namboodiri MA. Tryptophan and the immune response. Immunology and Cell Biology. 2003;81(4):247–265. doi: 10.1046/j.1440-1711.2003.t01-1-01177.x. [DOI] [PubMed] [Google Scholar]
- 36.Leonard SW, Gumpricht E, Devereaux MW, Sokol RJ, Traber MG. Quantitation of rat liver vitamin E metabolites by LC-MS during high-dose vitamin E administration. Journal of Lipid Research. 2005;46(5):1068–1075. doi: 10.1194/jlr.D400044-JLR200. [DOI] [PubMed] [Google Scholar]
- 37.Kuroki F, Iida M, Tominaga M, Matsumoto T, Kanamoto K, Fujishima M. Is vitamin E depleted in Crohn’s disease at initial diagnosis? Digestive Diseases. 1994;12(4):248–254. doi: 10.1159/000171459. [DOI] [PubMed] [Google Scholar]
- 38.Cho J-Y, Kang DW, Ma X, et al. Metabolomics reveals a novel vitamin E metabolite and attenuated vitamin E metabolism upon PXR activation. Journal of Lipid Research. 2009;50(5):924–937. doi: 10.1194/jlr.M800647-JLR200. [DOI] [PMC free article] [PubMed] [Google Scholar]
- 39.Kliewer SA, Goodwin B, Willson TM. The nuclear pregnane X receptor: a key regulator of xenobiotic metabolism. Endocrine Reviews. 2002;23(5):687–702. doi: 10.1210/er.2001-0038. [DOI] [PubMed] [Google Scholar]
- 40.Shah YM, Ma X, Morimura K, Kim I, Gonzalez FJ. Pregnane X receptor activation ameliorates DSS-induced inflammatory bowel disease via inhibition of NF-κB target gene expression. American Journal of Physiology. 2007;292(4):G1114–G1122. doi: 10.1152/ajpgi.00528.2006. [DOI] [PubMed] [Google Scholar]
- 41.Winterkamp S, Weidenhiller M, Otte P, et al. Urinary excretion of N-methylhistamine as a marker of disease activity in inflammatory bowel disease. American Journal of Gastroenterology. 2002;97(12):3071–3077. doi: 10.1111/j.1572-0241.2002.07028.x. [DOI] [PubMed] [Google Scholar]
Associated Data
This section collects any data citations, data availability statements, or supplementary materials included in this article.
Supplementary Materials
Tables of mass spectral ions (Table S1) and mass time identifiers (Table S2) that were significantly different between IL10−/− and WT mice.


