Abstract
Studies have demonstrated an influence of dosage release formulations on drug interactions and enantiomeric plasma concentrations. Metoprolol is a commonly used β-adrenergic antagonist metabolized by CYP2D6. The CYP2D6 inhibitor paroxetine has previously been shown to interact with metoprolol tartrate. This open-label, randomized, 4 phase crossover study assessed the potential differential effects of paroxetine on stereoselective pharmacokinetics of immediate release (IR) tartrate and extended release (ER) succinate metoprolol formulations.
Ten healthy subjects received metoprolol IR (50 mg) and ER (100 mg) with and without paroxetine coadministration. Blood samples were collected over 24 hours for determination of metoprolol plasma enantiomer concentrations.
Paroxetine coadministration significantly increased S and R metoprolol AUC0–24h by 4 and 5 fold, respectively for IR, and 3 and 4 fold, respectively for ER. S/R AUC ratios significantly decreased. These results demonstrate a pharmacokinetic interaction between paroxetine and both formulations of metoprolol. The interaction is greater with R metoprolol and stereoselective metabolism is lost. This could theoretically result in greater β-blockade and lost cardioselectivity. The magnitude of the interaction was similar between metoprolol formulations, which may be attributable to low doses / drug input rates employed.
Keywords: Metoprolol, paroxetine, pharmacokinetics, cytochrome P-450 CYP2D6, drug interactions
BACKGROUND
Metoprolol is a selective beta adrenergic antagonist commonly used in the management of acute myocardial infarction (MI), angina, hypertension, and cardiac arrhythmias. Metoprolol is supplied as a racemic mixture of S and R enantiomers. The S enantiomer is primarily responsible for β-receptor antagonism and is β-1 selective, whereas the R enantiomer has lower affinity and selectivity.1, 2 Metoprolol is primarily metabolized by the liver, with an estimated 65% of a dose O-demethylated, 10% α-hydroxylated, and 10% N-dealkylated.3 Cytochrome P-450 2D6 (CYP2D6) is responsible for α –hydroxylation and some O-demethylation of metoprolol with stereospecificity favoring metabolism of the R enantiomer.4 Alternate metabolic pathways are high affinity, low capacity, and readily saturable, and favor metabolism of the S enantiomer.4 Individuals exhibiting the CYP2D6 extensive metabolizer (EM) phenotype have greater clearance of the R enantiomer and greater relative plasma concentrations of the S enantiomer.5–7 Individuals exhibiting the CYP2D6 poor metabolizer (PM) phenotype show approximately equal clearances and plasma concentrations of the R and S enantiomers.5–7
Paroxetine is a widely used selective serotonin reuptake inhibitor which inhibits CYP2D6 and therefore interacts with a number of CYP2D6 substrates. A study in healthy volunteers showed that coadministration of paroxetine with immediate release metoprolol resulted in a loss of stereospecific metoprolol metabolism and increases in metoprolol area under the plasma concentration-time curve (AUC), maximum plasma concentration (Cmax), and elimination half life.8 A second study of post-MI patients showed increases in AUC when paroxetine was coadministered with either immediate release (IR) metoprolol tartrate or extended release (ER) metoprolol succinate, but made no distinction between the two formulations in analysis.9
Dosage release formulations influence the nature and magnitude of some metabolic drug interactions and may affect enantiomeric plasma concentration ratios if metabolism is stereoselective.10–12 Immediate release preparations may theoretically be more susceptible to drug interactions because high drug input rates are more likely to achieve concentrations that saturate hepatic metabolism. The objective of this study was to assess the differential effects, if any, of paroxetine administration on the single-dose pharmacokinetic (PK) properties of metoprolol IR and ER, with the hypothesis that the IR formulation would have a greater magnitude of interaction.
METHODS
Study Design
This study employed an open-label, randomized, crossover design. Subjects were assigned to receive metoprolol IR and ER study phases (2 each) in random order. Paroxetine coadministration was randomly assigned to an IR phase and an ER phase. Metoprolol was given as a single oral dose of either 50 mg metoprolol IR or 100 mg metoprolol ER (Toprol XL®). These doses were chosen to be easily detectable in blood while representing lower doses common in clinical practice to minimize the potential for toxicity. Paroxetine was administered at steady-state dosing to reflect paroxetine dosing in clinical practice, up and down titrated for safety reasons. Immediate release paroxetine (10mg) was given orally once daily for 2 days, then twice daily for 5 days, then twice daily on the day of metoprolol dosing, then daily for 4 days afterward. On metoprolol dosing days, subjects received paroxetine (10 mg) concurrently with a single oral dose of metoprolol and a second oral paroxetine dose (10 mg) 12 hours later. A minimum 7 day washout separated metoprolol doses, and a minimum 6 day washout separated the last previous paroxetine dose from off-paroxetine metoprolol doses.
Subjects were required to fast from 10 p.m. the night prior to each admission, with water ad lib except for 1 hour before and 2 hours after metoprolol dose. A standardized meal was given at 12 p.m. Metoprolol administration phases were carried out in the General Clinical Research Center and Michigan Clinical Research Unit at The University of Michigan Hospital. Study medications were dispensed by the hospital pharmacy and given with 8 oz of water. All subjects received a standardized lunch and dinner prepared and monitored by the research center. This study protocol was approved by an Institutional Review Board of the University of Michigan Hospital, and all subjects provided written informed consent prior to participation.
Subjects
Prospective subjects were eligible for inclusion in the study if they were nonsmoking healthy adults 18 – 45 years of age, not regularly taking any prescription or nonprescription medications (including natural products or supplements), willing to avoid all non-study medications during the study period, willing to adhere to dietary restrictions as required, willing to comply with the study requirements including documenting medication ingestion and adverse effects.
Prospective subjects were excluded if they had any clinically significant abnormal findings on history or physical exam including resting heart rate less than 60 beats per minute, blood pressure less than 110/70 mmHg, significantly abnormal findings on a screening electrocardiogram, or abnormal laboratory values at baseline. Other exclusion criteria included allergy or serious adverse reaction to any of the medications used in the study (including heparin), the presence of any condition that the investigator felt would interfere with successful completion of the study, and concurrent participation in any other study. Women who were breastfeeding, pregnant, or of childbearing potential and not on reliable contraception were ineligible.
Sample Collection
Subjects had an intravenous catheter placed in an antecubital or forearm vein by 8 a.m. on metoprolol dosing days. Blood samples (7 mL / sample) were then collected into tubes containing ethylene diaminetetracetic acid (EDTA) immediately prior to drug administration (time 0), and at 0.25, 0.5, 0.75, 1, 1.5, 2, 4, 6, 8, 10 and 12 hours after administration. Patency of the catheter was maintained with 3mL of heparin 10 units/mL solution. Three milliliters were withdrawn from the catheter deadspace and discarded immediately prior to each blood sample. The catheter was withdrawn after the 12 hour blood sample. Subjects were allowed to leave the study center and return for the final blood sample (7 mL) drawn by venipuncture at 24 hours. All blood samples were centrifuged at 4 °C and approximately 2800 rpm within one hour of collection. Plasma was then collected and stored at −70 °C until analysis.
Potential pharmacodynamic effects of metoprolol were measured by heart rate, heart rhythm, and blood pressure (BP) at each blood sampling time. Following blood draws, heart rate and rhythm were measured by a three lead electrocardiogram. Next, a sitting blood pressure (BP) was obtained with an automated blood pressure machine a minimum of three times per sample, with no difference > 10 mmHg between systolic readings.
Bioanalytical Methods
Plasma metoprolol enantiomer concentrations were quantified at an independent outside laboratory (NSF International, Ann Arbor, MI). In brief, S and R enantiomers were analyzed by a high pressure liquid chromatography (HPLC) system (Agilent Technologies, Santa Clara, California). The method employed a 2.0 mm chiral cellobiohydrolase column and a mobile phase consisting of 5% 2-propanol in 10 M sodium phosphate buffer (pH 6.0) with 50 µM disodium EDTA at a flow rate of 0.25 mL/min. Column effluent was measured using a fluorescence detector (Hitachi High-Technologies Corporation, Tokyo, Japan) using a 230 nm excitation wavelength and a 305 nm emission wavelength. The lower limit of quantification (LLOQ) was determined to be 1.6 ng/mL. The percent coefficient of variation (%CV) for five samples at the LLOQ on three days (days 1, 2, 5) ranged from 9.2 – 9.6% for R metoprolol and from 8.2 – 11.7% for S metoprolol. The %CV for five replicate samples each of 4.7 ng/mL, 15.6 ng/mL, and 46.8 ng/mL standards ranged from 0.4 – 8.7% for S metoprolol and from 0.5 – 10.5% for R metoprolol on three separate days (days 1, 2, 5). The %CV during system suitability tests with 20 ng/mL standard injected at least 5 times were 0.2 – 5.7%.
Data Analysis
PK Analysis
PK variables for each of the enantiomers were calculated by noncompartmental methods using Winnonlin version 5.2.1 (Pharsight Corp, Mountain View, CA). PK variables evaluated included Cmax, time to reach Cmax (Tmax), apparent oral clearance (Cl/F), terminal elimination rate (λz), and the AUC from time 0 to the 24 hour blood draw (AUC0–24h) calculated by the linear trapezoidal rule. Concentrations below the LLOQ were removed. Area under the curve was extrapolated to twenty-four hours when the 24 hour time point was below the LLOQ by extrapolating concentration at 24 hours (last concentration above LLOQ*exp(−λz*Δt)) and applying the linear trapezoidal rule.
Statistical Analysis
PK variables are reported as geometric mean ± standard deviation. Demographic variables are reported as arithmetic mean ± standard deviation. Differences in PK and pharmacodynamic variables between study phases were evaluated by two way analysis of variance (ANOVA), with post hoc analysis when appropriate by Tukey’s studentized range test using R version 2.8.1 (Vienna, Austria). A sample size of 10 subjects was calculated to detect a 20% increase in AUC with coadministration of paroxetine with both metoprolol formulations. A paired t-test was used to compare percent change in AUC with addition of paroxetine between metoprolol formulations. A significance level of 0.05 was used for all statistical hypothesis testing.
RESULTS
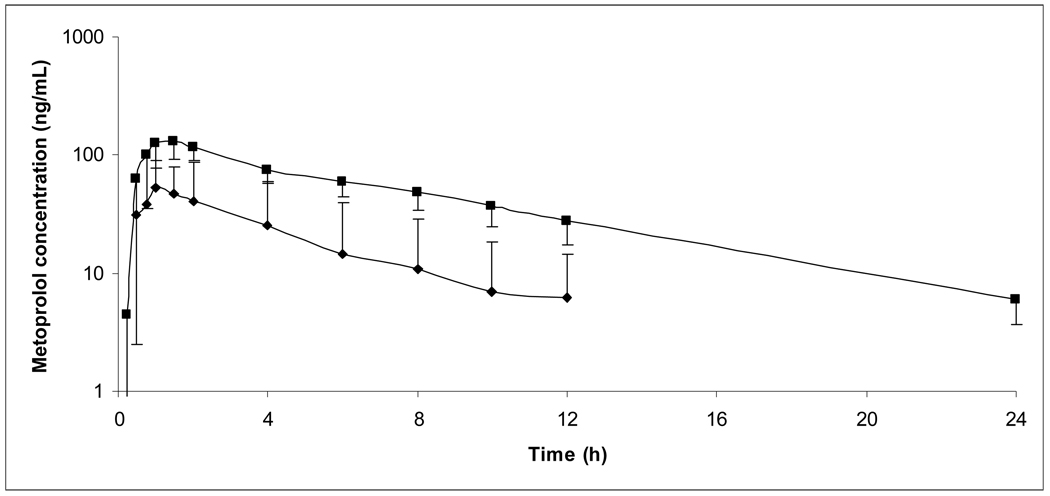
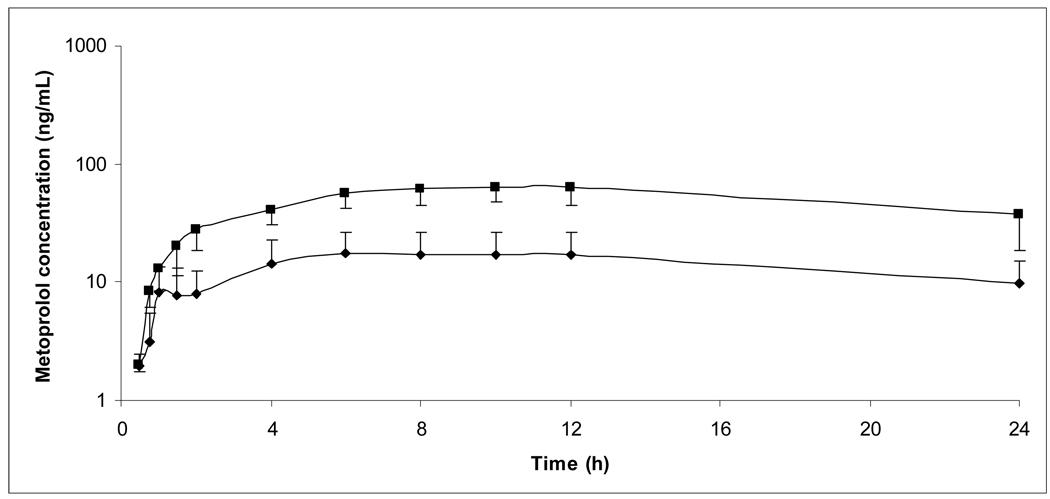
Ten healthy male volunteers, age 28 ± 10 years (range 18 – 45 years), weight 81.6 ± 9.9 kg (range 63.2 – 94.2 kg), and height 179.0 ± 6.0 cm (range 171.5 – 187.1 cm) gave their written informed consent and participated in the study. Eight subjects were Caucasian and two were African American. All subjects completed the study and were included in the final PK analysis. Figures I and II show average plasma concentration versus time curves during each of the 4 study phases.
Figure I.
Average plasma concentration versus time curves for total metoprolol (S + R) following 50 mg metoprolol IR. Error bars depict standard deviation.
■: Metoprolol alone, N=10; ▲:Metoprolol + paroxetine, N=10.
Figure II.
Average plasma concentration versus time curves for total metoprolol (S + R) following 100 mg metoprolol ER. Error bars depict standard deviation.
■: Metoprolol alone, N=9; ▲:Metoprolol + paroxetine, N=10.
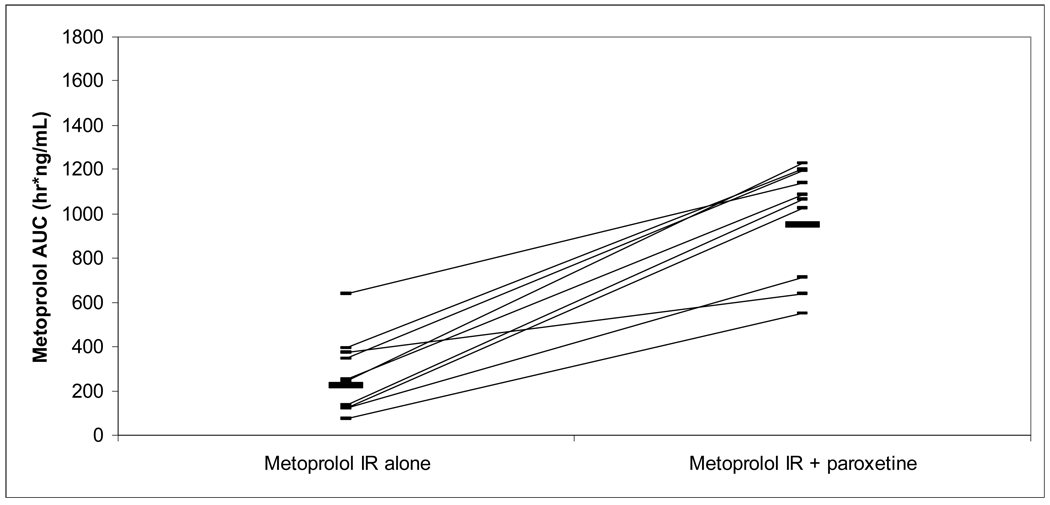
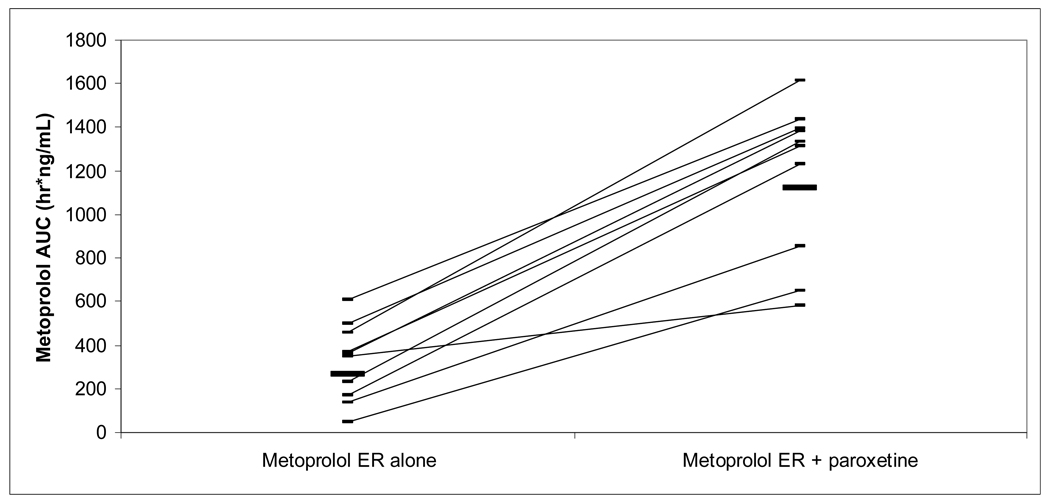
Mean PK variables are summarized in Table I. Individual percent changes in AUC0–24h and S/R AUC ratios by subject are listed in Table II. Area under the curve of both metoprolol enantiomers for both formulations increased significantly with paroxetine coadministration (Figures III and IV). Mean plasma AUC of S and R metoprolol enantiomers increased during paroxetine coadministration by approximately 4 fold and 5 fold, respectively, for metoprolol IR and by approximately 3 fold and 4 fold, respectively, for metoprolol ER. The percent increase in AUC with coadministration of paroxetine was similar between metoprolol IR and ER (P=0.35 for S enantiomer, 0.56 for R enantiomer). AUC0–24h was extrapolated in all subjects in IR group without paroxetine phase (S: 14% total AUC; R: 21%), four subjects in IR with paroxetine phases (S: 2 subjects, 2% total AUC; R: 2 subjects, 4%), four subjects in ER without paroxetine phases (S: 2 subjects, 4% total AUC; R: 3 subjects, 6%), and no subects in ER with paroxetine phases.
Table I.
Stereospecific pharmacokinetic variables in healthy subjects (N=10) for oral metoprolol IR and ER given with and without paroxetine.
| Variable | Metoprolol Enantiomer |
Metoprolol IR 50mg |
Metoprolol ER 100mg |
||||
|---|---|---|---|---|---|---|---|
| Without paroxetine |
With paroxetine |
Without paroxetine |
With paroxetine |
||||
| AUC0–24h | S | 138±98 | 511±116 | ** | 173±96 | 599±174 | ** |
| (ng*h/mL) | R | 84±75 | 436±141 | ** | 120±71a | 521±183 | ** |
| Cl/F (L/h) | S | 194±171 | 47±15 | * | 138±90b | 56±46c | |
| R | 392±913 | 56±27 | * | 292±291d | 66±36c | ||
| λz(h−1) | S | 0.23±0.05 | 0.13±0.02 | ** | 0.04±0.03b | 0.04±0.03c | |
| R | 0.29±0.19 | 0.14±0.03 | * | 0.05±0.03d | 0.05±0.02c | ||
| Tmax (h) | S | 1.0±0.4 | 1.0±0.6 | 8±3 | 10±3 | ||
| R | 1.0±0.3 | 1.1±0.6 | 5±4a | 9±3 | * | ||
| Cmax | S | 30±23 | 81±17 | ** | 10±5 | 35±9 | * |
| (ng/mL) | R | 20±20 | 73±18 | ** | 8±4a | 30±9 | * |
| S/R AUC | S/R | 1.64±0.25 | 1.17±0.17 | ** | 1.65±0.37a | 1.15±0.11 | ** |
| Ratio | |||||||
Values are reported as geometric mean ± standard deviation.
P<0.05;
P<0.001;
N=9 evaluable;
N=6 evaluable;
N=5 evaluable;
N=7 evaluable
Table II.
% change from baseline in AUC0–24h and S/R AUC ratio with paroxetine addition to metoprolol IR and metoprolol ER in healthy subjects (N=10)
| Subject | Metoprolol Enantiomer |
Metoprolol IR 50mg |
Metoprolol ER 100mg |
||
|---|---|---|---|---|---|
|
AUC0–24h (% change with paroxetine) |
S/R AUC Ratio (% change with paroxetine) |
AUC0–24h (% change with paroxetine) |
S/R AUC Ratio (% change with paroxetine) |
||
| 1 | S | 147 | −37 | 199 | −32 |
| R | 294 | 338 | |||
| 2 | S | 303 | −44 | 204 | −41 |
| R | 615 | 418 | |||
| 3 | S | 63 | −11 | 58 | −14 |
| R | 84 | 84 | |||
| 4 | S | 524 | −28 | 666 | n/a* |
| R | 770 | n/a* | |||
| 5 | S | 446 | −15 | 397 | −48 |
| R | 546 | 865 | |||
| 6 | S | 573 | −32 | 501 | −36 |
| R | 883 | 844 | |||
| 7 | S | 641 | −27 | 350 | −42 |
| R | 909 | 674 | |||
| 8 | S | 64 | −17 | 117 | −17 |
| R | 98 | 161 | |||
| 9 | S | 188 | −35 | 157 | −18 |
| R | 343 | 213 | |||
| 10 | S | 266 | −34 | 207 | −27 |
| R | 453 | 320 | |||
| Mean | S | 322 | −28 | 286 | −31 |
| R | 500 | 435 | |||
No detectable R-enantiomer plasma concentrations when metoprolol ER was given without paroxetine.
Figure III.
Metoprolol IR AUC following 50 mg oral dose, with and without paroxetine.
 mean metoprolol AUC 223 ng*h/mL without paroxetine, 949 ng*h/mL with paroxetine.
Figure IV.
Metoprolol ER AUC following 100 mg oral dose, with and without paroxetine.
 mean metoprolol AUC 265 ng*h/mL without paroxetine, 1121 ng*h/mL with paroxetine.
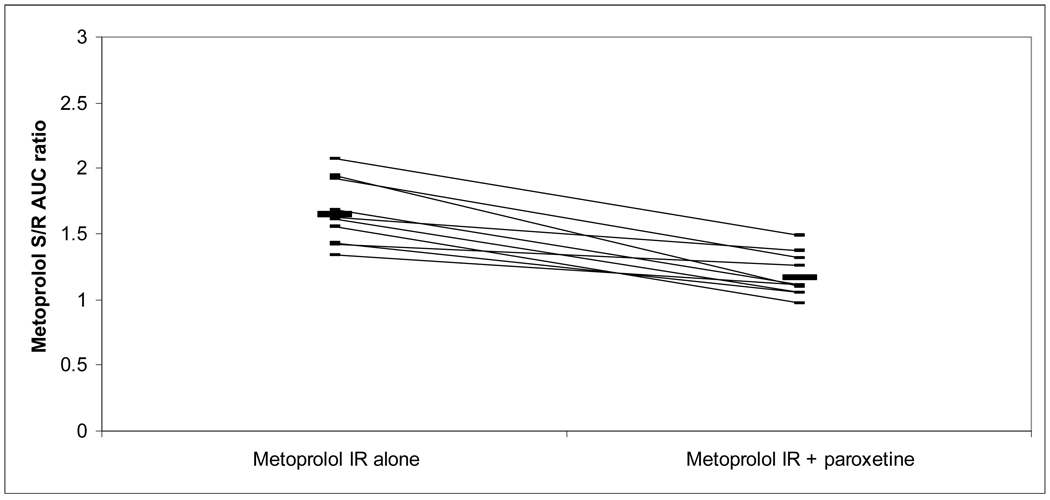
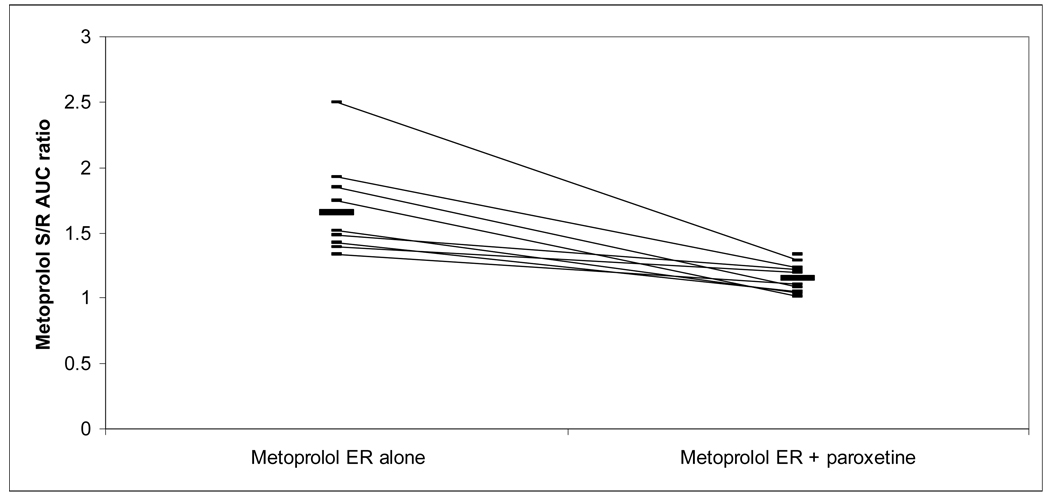
The S/R AUC ratio for metoprolol IR and ER decreased with paroxetine coadministration from 1.64 and 1.65, respectively, to 1.17 and 1.15. All subjects’ S/R AUC ratios from both metoprolol formulations decreased with paroxetine coadministration, and changes for both formulations were statistically significant (Figures V and VI).
Figure V.
Metoprolol IR S/R enantiomer AUC ratio following 50 mg oral dose, with and without paroxetine.
 mean S/R ratio 1.6 without paroxetine, 1.2 with paroxetine.
Figure VI.
Metoprolol ER S/R enantiomer AUC ratio following 100 mg oral dose, with and without paroxetine.
 mean S/R ratio 1.7 without paroxetine, 1.2 with paroxetine.
There was no change in heart rate or P-R interval on electrocardiogram between baseline and metoprolol Tmax in any study phase. Comparing all metoprolol-only phases to all metoprolol-paroxetine phases, systolic BP decreased from baseline to Tmax from an average 123 mmHg at baseline to 113 mmHg at R enantiomer Tmax (P<0.001) and 114 mmHg at S enantiomer Tmax (P<0.001, normal <120 mmHg). Diastolic blood pressure did not change significantly from baseline to Tmax, averaging 66 mmHg at baseline, 65 mmHg at R enantiomer Tmax, and 66 mmHg at S enantiomer Tmax (normal <80 mmHg). There were no significant differences between metoprolol formulations with respect to blood pressure change with addition of paroxetine.
Compliance with study medication was complete per patient dose diaries. Two possible adverse drug events were noted during the study period, with 1 subject reporting a panic attack on day 4 of paroxetine treatment and 1 subject reporting transient nausea following the second morning dose of paroxetine. Neither of these events prevented completion of the study per protocol.
DISCUSSION
Paroxetine coadministration with metoprolol IR or ER significantly increased systemic exposure to S and R metoprolol. There is a loss of stereospecific metabolism, and a greater increase in R metoprolol exposure compared to S metoprolol. There was a similar increase in AUC between metoprolol formulations.
We hypothesized that the drug interaction with paroxetine would be greater with IR metoprolol than ER because the increased drug input rate has greater potential to saturate CYP2D6 on hepatic first pass, however the results of this investigation indicated a similar magnitude of effect. CYP2D6 saturation may not play a large enough role in metoprolol PK at the input rates investigated to demonstrate such an effect. In future studies, an input rate dependent stereoselective drug interaction with metoprolol may be more easily demonstrated with higher doses. One previous PK study of metoprolol IR 100 mg showed a similar S/R AUC ratio in the absence of paroxetine (1.72) and a similar increase in S and R AUC with paroxetine coadministration to what was observed in the present study (5 and 8 fold, respectively), whereas a previous study of metoprolol IR 200 mg yielded an S/R AUC ratio of 1.37 in the absence of CYP2D6 inhibitor.7–8 This may indicate greater CYP2D6 saturation at the 200 mg IR dose, which would theoretically be greater influenced by the presence of a CYP2D6 inhibitor.
Increased metoprolol exposure with paroxetine coadministration could lead to increased β-adrenergic antagonism. Further, a greater proportional increase in exposure to the less β-1 selective R enantiomer could result in a loss of cardioselectivity. Some pharmacodynamic effects consistent with increased cardiac β-adrenergic antagonism with metoprolol and paroxetine coadministration have been demonstrated. Our study of healthy normal subjects receiving single dose metoprolol showed a significant reduction in resting systolic blood pressure with coadministration. A previous study of healthy normal subjects receiving single dose metoprolol showed reductions in exercise-induced heart rate and systolic blood pressure with coadministration.8 A third study in post-MI patients receiving multiple dose coadministration showed decreased resting heart rates.9 The present study had very limited power to detect pharmacodynamic effects of increased metoprolol exposure because it examined these effects in a small number of resting subjects receiving low metoprolol doses. The pharmacodynamic impact of increased metoprolol exposure is expected to be greatest during periods of catecholamine surges (e.g. exercise).
Adverse events consistent with excessive beta adrenergic antagonism have been reported when paroxetine and metoprolol are coadministered and include postural hypotension, bradycardia, and complete atrioventricular block.9, 13 Increases in beta adrenergic antagonism are most likely the pharmacodynamic consequence of increased metoprolol exposure, although direct or indirect antiadrenergic activity of paroxetine may play a minor role. While most subjects in studies to date have had no adverse events associated with metoprolol-paroxetine coadministration, avoidance of this drug interaction or preemptive metoprolol dose reduction may be appropriate based on the observed increases in metoprolol exposure.
Two potential limitations of this study are the lack of CYP2D6 genotype data for subjects and the low number of blood draws in the terminal portion of the dosing interval. First, regarding CYP2D6 genotyping, calculated terminal half lives for R and S enantiomers of metoprolol in the absence of paroxetine ranged from 0.9 – 3.7 hours for the R enantiomer and 2.1 – 4.1 hours for the S enantiomer; these values are consistent with tabulated terminal half lives for metoprolol in EMs (R enantiomer 2.8±1h, S enantiomer 2.9±1h), and all values are greater than two standard deviations lower than tabulated half lives for PMs (R enantiomer 7.7±1.7h, S enantiomer 7.2±1.5h).7 Also consistent with an EM phenotype is that all subjects had baseline S/R AUC ratios greater than 1.0 and even maintained values greater than 1.0 with paroxetine coadministration, while tabulated S/R AUC ratios for PMs receiving metoprolol alone are typically 1.0 or less.7 Addition of paroxetine enhanced AUC of both enantiomers and decreased S/R ratios in all subjects. It is therefore unlikely that any subjects in this study would be correctly classified as PMs via genotyping. With respect to blood sampling late in the dosing interval, although there was 21% AUC extrapolation in one phase of the study suggesting insufficient sampling the data collected were sufficient to characterize the drug interaction with paroxetine with both IR and ER formulations. A longer period of observation may have yielded more λz and Cl/F data from subjects in the ER phases of the study but was not necessary to detect the drug interaction.
Dosing and coadministration effects may account for some between-formulation differences observed in this study. First, paroxetine administration in an immediate release formulation may have resulted in variable hepatic drug exposure and CYP2D6 inhibition across the dosing interval, which could affect concentration-time profiles of metoprolol ER and IR differently. Second, plasma paroxetine levels were not measured so any variability in exposure to paroxetine across the dosing interval cannot be assessed, nor can any potential impact of metoprolol or metoprolol formulation on paroxetine pharmacokinetics. Third, the administration of paroxetine and metoprolol simultaneously may have resulted in an altered gastric emptying or absorption rates which could themselves impact drug input and pharmacokinetics of either drug. Twice daily administration of paroxetine and dosing for seven days prior to metoprolol studies were measures taken to minimize paroxetine exposure fluctuations and to maintain a dosing strategy typical of clinical practice, but would not compensate for all of these possible effects.
In conclusion, this study demonstrated a PK drug-drug interaction between the CYP2D6 inhibitor paroxetine and the CYP2D6 substrate metoprolol in both IR and ER formulations. The overall magnitude of drug interaction was approximately the same with the two formulations. Without an appropriate prospectively designed study, input rate dependent stereoselective drug interaction with metoprolol requires further testing. However, this concept should be of great interest since input rate dependent interactions may have potentially important clinical ramifications.
Acknowledgments
FUNDING
The study was funded by AstraZeneca; the University of Michigan General Clinical Research Unit (NIH grant #M01-RR000042); the Michigan Clinical Research Unit (NIH grant #UL1RR024986); and the National Center for Research Resources (grant #UL1RR024986).
Footnotes
Financial Interest Disclosure: The content is solely the responsibility of the authors and does not necessarily represent the official views of NCRR or the National Institutes of Health. BB, LW: consultant and speaker’s bureau, AstraZeneca.
REFERENCES
- 1.Boucher M, Duchêne-Marullaz P, Moundanga JL. Studies on the stereoisomers of beta-adrenoceptor antagonists in conscious A-V blocked dogs. Br J Pharmacol. 1986;89(1):119–127. doi: 10.1111/j.1476-5381.1986.tb11127.x. [DOI] [PMC free article] [PubMed] [Google Scholar]
- 2.Wahlund G, Nerme V, Abramsson T, Sjöquist PO. The beta 1- and beta 2-adrenoceptor affinity and beta 1-blocking potency of S- and R-metoprolol. Br J Pharmacol. 1990;99(3):592–596. doi: 10.1111/j.1476-5381.1990.tb12974.x. [DOI] [PMC free article] [PubMed] [Google Scholar]
- 3.Borg KO, Carlsson E, Hoffmann KJ, Jönsson TE, Thorin H, Wallin B. Metabolism of metoprolol-(3-h) in man, the dog, and the rat. Acta Pharmacol Toxicol (Copenh) 1975;35 Suppl 5:125–135. doi: 10.1111/j.1600-0773.1975.tb03329.x. [DOI] [PubMed] [Google Scholar]
- 4.Otton SV, Crewe HK, Lennard MS, Tucker GT, Woods HF. Use of quinidine inhibition to define the role of the sparteine/debrisoquine cytochrome P450 in metoprolol oxidation by human liver microsomes. J Pharmacol Exp Ther. 1988;247(1):242–247. [PubMed] [Google Scholar]
- 5.Dayer P, Leemann T, Marmy A, Rosenthaler J. Interindividual variation of beta-adrenoceptor blocking drugs, plasma concentration and effect: influence of genetic status on behaviour of atenolol, bopindolol and metoprolol. Eur J Clin Pharmacol. 1985;28(2):149–153. doi: 10.1007/BF00609683. [DOI] [PubMed] [Google Scholar]
- 6.Jonkers RE, Koopmans RP, Portier EJ, van Boxtel CJ. Debrisoquine phenotype and the pharmacokinetics and beta-2 receptor pharmacodynamics of metoprolol and its enantiomers. J Pharmacol Exp Ther. 1991;256(3):959–966. [PubMed] [Google Scholar]
- 7.Lennard MS, Tucker GT, Silas JH, Freestone S, Ramsay LE, Woods HF. Differential stereoselective metabolism of metoprolol in extensive and poor debrisoquine metabolizers. Clin Pharmacol Ther. 1983;34(6):732–737. doi: 10.1038/clpt.1983.242. [DOI] [PubMed] [Google Scholar]
- 8.Hemeryck A, Lefebvre RA, De Vriendt C, Belpaire FM. Paroxetine affects metoprolol pharmacokinetics and pharmacodynamics in healthy volunteers. Clin Pharmacol Ther. 2000;67(3):283–291. doi: 10.1067/mcp.2000.104788. [DOI] [PubMed] [Google Scholar]
- 9.Goryachkina K, Burbello A, Boldueva S, Babak S, Bergman U, Bertilsson L. Inhibition of metoprolol metabolism and potentiation of its effects by paroxetine in routinely treated patients with acute myocardial infarction (AMI) Eur J Clin Pharmacol. 2008;64(3):275–282. doi: 10.1007/s00228-007-0404-3. [DOI] [PubMed] [Google Scholar]
- 10.Bleske BE, Welage LS, Rose S, Amidon GL, Shea MJ. The effect of dosage release formulations on the pharmacokinetics of propranolol stereoisomers in humans. J Clin Pharmacol. 1995;35(4):374–378. doi: 10.1002/j.1552-4604.1995.tb04076.x. [DOI] [PubMed] [Google Scholar]
- 11.Bleske BE, Welage LS, Touchette MA, Edwards DJ, Rodman DP, Shea MJ. Evaluation of dosage-release formulations on inhibition of drug clearance: effect of sustained- and immediate-release verapamil on propranolol pharmaocokinetic parameters. Ther Drug Monit. 1994;16(2):216–220. doi: 10.1097/00007691-199404000-00019. [DOI] [PubMed] [Google Scholar]
- 12.Karim A, Piergies A. Verapimil stereoisomerism: enantiomeric ratios in plasma dependent on peak concentrations, oral input rate, or both. Clin Pharmacol Ther. 1995;58(2):174–184. doi: 10.1016/0009-9236(95)90195-7. [DOI] [PubMed] [Google Scholar]
- 13.Onalan O, Cumurcu B, Bekar L. Complete atrioventricular block associated with concomitant use of metoprolol and paroxetine. Mayo Clin Proc. 2008;83(5):595–599. doi: 10.4065/83.5.595. [DOI] [PubMed] [Google Scholar]


