

Abstract
Background
Patients with inflammatory bowel disease (IBD) are at increased risk of developing colorectal cancer. Aberrant microRNA (miRs) expression has been linked to carcinogenesis, however no reports document a relationship between IBD-related neoplasia (IBDN) and altered miR expression. In the current study we sought to identify specific miR dysregulation along the normal-inflammation-cancer axis.
Methods
miR microarrays and quantitative RT-PCR were used to detect dysregulated miRs. Receiver operating characteristic curve analysis was employed to test for potential usefulness of miR-31 as a disease marker of IBDNs. In silico prediction analysis, Western blot, and luciferase activity measurement were employed for target identification.
Results
Several dysregulated miRs were identified between chronically inflamed mucosae and dysplasia arising in IBD. MiR-31 expression increases in a stepwise fashion during progression from normal to IBD to IBDN and accurately discriminated IBDNs from normal or chronically inflamed tissues in IBD patients. Finally, we identified factor inhibiting hypoxia inducible factor 1 as a direct target of miR-31.
Conclusions
Our study reveals specific miR dysregulation as chronic inflammation progresses to dysplasia. MiR-31 expression levels increase with disease progression and accurately discriminates between distinct pathological entities that co-exist in IBD patients. The novel effect of miR-31 on regulating factor inhibiting hypoxia inducible factor 1 expression provides a new insight on the pathogenesis of IBDN.
Keywords: Inflammatory bowel disease, IBD-related neoplasia, microRNA, microRNA factor inhibiting hypoxia inducible factor 1
Introduction
Colorectal cancer is a well-recognized sequela of patients with longstanding inflammatory bowel disease (IBD). The overall incidence of colon cancer in ulcerative colitis is 3 per 1000 person-years, representing a 5-fold increase above that in the general population (0.6 per 1000 person-years)1. Cancer susceptibility in Crohn’s disease, the other major category of IBD, is also increased 2. Current preventive measures to diminish colorectal cancer mortality in IBD patients consist of periodic surveillance colonoscopies with random biopsies, combined with total colectomy if dysplasia or cancer is found. However, challenges regarding the management and early detection of inflammatory bowel disease-associated neoplasia (IBDN) still remain 3. For example, precancerous dysplastic lesions may escape detection due to sampling error. Moreover, morphologic alterations associated with chronic inflammation make the diagnosis of dysplasia difficult and prone to subjective interpretation. Another challenge concerns the distinction between IBDNs and sporadic adenomas or cancers developing in the IBD setting. This distinction is important, since IBD-associated neoplasia warrants total proctocolectomy, while sporadic adenoma or adenocarcinoma may be treated by local excision alone 4. Such considerations underscore the need to develop novel biomarkers and diagnostic strategies to screen IBD individuals for colorectal cancer.
MicroRNAs (miRs) are small, non-coding RNA molecules that have emerged as key regulators of various cellular processes 5. Compelling evidence links abnormal miR expression to several human diseases, including cancers 6. For example, transfecting the miR-17-92 cluster into hematopoietic cells dramatically accelerates lymphomagenesis in MYC-transgenic mice 7, while conditional overexpression of miR-155 in the B-cell lineage leads to the development of pre-B-cell leukemias 8. The miR-15a/16-1 cluster acts as a tumor suppressor by controlling expression of bcl2 antiapoptotic protein, and expression of this cluster is lost or downregulated in most chronic lymphocytic leukemia patients 9, 10.The miR-106b-25 cluster represses p21/BIM expression and allows transformed cells to escape TGFβ-induced cell cycle arrest and apoptosis 11, 12.
Despite growing evidence implicating miRs in carcinogenesis, there are no published studies on involvement of miRs in IBD-associated neoplastic transformation. A recent report described major alterations of miRNA in ulcerative colitis, a form of IBD 13. Our data extends the findings of this study in IBDN. In the present study, we performed a global search for altered miR expression at the transition point from chronic inflammation to neoplasia. We then assessed expression levels of miR-31 at each stage of IBD-neoplastic transformation. We also identified factor inhibiting hypoxia inducible factor 1 (FIH1), an inhibitor of hypoxia inducible factor 1, as a direct target of miR-31.
Materials and methods
Specimen collection
Through multi-center collaborations, we established a cohort of 175 fresh frozen specimens consisting of 55 normal colonic specimens from 14 patients without a history of IBD or cancer, 35 chronically inflamed and 22 non-inflamed matched specimens from 35 IBD patients, 11 IBD-dysplasias, 37 IBD-cancers, and 15 sporadic colorectal cancers. All specimens were obtained under approved IRB protocols at the Johns Hopkins University, University of Maryland and Mount Sinai School of Medicine. Normal tissues were collected from patients with no IBD or GI cancer history. We further focused our study on miR-31, the second most upregulated miR in our array analysis. For our study we selected a total of 175 specimens. The summary of clinical data for each disease group is illustrated in Table 1. Detailed clinical data for the neoplastic specimens is shown in Table 2.
Table 1. Summary of clinical data for individual disease groups.
N=normal from patients without IBD or colorectal cancer history; N-IBD = normal “unaffected” specimens from IBD patients; IBD =“affected” chronically inflamed specimens from IBD patients; IBD-Dys = dysplastic specimens from IBD patients; IBD-C = cancer specimens from IBD patients; SCRC = sporadic colorectal specimens from patients without any history of IBD.
| IBD-C | IBD-Dys | IBD | N-IBD | N | SCRC | |
|---|---|---|---|---|---|---|
| Age | 49.4 | 57.4 | 46.2 | 48.8 | 60.6 | 68.9 |
| Sex M/F | 21/16 | 6/5 | 24/11 | 16/6 | 12/2 | 7/8 |
| IBD type UC/CD/IC |
30/5/2 | 9/2 | 24/11/0 | 15/7/0 | N/A | N/A |
| Location Right/Left |
12/25 | 5/6 | 5/30 | 18/4 | 26/29 | 3/12 |
Table 2. Summary of clinical data for neoplastic specimens.
IBD-Dys = dysplastic specimens from IBD patients; IBD-C = cancer specimens from IBD patients; SCRC = sporadic colorectal specimens from patients without any history of IBD; WD = well differentiated; MD = moderate differentiated; PD = poorly differentiated; LGD = low grade dysplasia; HGD = high grade dysplasia; DALM = dysplasia associated lesion or mass.
| Pathology | Location | Grade | Stage | Age | Sex | Type |
|---|---|---|---|---|---|---|
| IBD-C | Ascending | MD-PD | T3N0 | 33 | F | UC |
| IBD-C | Rectum | MD | T3N0 | 51 | M | UC |
| IBD-C | Cecum | WD | T1N0 | 38 | M | UC |
| IBD-C | Sigmoid | MD-PD | T3N0 | 58 | F | UC |
| IBD-C | Rectum | PD | T3NX | 57 | M | UC |
| IBD-C | Rectum | MD | T3bN1 | 49 | M | UC |
| IBD-C | Rectosigmoid | PD | T1N0 | 46 | M | UC |
| IBD-C | Sigmoid | PD | T3N1 | 63 | M | UC |
| IBD-C | Ileocecal valve | WD-MD | T3N0 | 69 | F | CD |
| IBD-C | Rectum | MD-PD | T2N0 | 57 | F | UC |
| IBD-C | Rectum | MD-PD | T3N2 | 43 | M | CD |
| IBD-C | Splenic Flexure | PD | T3N2 | 72 | F | CD |
| IBD-C | Ileocecal valve | MD-PD | T2N0 | 39 | M | CD |
| IBD-C | Rectosigmoid | MD-PD | T3N0 | 38 | M | UC |
| IBD-C | Rectum | PD | T2N0 | 51 | M | UC |
| IBD-C | Transverse | MD-PD | T3N2 | 58 | F | UC |
| IBD-C | Sigmoid | MD-PD | T3N0 | 57 | F | UC |
| IBD-C | Rectum | MD | T3aN0 | 51 | F | UC |
| IBD-C | Rectum | WD | T2N1 | 59 | M | IC |
| IBD-C | Rectosigmoid | WD-MD | T4N2 | 37 | M | UC |
| IBD-C | Hepatic Flexure | PD | T3N0 | 44 | M | UC |
| IBD-C | Rectum | WD-PD | T3N2 | 53 | F | UC |
| IBD-C | Ascending | MD-PD | T3N2 | 28 | M | UC |
| IBD-C | Hepatic Flexure | WD-PD | T3aN2 | 27 | M | UC |
| IBD-C | Rectosigmoid | MD | T4N2 | 59 | F | UC |
| IBD-C | Sigmoid | MD-PD | T3N0 | 56 | M | UC |
| IBD-C | Sigmoid | MD | T3N0 | 58 | M | UC |
| IBD-C | Cecum | MD | T4N1 | 50 | M | UC |
| IBD-C | Descending | MD | T2N0 | 30 | F | CD |
| IBD-C | Rectosigmoid | MD | T3N0 | 51 | M | UC |
| IBD-C | Transverse | WD | T3N0 | 30 | M | UC |
| IBD-C | Ascending | MD | T3N2 | 44 | F | IC |
| IBD-C | Cecum | PD | T4N0 | 23 | M | UC |
| IBD-C | Rectum | NA | T4Nx | 43 | F | UC |
| IBD-C | Rectum | MD | T4N1 | 41 | F | UC |
| IBD-C | Sigmoid | WD | T1N0 | 83 | F | UC |
| IBD-C | Rectum | MD | T1N0 | 82 | F | UC |
| IBD-Dys | Sigmoid | DALM, HGD&LGD | NA | 74 | F | CD |
| IBD-Dys | Transverse | DALM, LGD | NA | 47 | M | UC |
| IBD-Dys | transverse | DALM, HGD | NA | 57 | M | UC |
| IBD-Dys | Ascending | DALM, LGD | NA | 60 | M | UC |
| IBD-Dys | Ascending | DALM, LGD&HGD | NA | 68 | F | UC |
| IBD-Dys | Transverse | DALM, LGD | NA | 47 | F | CD |
| IBD-Dys | Rectosigmoid | DALM, HGD&LGD | NA | 59 | F | UC |
| IBD-Dys | Rectum | DALM, HGD&LGD | NA | 59 | M | UC |
| IBD-Dys | Sigmoid | LGD | NA | 60 | M | UC |
| IBD-Dys | Rectum | LGD | NA | 50 | M | UC |
| IBD-Dys | Rectosigmoid | LGD-HGD | NA | 50 | F | UC |
| SCRC | Rectum | PD | T3N1 | 48 | F | no IBD |
| SCRC | Rectosigmoid | NA | T1N0M1 | 79 | M | no IBD |
| SCRC | Rectosigmoid | MD | T3N2 | 52 | F | no IBD |
| SCRC | Rectosigmoid | PD | T3N0 | 85 | M | no IBD |
| SCRC | Rectum | PD | T3N0 | 88 | M | no IBD |
| SCRC | Rectosigmoid | MD | T3N2M1 | 65 | F | no IBD |
| SCRC | Sigmoid | MD | T3N0 | 74 | F | no IBD |
| SCRC | Rectum | MD | T3N0M1 | 69 | F | no IBD |
| SCRC | Sigmoid | MD | T2N0 | 78 | M | no IBD |
| SCRC | Ascending | MD-PD | T4N1 | 86 | F | no IBD |
| SCRC | Cecum | MD | T3N1 | 59 | M | no IBD |
| SCRC | Descending | MD | T3N1 | 62 | F | no IBD |
| SCRC | Ascending | MD | T3N1 | 60 | M | no IBD |
| SCRC | Rectum | MD | T3N0 | 57 | M | no IBD |
| SCRC | Rectosigmoid | MD | T3N0 | 71 | F | no IBD |
RNA extraction
TRIzol reagent (Invitrogen, Carlsbad, CA) was used to extract total RNA. One hundred nanograms (ng) of total RNA was used for each microarray and 10 ng for each individual miR-RT-PCR analysis.
MiR microarrays
Microarray assays were performed on 8 chronically inflamed and 8 IBD-dysplastic specimens using miR Labeling Reagent and Hybridization Kits (Agilent Technologies, Palo Alto, CA) and Human miR Microarray Kits (Agilent Technologies, Palo Alto, CA). 100 ng of total RNA from each sample was phosphatase-treated and then labeled with Cyanine 3-pCp. The labeled RNA was purified using Micro Bio-spin columns (Bio-Rad, Hercules, CA) and subsequently hybridized to a human miR microarray slide at 55°C for 20 hours. After hybridization, the slides were washed with Gene Expression Wash Buffer (Agilent Technologies, Palo Alto, CA) and scanned on an Agilent Microarray Scanner using Agilent’s Scan Control version A.7.0.1 software. Raw hybridization intensities were obtained using feature extraction software.
Quantitative reverse transcription polymerase chain reaction (qRT-PCR)
MiR array results were validated via qRT-PCR using TaqMan MiR Assays (Applied Biosystems, Foster City, CA). U6 small nuclear RNA was used for normalization. Quantitative PCR was carried out in duplicate for each sample for both the RNU6B control and each miR.
Statistics
For MiR microarray data, transformation was applied to set all negative raw values at 0.1, followed by quantile normalization. A filter on low gene expression was used so that only probes expressed (flagged as present) in at least one sample were kept. Samples were grouped in accordance with their status and compared using Significance Analysis of Microarrays (SAM) using as threshold a minimum of 2 fold difference. qRT-PCR data was analyzed by average fold-change analysis in combination with the Student’s T test. Associations between miR expression levels and other tissue demographic parameters (IBD type, IBD disease length and activity, cancer grade or stage, anatomic location, age, and gender) were evaluated using Student’s t-test.
We used the area under the empirical receiver operating characteristic (ROC) curve to summarize the ability of hsa-miR-31 qRT-PCR test result to discriminate patients with IBD-related colon cancer or dysplasia from a normal patient or from a non-inflamed or chronically inflamed non-neoplastic IBD patient specimen. We used bootstrapping with 500 iterations to estimate the 95% confidence interval for the area under the ROC curve.
Transfection of miR Mimic
HCT-116 colon cancer cell lines were used for miR transfections. Synthesized RNA duplexes of miR mimics (agomiRs) were purchased from Dharmacon (Lafayette, CO). 30~50% confluent cells were transfected with 60nM of each miR mimic using Lipofectamine RNAi MAX (Invitrogen, Carlsbad, CA). RNA and protein were harvested after 72 hours of transfection. Nonspecific controls for mimics were used as negative controls.
Western Blotting
Cells were lysed in Laemmli sample buffer (Bio-Rad, Hercules, CA) with a protease inhibitor, (Roche, Basel, Switzerland). Protein concentration was estimated using a BCA Protein Assay kit (Pierce, Rockford, MA). Cell lysates (20ng) were electrophoresed on 10% polyacrylamide gels (Bio-Rad, Hercules, CA) and transferred to Immobilon-PSQ polyvinylidene difluoride membranes (Millipore, Bedford, MA). The membranes were blocked with TBS containing 5% skim milk and 0.1% Tween-20, then, incubated with FIH-1 primary antibody from SantaCruz Biotechnology (Santa Cruz, CA. catalog No sc-26219) For loading control, mouse anti-beta actin monoclonal antibody from Sigma-Aldrich Inc. (St. Louis, MO, catalog No.: A3854) was used. After washing, the membranes were incubated with the secondary antibody, HRP conjugated donkey anti-goat IgG (Santa Cruz, CA. catalog No sc-2056) and analyzed using enhanced chemiluminescence-plus reagent (GE Healthcare, Buckinghamshire, UK).
For Western blot quantification, densitometry was carried out using the ImageJ software - (National Institutes of Health, Bethesda, MD).
Luciferase Reporter Assay
A fragment of FIH-1 3’-untranslated region (3’-UTR) containing two miR-31 predicted binding sites at 105bp and 767bp distance from the 5' end of the 3'UTR. was amplified from genomic DNA. The primers were designed to contain Nhe 1 and XbaI restriction sites, at the 5’ and 3’ ends, respectively (ACAGCTAGCCTGCCAGGGGTCAA and TGCCATCTAGAACTACAGCTTCA). The amplicons were cloned downstream of the firefly luciferase structural gene into vector pGL3 (Promega, Madison, WI). After ligation, recombinant clones with both orientations were obtained. Plasmid clones with the insert in reverse orientation were used as universal negative controls for the assay. 8,000 cells per well were seeded onto 96-well plates on the day prior to transfection, then transfected with miR mimics or inhibitors as described above. The constructed pGL3 vector and an internal control pRL-CMV (Renilla luciferase) vector (Promega, Madison, WI) were co-transfected 24 h after miR mimic transfection using Lipofectamine 2000 (Invitrogen, Carlsbad, CA). 24 hours after plasmid vector transfection, the luciferase reporter assay was performed using a Dual-Glo luciferase assay kit (Promega, Madison, WI). Luminescence intensity was measured by VICTOR2 fluorometry (Perkin Elmer, Waltham, MA), and the luminescence intensity of Firefly luciferase was normalized to that of Renilla luciferase. Each treatment condition was performed in four replicates.
Ethical Considerations
Informed consent was obtained from the patients and all specimens were collected under approved IRB protocols at the Johns Hopkins University, University of Maryland and Mount Sinai School of Medicine.
Results
MiR microarrays identify global miR alterations
We hypothesized that neoplastic changes in IBD mucosae represent a continuum that culminates with frank colorectal cancer. Furthermore, we hypothesized that the neoplastic progression displays miR signatures unique to each step along the continuum. To identify the earliest changes indicative of neoplastic transformation, we performed miR microarray analyses on 8 chronically inflamed and 8 IBD-associated dysplastic rectal tissues. After filtering out miRs expressed below background intensity and setting a fold-threshold of 2, we identified 32 miR species that are differentially expressed between inflamed colonic tissue and dysplastic colonic tissue in background of IBD (Table 3). Twenty two miRs were found to be upregulated and ten were downregulated in IBD-Dysplasia vs. inflamed colonic tissues.
Table 3. Dysregulated miRs at the transition point from IBD to IBD-related dysplasia.
Samples were grouped in accordance with their pathological status and compared using SAM software. A threshold of minimum 2 fold difference was used as exclusion criteria.
| Gene ID | Fold Change |
Direction of change | Genomic location |
|---|---|---|---|
| hsa-miR-552 | 15.60 | up in IBD Dysplasia | Chromosome: 1; Location: 1p34.3 |
| hsa-miR-31 | 4.60 | up in IBD Dysplasia | Chromosome: 9; Location: 9p21.3 |
| hsa-miR-31* | 4.45 | up in IBD Dysplasia | Chromosome: 9; Location: 9p21.4 |
| hsa-miR-203 | 4.20 | up in IBD Dysplasia | Chromosome: 14; Location: 14q32.33 |
| hsa-miR-215 | 3.81 | up in IBD Dysplasia | Chromosome: 1; Location: 1q41 |
| hsa-miR-135b | 3.55 | up in IBD Dysplasia | Chromosome: 1; Location: 1q32.1 |
| hsa-miR-200b* | 3.46 | up in IBD Dysplasia | Chromosome: 1; Location: 1p36.33 |
| hsa-miR-200a | 3.38 | up in IBD Dysplasia | Chromosome: 1; Location: 1p36.33 |
| hsa-miR-200c | 3.35 | up in IBD Dysplasia | Chromosome: 12; Location: 12p13.31 |
| hsa-miR-194 | 3.33 | up in IBD Dysplasia | Chromosome: 1; Location: 1q41 Chromosome: 11; Location: 11q13.1 |
| hsa-miR-200b | 3.16 | up in IBD Dysplasia | Chromosome: 1; Location: 1p36.33 |
| hsa-miR-192 | 2.98 | up in IBD Dysplasia | Chromosome: 11; Location: 11q13.1 |
| hsa-miR-192* | 2.95 | up in IBD Dysplasia | Chromosome: 11; Location: 11q13.2 |
| hsa-miR-141 | 2.71 | up in IBD Dysplasia | Chromosome: 12; Location: 12p13.31 |
| hsa-miR-96 | 2.65 | up in IBD Dysplasia | Chromosome: 7; Location: 7q32.2 |
| hsa-miR-194* | 2.61 | up in IBD Dysplasia | Chromosome: 1; Location: 1q41 / Chromosome: 11; Location: 11q13.2 |
| hsa-miR-200a* | 2.36 | up in IBD Dysplasia | Chromosome: 1; Location: 1p36.33 |
| hsa-miR-429 | 2.25 | up in IBD Dysplasia | Chromosome: 1; Location: 1p36.33 |
| hsa-miR-375 | 2.24 | up in IBD Dysplasia | Chromosome: 2; Location: 2q35 |
| hsa-miR-424* | 2.16 | up in IBD Dysplasia | Chromosome: X; Location: Xq26.3 |
| hsa-miR-183 | 2.15 | up in IBD Dysplasia | Chromosome: 7; Location: 7q32.2 |
| hsa-miR-224 | 2.09 | up in IBD Dysplasia | Chromosome: X; Location: Xq28 |
| hsa-miR-892b | 3.64 | down in IBD Dysplasia | Chromosome: X; Location: Xq27.3 |
| hsa-miR-122 | 2.61 | down in IBD Dysplasia | Chromosome: 18; Location: 18q21.31 |
| hsa-miR-223 | 2.53 | down in IBD Dysplasia | Chromosome: X; Location: Xq12 |
| hsa-miR-501-5p | 2.33 | down in IBD Dysplasia | Chromosome: X; Location: Xp11.23 |
| hsa-miR-146b-5p | 2.31 | down in IBD Dysplasia | Chromosome: 10; Location: 10q24.32 |
| hsa-miR-142-3p | 2.31 | down in IBD Dysplasia | Chromosome: 17; Location: 17q22 |
| hsa-miR-139-5p | 2.10 | down in IBD Dysplasia | Chromosome: 11; Location: 11q13.4 |
| hsa-miR-155 | 2.08 | down in IBD Dysplasia | Chromosome: 21; Location: 21q21.3 |
| hsa-miR-1288 | 2.04 | down in IBD Dysplasia | Chromosome: 17; Location: 15788702- 15788776 |
| hsa-miR-490-3p | 2.02 | down in IBD Dysplasia | Chromosome: 7; Location: 7q33 |
Real time quantitative PCR validates microarray data
We chose 6 miR species with differential expression between IBD and IBD-Dysplasia specimens and validated their expression by real time RT-PCR. Furthermore, we assessed the correlation between the fold-differences reported by arrays vs. real time RT-PCR. Figure 1 shows that real time RT-PCR data confirmed the differential expression for all 6 miRs. In addition, the fold difference reported by both methods was identical. These data establish both the feasibility and the reliability of our miR microarray-based screening strategy.
Figure 1. Validation of miRNA array results by qRT-PCR.
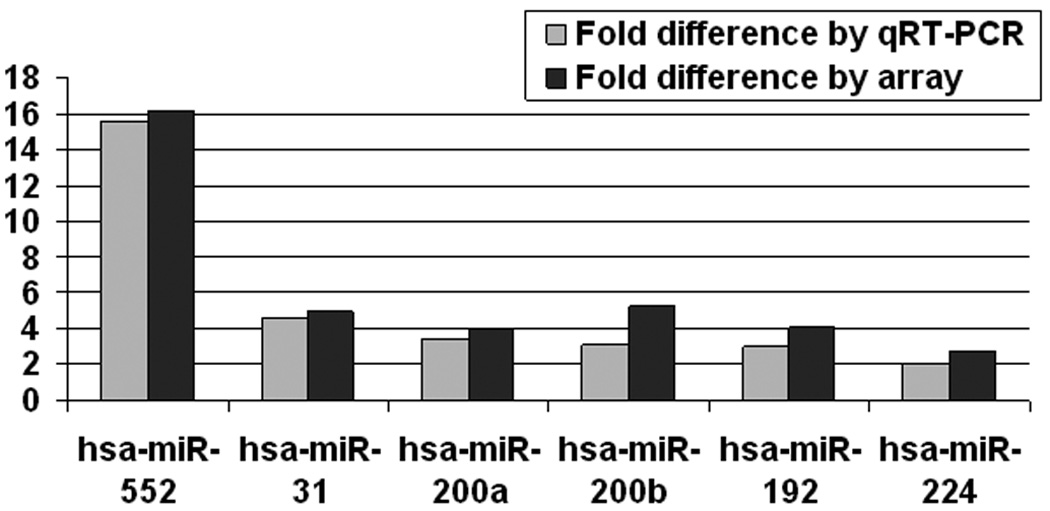
RNA from the same samples used for miRNA array analyses was used as a template for qRT-PCR. Signal obtained for qRT-PCR and miRNA array was averaged for the ulcerative colitis and ulcerative colitis-associated dysplasia groups. Fold difference between the two groups is displayed.
miR expression is independent of colonic segment
There are significant genetic differences between right and left-sided normal mucosae as well as between sporadic colorectal tumors arising in different colonic regions, suggestive of a different biologic predisposition to neoplastic transformation 14. In order to establish a baseline miR expression level throughout the colon, we evaluated the expression level of miR-31 in several colonic segments. We hypothesized that miRs do not change in normal colonic mucosae and therefore, altered miR expression will likely reflect a diseased state, rather than location bias. Alternatively, if miR expression changes from one normal colonic segment to another, then miR level in a diseased state needs to be compared to the level of miR in normal colon from the same segment. RNA from 55 specimens obtained from 14 patients with no history of IBD or GI cancer was used to perform real time RT-PCR for miR-31. Figure 2 demonstrates that the expression level of miR-31 was similar between normal mucosae specimens from cecum, ascending, transverse, descending, sigmoid colon and rectum. No statistical differences among the 6 anatomic location groups were observed.
Figure 2. MiR-31 relative expression levels along the normal colon.
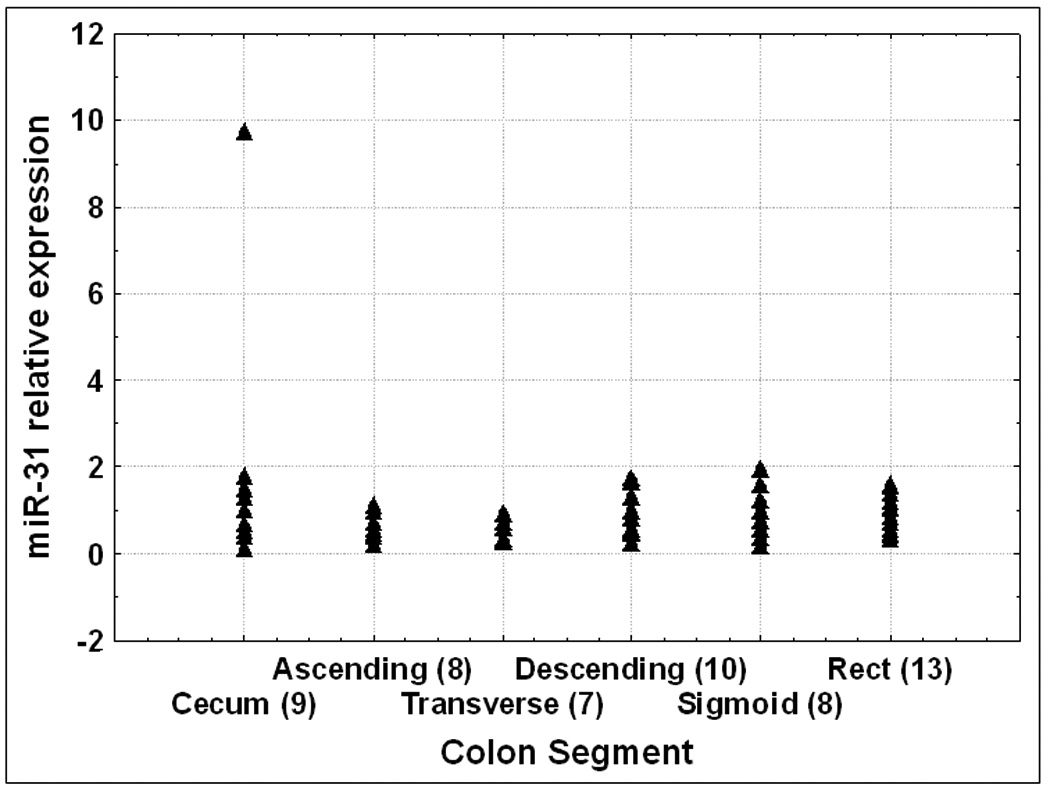
RNA was extracted from 55 normal specimens collected from patients without any history of IBD or colon cancer. qRT-PCR was performed and signal average for normal specimens was calculated. Values displayed are relative to normal average value. The numbers of specimens for each colon segment are shown in brackets.
Mir-31 expression parallels the cancerous progression in IBD
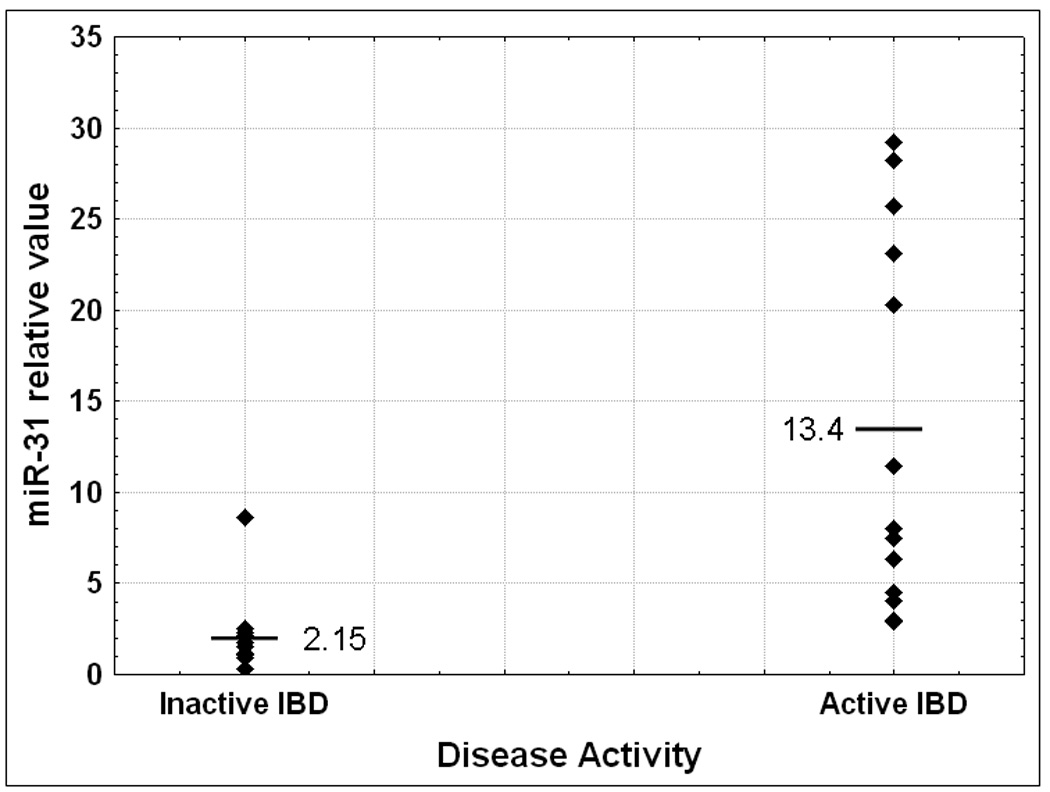
The miRNA array data demonstrated that the expression level of miR-31 increases in the progression from inflamed IBD colonic tissue to dysplasia within IBD colonic tissue. The next question that we addressed was if miR-31 changes at any other transition point in the continuum from non-inflamed to inflamed to dysplastic to cancerous colonic tissue from patients with IBD. First, we compared colonic tissue from patients without IBD (N) with normal, unaffected colonic tissue from patients with IBD (N-IBD). MiR-31 was on average 5.5 fold higher in N-IBD vs. N (Figure 3A), although the difference was only marginally significant (p=0.08 Student’s T-test). The difference between N and N-IBD specimens suggests that the harbingers of neoplasia may already be present even in non-inflamed colonic tissue from patients with IBD. To further investigate this hypothesis, we compared inflamed colonic tissues from patients with IBD to N. We found that miR-31 is 8.2 fold higher in IBD vs. N. This comparison reaches statistical significance, with a p<0.001 Student’s T-test. We further dissected any potential correlations between miR-31 and clinicopathologic data. We obtained information regarding disease activity for 25 IBD patients. In patients with active IBD, miR-31 exhibited a 6.23 fold increase over the quiescent disease group (p=0.002 Student’s T-test, Figure 3B). No statistically significant correlations with age, sex, duration of disease or IBD type were found (supplementary data fig. 1A and 1B and data not shown).
Figure 3. Figure 3A: Dynamic changes of miR-31 expression levels during IBD-related neoplastic transformation.
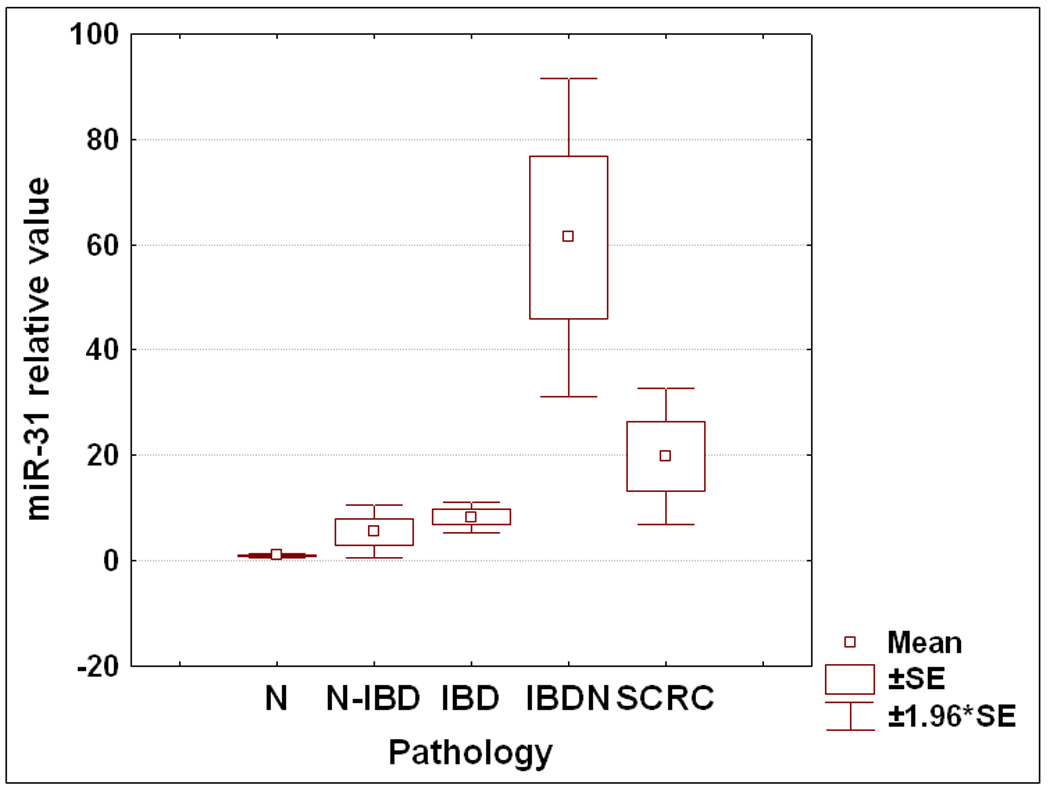
qRT-PCR was performed using as template total RNA extracted from 175 patient specimens. Samples were grouped according to their pathologic status, and the average value for each group was calculated. N=normal from patients without IBD or colorectal cancer history; N-IBD = normal “unaffected” specimens from IBD patients; IBD = “affected” chronically inflamed specimens from IBD patients; IBDN = neoplastic specimens from IBD patients; SCRC = sporadic colorectal cancer specimens from patients with no history of IBD. Fold differences relative to the average for normal specimens group are displayed. Error bars represent standard error of the mean.
Figure 3B: Comparison of miR-31 status with respect to disease activity. Individual miR-31 qRT-PCR levels were grouped according to their pathology. The average value for each group was calculated relative to the average miR-31 level for healthy colon mucosae.
Next, we assessed miR-31 expression in a cohort of specimens with dysplasia and frank colon cancer arising in IBD. No difference in miR-31 expression was noted between the IBD-Dysplasia and IBD-carcinoma (supplementary data fig. 2A). This finding suggests that miR-31 upregulation is an early event in the neoplastic transformation. From this point on, we grouped all neoplastic tissues together. Within the IBDN group no correlation was observed between miR-31 level and age, sex or underlying IBD type (supplementary data fig. 2B and data not shown). Overall, miR-31 was 61.38 fold higher in IBDN (p<0.001 Student’s T-test) compared with normal colon specimens from healthy patients and 11 times higher in IBDN vs. IBD (p<0.001 Student’s T-test, Figure 3A). Taken together, these results suggest that miR-31 exhibits a stepwise progression from normal to chronic inflammation to neoplasia
MiR-31 accurately differentiates sporadic from IBD-associated colon cancer
The pathogenesis and multistep progression of IBD-induced colon carcinogenesis differ from that of sporadic colorectal cancer 15–17. In agreement with our findings demonstrating elevated levels of miR-31 in IBDN, miR-31 was reported to be overexpressed in sporadic colorectal cancer vs. normal colonic specimen18, 19 .Nevertheless, while miR-31 overexpression appears to represent a common event in colorectal carcinogenesis, regardless of its pathogenesis (i.e., sporadic vs. IBD-associated), no published studies have yet directly addressed miR-31 in IBDNs vs. sporadic colorectal cancers. Therefore, we first determined miR-31 expression levels in 15 sporadic colorectal cancers specimens. We confirmed that miR-31 expression is significantly increased in sporadic colorectal cancers compared to normal specimens (19.8-fold difference; p=0.013, Student’s t-test, Figure 3A). Next, we compared expression levels of miR-31 in IBDNs directly with levels in sporadic colorectal cancers. MiR-31 expression was significantly higher in IBDNs than in sporadic colorectal cancers (3-fold difference; p=0.016, Student’s t-test).
MiR-31 is a marker of cancerous transformation in IBD
Next, we evaluated the potential clinical utility of miR-31 expression as disease marker for neoplasia in IBD (Figure 4). MiR-31 sharply differentiated IBDNs from completely normal colonic mucosae (Ns), as demonstrated by an area under the ROC curve (AUROC) of 0.997 (sensitivity 100%, specificity 98.2% at the point on the curve closest to the origin) for miR-31 qRT-PCR. In our comparison of IBDNs vs. “unaffected” non-neoplastic IBD (N-IBDs), the AUROC was 0.933 (sensitivity 100%; specificity 77.3% at the point on the curve closest to the origin) for miR-31 qRT-PCR; while in our comparison of IBDNs vs. inflamed but non-neoplastic IBD (IBDs), the AUROC was 0.877 (sensitivity 87.5%, specificity 71.4 at the point on the curve closest to the origin). These findings further demonstrate the strict correlation between miR-31 expression and step-wise progression from normal to inflammation to cancer in IBD. They also suggest potential usage of miR-31 as a biomarker of inflammatory-neoplastic progression in IBD.
Figure 4. ROC curve analysis of miR-31 expression levels determined by qRT-PCR.
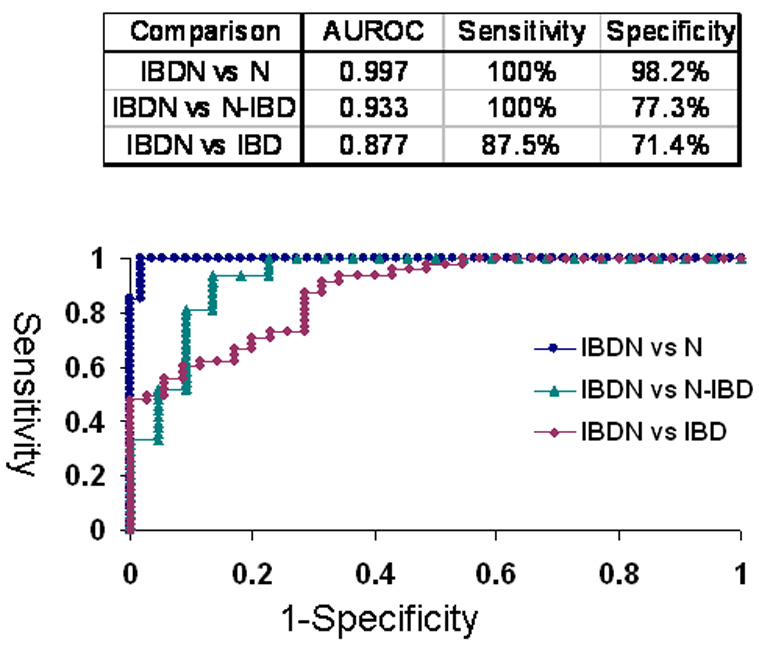
Individual miR-31 qRT-PCR levels were grouped according to their pathology. N=normal from patients without IBD or colorectal cancer history; N-IBD = normal “unaffected” specimens from IBD patients; IBD = “affected” chronically inflamed specimens from IBD patients; IBDN = neoplastic specimens from IBD patients. Area under the ROC curve and optimal sensitivity and specificity for each comparison are shown.
FIH-1 is a direct target of miR-31
MiRs negatively regulate gene expression by binding to complementary sequences within the 3’-UTRs of their targets and inhibiting protein translation 5. In silico analysis of multiple independent databases using algorithms to predict miR biological targets identified factor inhibiting hypoxia inducible factor 1 (FIH1) as a candidate target of miR-31. We sought to determine whether miR-31 does interact with the 3’-UTR of FIH1 (Figure 5A). Compared to nonspecific negative control, miR-31-transfected HCT116 colon cancer cells demonstrated significantly lower FIH1 3’UTR luciferase activity (14.03%, p=0.001 Student’s t-test). Reversing orientation of the FIH1 3’UTR did not altered the luciferase activity, confirming the direct nature of the interaction between miR-31 and the 3’UTR of FIH1 mRNA. To validate the modulating effect of miR-31 on FIH1 expression, we determined FIH1 protein levels by Western blotting (Figures 5B and 5C). In cells transfected with miR-31, FIH1 was substantially reduced (46.63%) compared to cells transfected with a nonspecific control miR or with mimics of miR-21(a miR with no predicted binding site within the 3’UTR of FIH1) and miR-224 (a miR that does have one predicted binding site within the FIH1 3’UTR) (Figures 5B and 5C). Thus, after determining that miR-31 downregulates FIH1 protein levels by directly interacting with its 3’UTR, we concluded that FIH1 represents a direct target of miR-31 in colon cancer cells.
Figure 5. A.Interaction of miR-31 with FIH1 3’UTR.
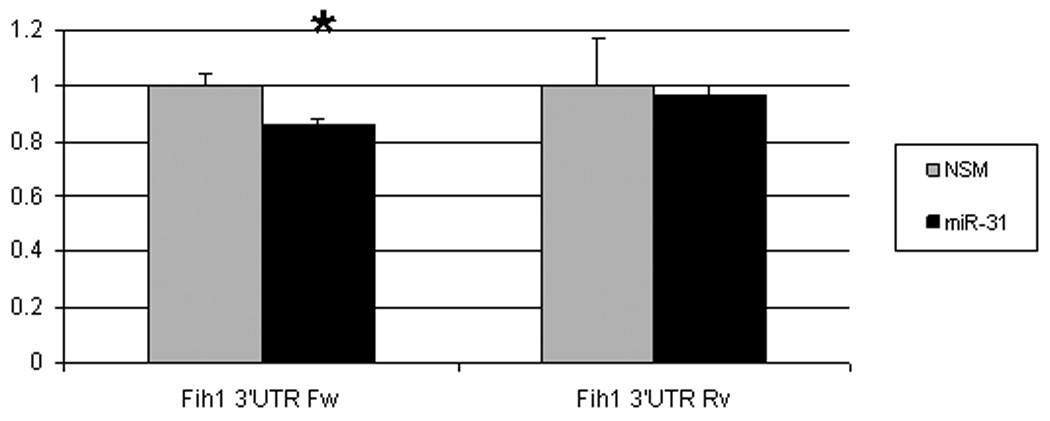
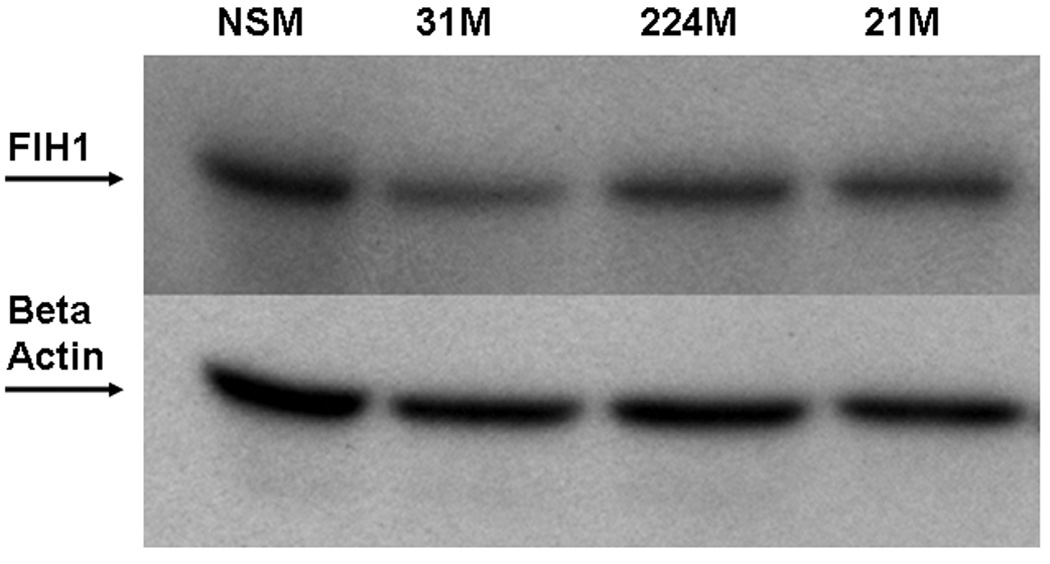
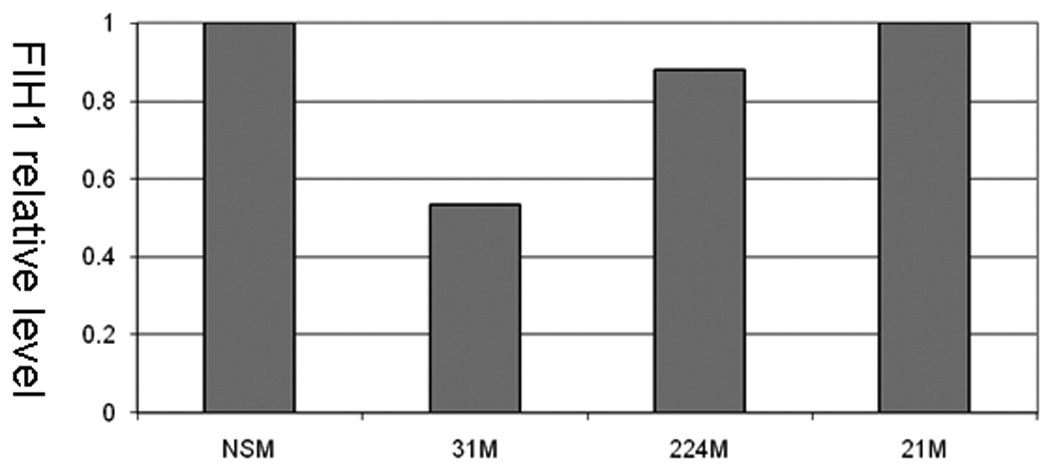
HCT-116 colon cancer cells were transfected with miR-31 mimic or a non-specific control mimic (NSM). After 24h, cells were co-transfected with a construct containing a truncated FIH1 3’UTR containing two miR-31 putative binding sites fused to the firefly luciferase gene. As a negative control, the 3’UTR was cloned in reverse orientation. When FIH1 3’UTR forward orientation was used, a moderate but statistically significant difference was observed in miR-31-transfected cells compared to the nonspecific mimic. This inhibitory effect disappeared with inversion of the FIH1 3’UTR. B. Effect of miR-31 on FIH1 protein levels. Western blotting was performed on cells transfected with miR-31. As a negative control, cells were transfected with either 1) a non-specific mimic, 2) miR-21 (which has no predicted binding site in the 3’UTR of FIH1), or 3) miR-224 (which does have one predicted binding site within the FIH1 3’UTR). C. Quantification of FIH1 protein levels. Densitometry of Western blots was carried out using Image J software.
Discussion
Dysregulated miR expression has been reported across a broad spectrum of human cancers, suggesting their involvement in carcinogenesis in general. Several studies have demonstrated that miRs can exhibit oncogenic as well as tumor-suppressive activity. A better understanding of miR expression alterations in human cancer may lead to improved diagnosis and management, ultimately leading to improved survival and quality of life for cancer patients.
Colorectal cancer represents a well-defined complication of longstanding colonic inflammation in patients with IBD. The risk of cancer increases with the extent and duration of colonic inflammation. Moreover, dysplasia identified in inflamed colonic mucosae correlates strongly with multiple concomitant foci of dysplasia or frank carcinoma elsewhere in the same colon. Therefore, dysplasia in IBD often leads to total colonic resection, performed prophylactically to prevent the morbidity and mortality associated with colon cancer per se. Unfortunately, histopathologic diagnosis of dysplasia is problematic. Morphologic alterations associated with chronic inflammation make dysplasia difficult to diagnose and prone to subjective interpretation3. Current guidelines recommend that any lesion suspicious for dysplasia must be evaluated by two independent pathologists who specialize in gastrointestinal pathology. It is therefore crucial to develop a better understanding of malignant progression in IBD, in the hope that this improved understanding will translate into a positive impact on the early diagnosis, management and individualization of medical and surgical care for IBD patients.
To date, there have been no published reports describing the involvement of miRs in the pathogenesis, diagnosis or prognosis of colonic neoplasia arising in the setting of IBD. In the current study, we set forth to determine global miR expression alterations during neoplastic progression in IBD. In order to detect the earliest changes associated with neoplastic transformation, we first compared global miR expression levels in IBD-associated dysplasia vs. chronically inflamed IBD specimens. This analysis identified aberrant expression of several miRs (Table 1). These miRs are associated with neoplastic progression in IBD, and some may even play an etiologic role. Therefore, given the current diagnostic difficulties with correctly identifying dysplasia in IBD, it is attractive to speculate that at least some of these miRs may be applied to the early diagnosis or prediction of neoplastic progression in IBD.
We selected miR-31 for further studies because it was one of the most differentially expressed miR species between IBDs and IBDNs. Additionally, previous work from other laboratories found miR-31 to be upregulated in sporadic colorectal carcinomas 18–20. However, its expression in IBD and IBD-associated cancers or dysplasias has not been previously reported.
To date, there are no studies describing the relationship between miR expression and colonic anatomic location. With miRs emerging as a new class of potential biomarkers for cancer diagnosis, this relationship becomes especially important in the context of differences between miR expression in right vs. left-sided colon, since current screening methods often miss right-sided lesions. Therefore, we sought to determine whether miR-31 expression levels were affected by colonic anatomic location. By systematically assessing the expression of miR-31 in 55 colonic mucosae specimens, we established that miR-31 expression levels do not differ among different anatomic locations. This finding suggests that, at least in the case of miR-31, dysregulated expression is indicative of a pathologic condition, rather than a location bias. We subsequently sought to comprehensively determine miR-31 expression levels in a large independent cohort of specimens collected at different stages of IBD-related neoplastic transformation. Our aim was to dissect changes in miR-31 expression as they occurred along the inflammation-cancer axis. We found that the expression of miR-31 becomes progressively higher during progression from normal colonic mucosae, to inflamed tissue, with the highest level in cancer. The increase in miR-31 expression was independent of age, sex, anatomic location, stage, or differentiation grade (data not shown). This independence of clinical parameters suggests that miR-31 may be associated with inherently unique molecular pathways underlying IBD-associated colon carcinogenesis. Of note, a statistically significant increase in miR-31 expression was observed at both the dysplastic and cancerous stages vs. chronically inflamed tissue in patients with IBD. This relatively early upregulation of miR-31 suggests that early changes associated with neoplastic transformation can be accurately diagnosed by elevations in miR-31. While it is difficult at this point to directly determine whether miR-31 plays an etiologic role in IBD-associated malignant transformation, its expression levels can potentially already be used to diagnose or predict early carcinogenesis.
Previous studies reported that miR-31 is upregulated in sporadic colorectal cancers. However, there have been no reports regarding miR-31 or any other miR expression in IBD-associated colon cancers. Our data demonstrates that miR-31 expression levels are significantly higher in IBD-associated cancers than in their sporadic colorectal counterparts. This result confirms that while there are similarities between IBDNs and sporadic colorectal cancers, there are also several important differences, including miR-31 expression levels. Increased miR-31 expression in IBDNs vs. sporadic colorectal cancers may also be due to the marked inflammation associated with IBDNs. This finding may have great potential for clinical application, since miR-31 expression may ultimately be applied to the critical decision of colonic resection (in the case of IBD-related neoplasia) vs. localized polypectomy/mucosal resection (in the case of sporadic neoplasia). Future studies in independent cohorts are required to evaluate and validate the performance of miR-31 qRT-PCR levels in this context.
The ability to isolate nucleic acids suitable for molecular analyses from serum samples provides a powerful venue for biomarker discovery and application. Recent studies have demonstrated that due to their small size, as well as to their containment within protein complexes, miRs are more resistant to degradation than are mRNA or DNA, and therefore potentially more suitable as blood-based biomarkers for early cancer detection 21. Interestingly, results of TaqMan low-density array qRT-PCR profiling did not detect miR-31 in human plasma from a healthy donor21. Since its normal level is virtually zero, it is tempting to speculate that if miR-31 was released into the blood by cellular breakdown or apoptosis in IBD patients, it would be stable and easily detected.
The progressive increase we observed in expression levels from normal to chronically inflamed mucosae to dysplasia and frank cancer mirrors the IBD-related adenocarcinoma sequence. Determining the actual functions of miR-31 in colon inflammation and carcinogenesis may provide valuable new insights crucial to our understanding of biological events that promote evolution from chronic inflammation to carcinoma in general.
The requirement for neovascularization is universal to all solid tumors, including colon cancers. Pathological angiogenesis has been shown to play a pivotal role in tumor progression and metastasis22. Experimental and clinical studies have demonstrated that angiogenesis also plays a pivotal role in inflammatory bowel disease 23. Studies have shown that inhibition of angiogenic response in inflammatory bowel disease attenuates disease pathology24, 25. The mechanism of tumor angiogenesis is primarily mediated by hypoxia through chronic activation of the hypoxia inducible factor (HIF) pathway, leading to the production of vascular endothelial growth factor and basic fibroblast growth factor26–28. Interestingly, in our study, miR-31 negatively regulates FIH1. FIH1 is a hydroxylase that catalyzes the post-translational modification of HIF. Hydroxylation of HIF1 both causes its degradation and limits its activity. Sustained increased expression of miR-31 during chronic inflammation could therefore translate into decreased FIH1 repressor activity, allowing for increased transcription of HIF1-regulated genes. While this manuscript was in preparation, a new functional study describing the FIH1 regulation in head and neck squamos cell carcinoma by mir-31 was published. The authors also demonstrated that ectopic miR-31 expression increased oncogenic phenotypes of head and neck squamos cell carcinoma cells under normoxic conditions in cell culture or tumor xenografts.
The current study brings several critical advances: 1) this is the first study to assess the expression of any miRs in colonic dysplasia and cancer arising in IBD; 2) this is the first report assessing the expression of any miR in distinct colonic anatomic locations, with the purpose of identifying potentially confounding changes related to location rather than pathology per se; 3) this is the first report to identify miR-31 as a significantly differentially expressed miR species along the axis of inflammation to cancer in IBD; 4) this study demonstrates that miR-31 can accurately discriminate between IBD-associated and sporadic colonic neoplastic lesions; and 5) this study suggests that miR-31 is a potential biomarker for the early detection or prediction of dysplasia and colorectal carcinoma developing in patients with IBD. Notably, all of these findings were demonstrated in a large cohort of patient specimens. Finally, this study identifies FIH1, a repressor of the pro-angiogenic hypoxia-inducible factor HIF1, as a direct target of miR-31 in colon cancer cells.
Supplementary Material
N-IBD UC = normal “unaffected” specimens from patients with ulcerative colitis; N-IBD CD = normal “unaffected” specimens from patients with Crohn’s disease; IBD UC = chronically inflamed specimens from patients with ulcerative colitis; IBD CD = chronically inflamed specimens from patients with Crohn’s disease;
IBD-Dys = dysplastic specimens from IBD patients. Error bars represent standard error of the mean.
IBDN UC = neoplastic specimens from patients with ulcerative colitis. . IBDN CD = neoplastic specimens from patients with Crohn’s disease. Error bars represent standard error of the mean.
Acknowledgment
This study was supported by The Broad Medical Research Program of the Broad Foundation IBD-0271R and The National Institute of Health Grant Number RO1CA133012 and K08DK078046
Abbreviations
- IBD
inflammatory bowel disease
- IBDN
IBD-related neoplasia
- miR
microRNA
- FIH1
factor inhibiting hypoxia inducible factor 1
- ROC
receiver operating characteristic
- qRT-PCR
quantitative reverse transcription polymerase chain reaction
References
- 1.Eaden JA, Abrams KR, Mayberry JF. The risk of colorectal cancer in ulcerative colitis: a meta-analysis. Gut. 2001;48:526–535. doi: 10.1136/gut.48.4.526. [DOI] [PMC free article] [PubMed] [Google Scholar]
- 2.Jess T, Gamborg M, Matzen P, et al. Increased risk of intestinal cancer in Crohn's disease: a meta-analysis of population-based cohort studies. Am J Gastroenterol. 2005;100:2724–2729. doi: 10.1111/j.1572-0241.2005.00287.x. [DOI] [PubMed] [Google Scholar]
- 3.Eaden J, Abrams K, McKay H, et al. Inter-observer variation between general and specialist gastrointestinal pathologists when grading dysplasia in ulcerative colitis. J Pathol. 2001;194:152–157. doi: 10.1002/path.876. [DOI] [PubMed] [Google Scholar]
- 4.Itzkowitz SH, Harpaz N. Diagnosis and management of dysplasia in patients with inflammatory bowel diseases. Gastroenterology. 2004;126:1634–1648. doi: 10.1053/j.gastro.2004.03.025. [DOI] [PubMed] [Google Scholar]
- 5.Bartel DP. MicroRNAs: target recognition and regulatory functions. Cell. 2009;136:215–233. doi: 10.1016/j.cell.2009.01.002. [DOI] [PMC free article] [PubMed] [Google Scholar]
- 6.Croce CM. Causes and consequences of microRNA dysregulation in cancer. Nat Rev Genet. 2009;10:704–714. doi: 10.1038/nrg2634. [DOI] [PMC free article] [PubMed] [Google Scholar]
- 7.He L, Thomson JM, Hemann MT, et al. microRNA polycistron as a potential human oncogene. Nature. 2005;435:828–833. doi: 10.1038/nature03552. [DOI] [PMC free article] [PubMed] [Google Scholar]
- 8.Costinean S, Zanesi N, Pekarsky Y, et al. Pre-B cell proliferation and lymphoblastic leukemia/high-grade lymphoma in E(mu)-miR155 transgenic mice. Proc Natl Acad Sci U S A. 2006;103:7024–7029. doi: 10.1073/pnas.0602266103. [DOI] [PMC free article] [PubMed] [Google Scholar]
- 9.Calin GA, Dumitru CD, Shimizu M, et al. Frequent deletions and down-regulation of micro- RNA genes miR15 and miR16 at 13q14 in chronic lymphocytic leukemia. Proc Natl Acad Sci U S A. 2002;99:15524–15529. doi: 10.1073/pnas.242606799. [DOI] [PMC free article] [PubMed] [Google Scholar]
- 10.Cimmino A, Calin GA, Fabbri M, et al. miR-15 and miR-16 induce apoptosis by targeting BCL2. Proc Natl Acad Sci U S A. 2005;102:13944–13949. doi: 10.1073/pnas.0506654102. [DOI] [PMC free article] [PubMed] [Google Scholar]
- 11.Kan T, Sato F, Ito T, et al. The miR-106b-25 polycistron, activated by genomic amplification, functions as an oncogene by suppressing p21 and Bim. Gastroenterology. 2009;136:1689–1700. doi: 10.1053/j.gastro.2009.02.002. [DOI] [PMC free article] [PubMed] [Google Scholar]
- 12.Petrocca F, Visone R, Onelli MR, et al. E2F1-regulated microRNAs impair TGFbeta-dependent cell-cycle arrest and apoptosis in gastric cancer. Cancer Cell. 2008;13:272–286. doi: 10.1016/j.ccr.2008.02.013. [DOI] [PubMed] [Google Scholar]
- 13.Wu F, Zikusoka M, Trindade A, et al. MicroRNAs are differentially expressed in ulcerative colitis and alter expression of macrophage inflammatory peptide-2 alpha. Gastroenterology. 2008;135:1624–1635. e24. doi: 10.1053/j.gastro.2008.07.068. [DOI] [PubMed] [Google Scholar]
- 14.Birkenkamp-Demtroder K, Olesen SH, Sorensen FB, et al. Differential gene expression in colon cancer of the caecum versus the sigmoid and rectosigmoid. Gut. 2005;54:374–384. doi: 10.1136/gut.2003.036848. [DOI] [PMC free article] [PubMed] [Google Scholar]
- 15.Itzkowitz S. Colon carcinogenesis in inflammatory bowel disease: applying molecular genetics to clinical practice. J Clin Gastroenterol. 2003;36:S70–S74. doi: 10.1097/00004836-200305001-00012. discussion S94–6. [DOI] [PubMed] [Google Scholar]
- 16.Risques RA, Rabinovitch PS, Brentnall TA. Cancer surveillance in inflammatory bowel disease: new molecular approaches. Curr Opin Gastroenterol. 2006;22:382–390. doi: 10.1097/01.mog.0000231812.95525.a7. [DOI] [PubMed] [Google Scholar]
- 17.Selaru FM, Xu Y, Yin J, et al. Artificial neural networks distinguish among subtypes of neoplastic colorectal lesions. Gastroenterology. 2002;122:606–613. doi: 10.1053/gast.2002.31904. [DOI] [PubMed] [Google Scholar]
- 18.Bandres E, Cubedo E, Agirre X, et al. Identification by Real-time PCR of 13 mature microRNAs differentially expressed in colorectal cancer and nontumoral tissues. Mol Cancer. 2006;5:29. doi: 10.1186/1476-4598-5-29. [DOI] [PMC free article] [PubMed] [Google Scholar]
- 19.Slaby O, Svoboda M, Fabian P, et al. Altered expression of miR-21, miR-31, miR-143 and miR-145 is related to clinicopathologic features of colorectal cancer. Oncology. 2007;72:397–402. doi: 10.1159/000113489. [DOI] [PubMed] [Google Scholar]
- 20.Sarver AL, French AJ, Borralho PM, et al. Human colon cancer profiles show differential microRNA expression depending on mismatch repair status and are characteristic of undifferentiated proliferative states. BMC Cancer. 2009;9:401. doi: 10.1186/1471-2407-9-401. [DOI] [PMC free article] [PubMed] [Google Scholar]
- 21.Mitchell PS, Parkin RK, Kroh EM, et al. Circulating microRNAs as stable blood-based markers for cancer detection. Proc Natl Acad Sci U S A. 2008;105:10513–10518. doi: 10.1073/pnas.0804549105. [DOI] [PMC free article] [PubMed] [Google Scholar]
- 22.Carmeliet P, Jain RK. Angiogenesis in cancer and other diseases. Nature. 2000;407:249–257. doi: 10.1038/35025220. [DOI] [PubMed] [Google Scholar]
- 23.Scaldaferri F, Vetrano S, Sans M, et al. VEGF-A links angiogenesis and inflammation in inflammatory bowel disease pathogenesis. Gastroenterology. 2009;136:585–595. e5. doi: 10.1053/j.gastro.2008.09.064. [DOI] [PubMed] [Google Scholar]
- 24.Danese S, Sans M, de la Motte C, et al. Angiogenesis as a novel component of inflammatory bowel disease pathogenesis. Gastroenterology. 2006;130:2060–2073. doi: 10.1053/j.gastro.2006.03.054. [DOI] [PubMed] [Google Scholar]
- 25.Fishman SJ, Feins NR, RJ DA, Folkman J. Long-term remission of Crohn's disease treated with thalidomide: a seminal case report. Angiogenesis. 1999;3:201–204. doi: 10.1023/a:1009027315912. [DOI] [PubMed] [Google Scholar]
- 26.Calvani M, Rapisarda A, Uranchimeg B, et al. Hypoxic induction of an HIF-1alpha-dependent bFGF autocrine loop drives angiogenesis in human endothelial cells. Blood. 2006;107:2705–2712. doi: 10.1182/blood-2005-09-3541. [DOI] [PMC free article] [PubMed] [Google Scholar]
- 27.Eatock MM, Schatzlein A, Kaye SB. Tumour vasculature as a target for anticancer therapy. Cancer Treat Rev. 2000;26:191–204. doi: 10.1053/ctrv.1999.0158. [DOI] [PubMed] [Google Scholar]
- 28.Rademakers SE, Span PN, Kaanders JH, et al. Molecular aspects of tumour hypoxia. Mol Oncol. 2008;2:41–53. doi: 10.1016/j.molonc.2008.03.006. [DOI] [PMC free article] [PubMed] [Google Scholar]
Associated Data
This section collects any data citations, data availability statements, or supplementary materials included in this article.
Supplementary Materials
N-IBD UC = normal “unaffected” specimens from patients with ulcerative colitis; N-IBD CD = normal “unaffected” specimens from patients with Crohn’s disease; IBD UC = chronically inflamed specimens from patients with ulcerative colitis; IBD CD = chronically inflamed specimens from patients with Crohn’s disease;
IBD-Dys = dysplastic specimens from IBD patients. Error bars represent standard error of the mean.
IBDN UC = neoplastic specimens from patients with ulcerative colitis. . IBDN CD = neoplastic specimens from patients with Crohn’s disease. Error bars represent standard error of the mean.