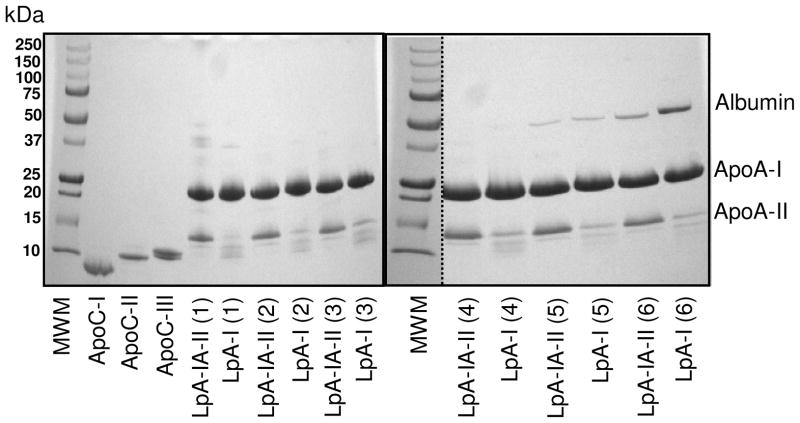
Figure 3. Major apolipoproteins in LpA-I and LpA-I/A-II subfractions as visualized by SDS-PAGE.
4–30% SDS-PAGE of isolated LpA-I, LpA-I/A-II subfractions (separated by FPLC, Figure 2; adjusted to 1 mg/ml total protein). ApoA-I, apoA-II band locations as well as albumin contamination (prevalent in LpA-I fractions 6) are indicated. ApoC-I, apoC-II and apoC-III standards were included. Lanes with molecular weight standards are denoted as MWM. Gels were stained with Coomassie Blue.

