Abstract
We describe a simple tandem mass spectrometric approach towards structural characterization of mycolic acids, the long-chain α-alkyl-β-hydroxy fatty acids unique to mycobacteria and related taxa. Upon collisionally activated dissociation in a linear ion-trap (LIT) or tandem quadrupole mass spectrometer, the [M – H]− ions of mycolic acid generated by electrospray ionization undergo dissociation to eliminate the meroaldehyde residue, leading to formation of carboxylate anions containing α-alkyl chains. The structural information from these fragment ions affords structural assignment of the mycolic acids, including the lengths of the meromycolate chain and of the α-branch. This study revealed that the mycolic acids isolated from pathogenic Rhodococcus equi 103 contained a series of homologous ions having C30 to C50 chain with 0–2 double bonds. The α-branch ranged from C10 to C18 with 0 to 1 double bond, in which 16:0 and 14:0 are the most prominent, while the meromycolate chain ranged from C14 to C34 with 0 to 2 double bonds. The major molecular species consisted of more than three isomers that differ by the lengths of the α-branch or meromycolate chain and up to 10 isobaric isomers were identified for some minor ions. We also employed tandem quadrupole mass spectrometry with precursor-ion and neutral loss scans for profiling mycolic acid with specific structure in mixtures. The tandem spectra obtained from precursor-ion scans of m/z 255 (16:0-carboxylate anion), and of 227 (14:0-carboxylate anion) may provide a simple specific means for classification of Rhodococci species; whereas tandem spectra from neutral loss of meroaldehyde residue scans provided a simple approach to reveal the mycolic acid molecules with specific meromycolate chain in mixtures.
Keywords: mycolic acids, α-alkyl-β-hydroxy fatty acids, Rhodococcus equi, Rhodococcus rhodnii, Rhodococcus terrace, tandem mass spectrometry, electrospray ionization
Introduction
Rhodococcus equi (R. equi) is a gram-positive intracellular pathogen that can cause severe bronchopneumonia in foals and in immuno-compromised patients such as individuals with AIDS [1; 2; 3; 4; 5; 6; 7; 8; 9]. It is one of the most important causes of lung disease in foals between 1 and 6 months of age [1; 3; 7]. The cell envelope contains many lipid species with unusual structures, including mycolic acids, trehalose monomycolate (TMM) and trehalose dimycolate (TDM) [10], which are also found in Rhodococcus rhodnii, a non-pathogenic species with longer mycolic acid chains [11].
Mycolic acids are long-chain α-alkyl-β-hydroxy fatty acids unique to mycobacteria and related taxa and are believed to play a crucial role in the architecture of their cell envelope [12]. The mycolic acids of members of the genus Rhodococcus contain no functional groups other than unsaturated bonds. Two different profiles of Rhodococcus mycolic acids have been reported. The first contains from 28 to 46 carbons with 0 or 1 unsaturated bond. The second consists of 34 to 54 carbons with 0–4 unsaturated bonds [10]. Mycolic acids in the cell wall are covalently bonded to the cell wall arabinogalactan and are also esterified to trehalose to form α,α′-trehalose dimycolate (TDM) (cord factor), and α,α′-trehalose monomycolate (TMM).
Electron impact gas chromatography mass spectrometry (EI-GC/MS) has been used for characterization of mycolic acids [11; 13; 14; 15; 16]. This approach requires first conversion of mycolic acids into methyl esters, separation by the number of double bonds into various classes using silver ion-containing silica TLC plate, followed by MS analysis [15; 16]. Alternately, the mycolic acid methyl esters are further converted into trimethysilyl derivatives before GC/MS analysis [11; 13; 14]. Here, we describe a simple electrospray tandem mass spectrometric method towards structural characterization of mycolic acids without the tedious derivatization steps, resulting in assignment of the chain lengths of the meromycolate and α-branch residues in mycolic acid molecules. This tandem mass spectrometric approach enables the structures of mycolic acids in a mixture isolated from cell envelope of Rhodococcus equi, including the numerous isomers varied by meromycolate and α-branch chain lengths, and by the number of double bonds in each of the molecules to be unfolded in detail. However, no effort has been made to locate the position of double bond(s) in the present study.
Method
Sample preparation
Rhodococcus equi strain 103, a virulent, plasmid-containing strain which was originally isolated from the lung of a pneumonic foal in Ontario, Canada [17], R. terrace and R. rhodnii were grown in 50 ml brain heart infusion broth (BHI) at 37°C, 30°C and 37°C, respectively, with shaking at 200 rpm to an optical density (600 nm) of 1.0 and autoclaved at 121°C under 2.15 kPa for 20 min. Cells were harvested by centrifugation at 4,000 rpm in a Hettich table top centrifuge. The pellet was resuspended in 5 ml phosphate-buffered saline and transferred into a glass centrifuge tube. After cetrifugation as described above, the pellet was resuspended in 3 ml chloroform:methanol (2:1; v/v). The solution was sonicated in a water bath for 5 min at 21°C and was continually stirred with a magnetic stirrer at 21°C for another 1 h. The supernatant was collected after centrifugation and the pellet was re-extracted as described above. The pooled supernatants were re-centrifuged to eliminate possibly remaining bacteria. The extract was transferred into a pre-weighed glass tube and the solvent was evaporated in a water bath at 50°C under a constant stream of nitrogen. The dried tubes with lipids were stored at −20°C.
Mycolic acids that are covalently bound to the cell wall (bound mycolic acids) were prepared as described previously [18]. In brief, cells from 3 ml of a stationary overnight culture in brain Heart infusion broth (BHI) were harvested by centrifugation at 9,000 g for 10 min. The pellet was resuspended in 2 ml chloroform:methanol (2:1; v/v). After shaking at ambient temperature for 1 h, the non-bound lipid in the organic layer was removed from pellet following centrifugation. The pellet was hydrolyzed with 4 ml 10% KOH for 1 h at 80°C, acidified with 6N HCl to pH 2 and extracted with 1 ml n-hexane. The organic phase containing bound mycolic acids was transferred into a pre-weighed glass tube and the solvent was removed by distillation at 80°C. For further purification, 10 mg of the crude lipid extracts in 300ul CHCl3/CH3OH (2:1; v/v), were loaded to a 3ml/200mg Macherey-Nagel amino Chromabond Sep-Pak column (Duren, Germany). The column was first washed with 2 ml EtOAc:Hexane (15:85 v/v), followed by elution with 1.5 ml diisopropyl ether:HOAc (98:2; v/v) (by gravity) to a vial. The eluant containing mycolic acids was dried under a stream of nitrogen. The dried mycolic acid was redissolved in CHCl3/CH3OH (1/2) before ESI-MS analysis.
Mass Spectrometry
Low-energy CAD MSn experiments were conducted on a Finnigan (San Jose, CA) linear ion-trap (LIT) mass spectrometer with Xcalibur operating system. Constant neutral loss (CNL) and precursor ion scans were conducted on a Finnigan TSQ 7000 tandem quadrupole instrument with ICIS software. Mycolic acid mixtures dissolved in CHCl3/CH3OH (1/2) or CHCl3/CH3OD (1/2) (for H-D exchange) were continuously infused (2 μL/min) to the ESI source, where the skimmer and the electrospray needle were set at ground potential and at 4.5 kV, respectively. The temperature of the heated capillary was set 300 °C. The automatic gain control of the ion trap was set to 5 × 10⁴, with a maximum injection time of 200 ms. Helium was used as the buffer and collision gas at a pressure of 1×10⁻³ mbar (0.75 mTorr). The MSn experiments were carried out with an optimized relative collision energy ranging from 18–25% and with an activation q value of 0.25. The activation time was set at 30–50 ms to leave a minimal residual abundance of precursor ion to around 10%. Mass spectra were accumulated in the profile mode, typically for 3–10 min for MSn (n = 2 and 3) spectra. The mass resolution of the instrument was tuned to 0.6 Da at half peak height.
Nomenclature
Mycolic acids (R1-CH(OH)-CH(R2)-COOH) (see Scheme 1) consist of a meromycolic chain (R1CH) (the part from the R1 terminal to the β-hydroxy carbon) and an α-branch (R2CH-COOH) (the rest remaining part of the molecule that contains the shorter R2 group). For abbreviation, mycolic acids were designated as “meromycolate branch/α-branch” mycolic acid. For example,, 2-tetradecyl-3-hydroxy-eicosanoic acid which contains a C18-meromycolate chain and a C16 α-branch (i.e., R1 = C17H35, R2 = C14H29), is designated as 18:0/16:0-mycolic acid. The mycolic acids with unsaturated bond(s) such as 2-tetradecyl-3-hydroxy-eicosenoic acid and 2-tetradecenyl-3-hydroxy-eicosanoic acid are designated as 18:1/16:0-mycolic acid and 18:0/16:1-mycolic acid, respectively. Thus, designation of 18:1/16:0-mycolic acid signifies that the molecule contains an unsaturated 18:1-meromycolate chain and a α-C14H29 group (R1 = C17H33, R2 = C14H29); while 18:0/16:1-mycolic acid signifies that the molecule consists of a 18:0-meromycolate chain and an unsaturated α-C14H27 group (R1 = C17H35, R2 = C14H27). Both 18:1/16:0- and 18:0/16:1-mycolic acids contain 34 carbons with one double bond and are abbreviated as C34:1.
Scheme 1.
The fragmentation processes proposed for the [M – H]− ions of mycolic acids.
Results and Discussion
The ESI-MS profiles of the free mycolic acid (i.e., extracted without prior hydrolysis process) (see supplemental materials Figure S1, Panels, a, c, and e) and the bound mycolic acid (i.e., extracted after hydrolysis) (Figure S1, Panels, b, d, and f) are similar. The composition of each of the m/z from both the free and bound mycolic acids is also similar (data not shown). However, the s/n of the spectra from the later set (Figures S1b, S1d and S1f) appeared to be 2–3 times better than that of the corresponding spectra from the former set (Figure S1a, S1c and S1e), suggesting that the majority of the mycolic acid is covalently linked to the cell wall. The mass spectrometric approaches toward structural characterization of the mycolic acids isolated from R. equi and from R. rhodnii are described below.
Determination of the chain lengths of meromycolate and α-branch moieties in mycolic acids
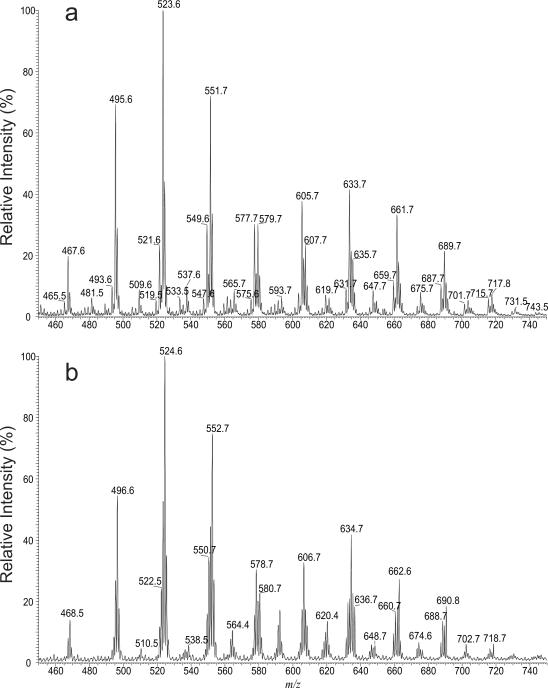
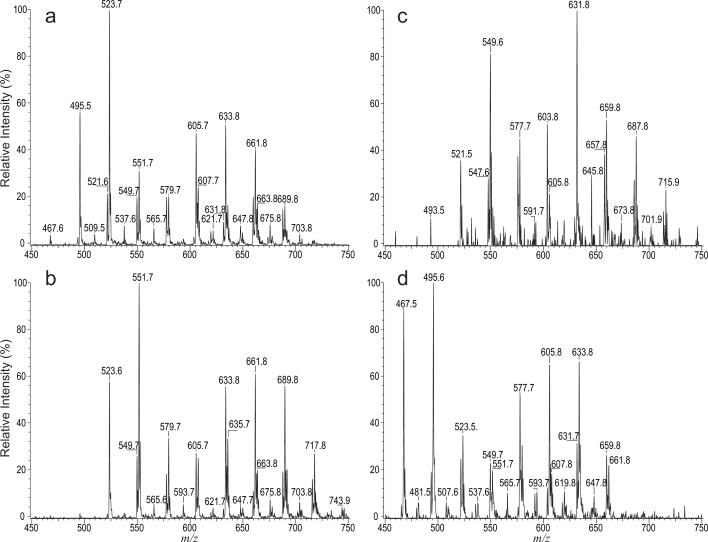
When the mycolic acid mixture isolated from R. equi was dissolved in CHCl3/CH3OH and subjected to ESI in the negative-ion mode, several series of the [M – H]− ions were observed (Figure 1a), while the analogous [M – D]− ions (Figure 1b) were observed when the same mixture dissolved in CHCl3/CH3OD was ionized. The ESI-MS profiles of the [M – D]− ions (Figure 1b) and of the [M – H]− ions (Figure 1a) are nearly identical but the m/z values of the [M – D]− ions are 1 Da higher than the analogous [M – H]− ions, resulting from H-D exchange of the β-hydroxy hydrogen to deuterium. The results are consistent with the notion that the mycolic acids consist of two exchangeable hydrogens, one at hydroxyl group and one at the carboxylate residue.
Figure 1.
The ESI/MS spectra of the [M – H]− ions (a) and the corresponding [M – D]− ions (b) after H-D exchange of the mycolic acid isolated from wild-type R. equi, strain 103. The 1 Da mass shift seen in Panel (b) is due to H-D exchange.
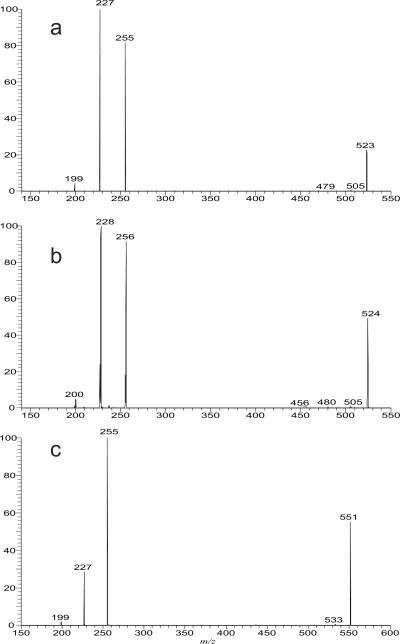
The mycolic acids (Panel A) with saturated chains both in meromycolate and α-alkyl residues were seen at m/z 467, 481, 495, 509, 523, 537, 551, 565, 579, 593, 607, 621, 635, 649, 663, 677, 691, 705 and 719. Several isomers were observed in each of the masses, as determined by their tandem mass spectra (Table 1). For example, the LIT MS2 spectrum of the ion at m/z 523 (Figure 2a) is dominated by the ions at m/z 227 and 255, arising from cleavage of the C2–C3 bond with participation of the 3-hydroxyl group to eliminate an eicosanal (C19H39CHO) or octadecanal (C17H35CHO) (Scheme 1), and representing a 14:0- and a 16-carboxylate anions, respectively,. The proposed fragmentation process is supported by observation of the mass shifts of the analogous ions at m/z 228 (from 227), 256 (from 255) and 200 (from 199) in the MS2 on the analogous ion of m/z 524 arising from H-D exchange (Figure 2b). The results indicate that the ion contains C34:0 and represents both a 2-dodecyl-3-hydroxy-docosanoic acid (20:0/14:0-mycolic acid; R1 = C19H39, R2 = C12H25) and a 2-tetradecyl-3-hydroxy-eicosanoic acid (18:0/16:0-mycolic acid; R1 = C17H35, R2 = C14H29). The spectrum also contains the ion at m/z 199, suggesting that the ion also represents a 2-decyl-3-hydroxy-tetracosanoic acid (22:0/12:0; R1=C21H43, R2=C10H21). Similar results were also observed for the ion at m/z 551, of which the MS2 spectrum is dominated by the ion at m/z 255 along with the ions at m/z 227 and 199 (Figure 2c), indicating that the ion consists of a major 20:0/16:0-mycolic acid along with 22:0/14:0- and 24:0/12:0-mycolic acids.
Table 1.
Mycolic acid compositions from R. Equi strain 103
| [M - H]− (m/z) | No. of C:No of unsaturation | mycolic acids (meromycolate chain / α-branch) | Relative intensity (%) | |
|---|---|---|---|---|
| *major structure | other isomers | |||
| 467 | 30:0 | 18:0/12:0; 16:0/14:0 | 16:0/14:0; 20:0/10:0 | 20 |
| 481 | 31:0 | 17:0/14:0 | 18:0/13:0; 19:0/12:0; 20:0/11:0 | 5 |
| 493 | 32:1 | 20:1/12:0; 18:1/14:0; 18:0/14:1 | 20:0/12:1; 16:0/16:1; 16:1/16:0 | 10 |
| 495 | 32:0 | 18:0/14:0 | 20:0/12:0; 16:0/16:0 | 71 |
| 509 | 33:0 | 19:0/14:0; 18:0/15:0 | 17:0/16:0; 20:0/13:0; 21:0/12:0; | 9 |
| 521 | 34:1 | 20:1/14:0 | 18:0/16:1; 18:1/16:0; 20:0/14:1; 22:1/12:0 | 25 |
| 523 | 34:0 | 20:0/14:0; 18:0/16:0 | 22:0/12:0 | 100 |
| 535 | 35:1 | 21:1/14:0; 20:1/15:0; 19:1/16:0 | 19:0/16:1; 18:0/17:1; 20:0/15:1; 23:1/12:1; 22:1/13:0 | 4 |
| 537 | 35:0 | 19:0/16:0; 20:0/15:0 | 21:0/14:0;18:0/17:0; 22:0/13:0; 23:0/12:0 | 10 |
| 547 | 36:2 | 20:1/16:1 | 22:1/14:1; 20:2/16:0; 19:2/17:0; 18:2/18:0; 22:2/14:0; 24:1/12:1; 21:2/15:0; 24:2/12:0 | 5 |
| 549 | 36:1 | 20:1/16:0; 22:1/14:0 | 20:0/16:1; 24:1/12:0 | 30 |
| 551 | 36:0 | 20:0/16:0 | 22:0/14:0; 24:0/12:0; 18:/18:0 | 70 |
| 563 | 37:1 | 21:1/16:0; 23:1/14:0 | 22:1/15:0; 20:0/17:1; 20:1/17:0; 21:0/16:1; 19:0/18:1; 19:1/18:0; 25:1/12:0; 22:0/15:1; 26:1/11:0, 27:1/10:0 | 4 |
| 565 | 37:0 | 21:0/16:0 | 20:0/17:0; 23:0/14:0; 24:0/13:0; 25:0/12:0; 19:0/18:0; 18:0/19:0 | 6 |
| 575 | 38:2 | 22:1/16:1 | 24:1/14:1; 26:2/12:0; 19:1/19:0; 20:1/18:0; 24:2/14:0; 26:1/12:1; 22:2/16:0; 20:1/18:1 | 5 |
| 577 | 38:1 | 22:1/16:0; 24:1/14:0 | 26:1/12:0; 22:0/16:1; 20:0/18:1; 24:0/14:1 | 33 |
| 579 | 38:0 | 22:0/16:0 | 24:0/14:0; 20:0/18:0; 26:0/12:0 | 30 |
| 591 | 39:1 | 23:1/16:0; 25:1/14:0 | 24:1/15:0; 22:1/17:0; 26:1/13:0; 27:1/12:0; 23:0/16:1; 22:0/17:1; 21:0/18:1 | 3 |
| 593 | 39:0 | 23:0/16:0; 25:0/14:0 | 22:0/17:0; 24:0/15:0; 27:0/12:0; 26:0/13:0 | 5 |
| 603 | 40:2 | 24:1/16:1; 26:1/14:1; 26:2/14:0 | 28:2/12:0; 21:2/19:0; 22:2/18:0; 24:2/16:0; 22:1/18:1; 28:1/12:1 | 7 |
| 605 | 40:1 | 26:1/14:0; 28:1/12:0 | 30:1/10:0; 26:0/14:1 | 32 |
| 607 | 40:0 | 24:0/16:0; 26:0/14:0 | 28:0/12:0 | 18 |
| 619 | 41:1 | 27:1/14:0; 25:1/16:0 | 26:1/15:0; 29:1/12:0; 28:1/13:0; 24:1/17:0; 30:1/11:0 | 6 |
| 631 | 42:2 | 28:2/14:0; 26:1/16:1; 26:2/16:0 | 28:2/14:0; 28:1/14:1; 24:1/18:1; 30:1/12:1 | 5 |
| 633 | 42:1 | 26:1/16:0 | 28:1/14:0; 30:1/12:0; 26:0/16:1; 24:1/18:0 | 35 |
| 635 | 42:0 | 26:0/16:0 | 28:1/14:0 | 15 |
| 645 | 43:2 | 29:2/14:0 | 27:2/16:0; 28:2/15:0; 27:1/16:1; 30:2/13:0; 31:2/12:0; 26:1/17:1;29:1/14:1; 28:1/15:1; 26:2/17:0 | 3 |
| 647 | 43:1 | 29:1/14:0; 27:1/16:0 | 28:1/15:0; 26:1/17:0; 30:1/13:0; 31:1/12:0 | 6 |
| 659 | 44:2 | 30:2/14:0; 28:2/16:0 | 28:1/16:1; 30:2/14:0; 32:1/12:1; 26:1/18:1 | 9 |
| 661 | 44:1 | 28:1/16:0 | 30:1/14:0; 26:1/18:0 | 24 |
| 673 | 45:2 | 31:2/14:0; 29:2/16:0 | 30:2/15:0; 26:2/19:0; 29:1/16:1; 32:2/13:0; 33:2/12:0; 28:2/17:0; 28:1/17:1; 27:2/18:0 | 3 |
| 675 | 45:1 | 29:1/16:0; 31:1/14:0 | 30:1/15:0; 28:1/17:0; 27:1/18:0 | 6 |
| 677 | 45:0 | 30:0/15:0 | 29:0/16:0; 31:0/14:0; 28:0/17:0 | 3 |
| 687 | 46:2 | 30:2/16:0; 32:2/14:0 | 30:1/16:1; 28:1/18:1 | 6 |
| 689 | 46:1 | 30:1/16:0 | 32:1/14:0 | 14 |
| 701 | 47:2 | 31:2/16:0 | 33:2/14:0; 32:2/15:0; 30:2/17:0; 31:1/16:1; 32:1/17:1 | 3 |
| 703 | 47:1 | 31:1/16:0 | 33:1/14:0; 30:1/17:0; 32:1/15:0; 29:1/18:0 | 5 |
| 715 | 48:2 | 32:2/16:0 | 34:2/14:0; 32:1/16:1; 30:1/18:1; 30:2/18:0 | 5 |
| 717 | 48:1 | 32:1/16:0 | 30:1/18:0; 34:1/14:0; 29:0/19:1 | 5 |
| 743 | 50:2 | 34:2/16:0 | 32:2/18:0; 32:1/18:1; 36:2/14:0 | 2 |
based on tandem mass spectra in which the relative abundance of the carboxylate anions that represent α-branch are > 50%
Figure 2.
The LIT MS2 spectra of the [M – H]− ion at m/z 523 (a), of the analogous [M – D]− ion at m/z 524 (b) (obtained by H-D exchange), and of the [M – H]− ion at m/z 551 (c). The +1 mass shift observed for the carboxylate anions in Panel b is consistent with the fragmentation pathways proposed in Scheme 1.
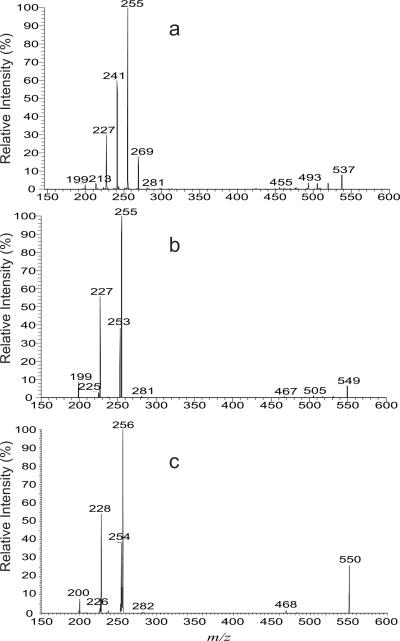
The minor ions of m/z 481, 509, 537 565, 593, 621, 649, 677 and 705 (Figure 1a) are the saturated mycolic acids with odd total hydrocarbon chains of which either the α-alkyl or the meromycolate contains an odd carbon chain, as revealed by their tandem mass spectra. For example, the LIT MS2 spectrum of the ion at m/z 537 (Figure 3a) contains the major ions at m/z 255 and 241 representing the 16:0- and 15:0-carboxylate anions, respectively, along with ions at m/z 269, 227, 213 and 199, representing 17:0-, 14:0-, 13:0-, and 12:0-carboxylate anions, respectively. The results indicate that the ion represents a C35:0-mycolic acid, which consists of a major 2-tetradecyl-3-hydroxy-heneicosanoic acid (19:0/16:0) isomer having C21 odd meromycolate chain, together with 2-tridecyl-3-hydroxy-docosanoic acid (20:0/15:0) isomer in which the odd chain is located on α-alkyl branch (C13). The ion also represents minor isomers of 18:0/17:0-, 21:0/14:0-, 22:0/13:0-, and 23:0/12:0-mycolic acids that possess an odd hydrocarbon chain at either the α-alkyl (i.e., 18:0/17:0 and 22:0/13:0) or the meromycolate chain (i.e., 21:0/14:0 and 23:0/12:0).
Figure 3.
The LIT MS2 spectra of the [M – H]− ions at m/z 537 (a), m/z 549 (b) and at m/z 550 (c), an [M – D]− ion analogous to m/z 549 after H-D exchange.
The mycolic acid anions bearing one double bond were seen at m/z 493, 521, 535, 549, 563, 577, 591, 605, 619, 633, 647, 661, 675, 689, 703 and 717 (Figure 1a). Again, several isomeric structures are present in each of the above masses. For example, the LIT MS2 spectrum of the ion at m/z 549 (Figure 3b) contained ions at m/z 255, 227, and 199, representing 16:0-, 14:0-, and 12:0-fatty acid carboxylate anions, and reflecting the presence of 14:0-, 12:0-, and 10:0-α-alkyl groups, respectively. The results indicate that the ion of m/z 549 contains C36:1 and represents a major 2-tetradecyl-3-hydroxy-docosenoic acid (20:1/16:0) of which the double bond is located at the meromycolate chain, along with isomers of 2-dodecyl-3-hydroxy-tetracosenoic acid (22:1/14:0) and 2-decyl-3-hydroxy-hexacosenoic acid (24:1/12:0) whose double bond is located on the meromycolate chain. The observation of the ion at m/z 253, representing a 16:1-carboxylate anion, indicates that the α-branch is an alkenyl group, leading to assignment of 2-tetradecenyl-3-hydroxy-docosanoic acid (20:0/16:1), which has an unsaturated α-branch. The results are further supported by the corresponding [M – D]− ion at m/z 550 obtained by H-D exchange. The spectrum (Figure 3c) contains the analogous carboxylate anions at m/z 256, 228, 200 and 254 which are 1 Da heavier than the ions at m/z 255, 227, 199 and 253 (Figure 3b) arising from the similar fragmentation mechanism as shown earlier (Scheme 1). Similarly, the LIT MS2 spectrum of the ion of m/z 577 (not shown) is dominated by the ion at m/z 227, along with ions at m/z 255 and 199, readily applicable for assignment of 24:1/14:0-, 22:1/16:0-, and 26:1/12:0-mycolic acid structures. The spectrum also contains ions at m/z 281, and 253, indicating the presence of 2-hexadecenyl-3-hydroxy-docosanoic acid (20:0/18:1), and 2-tetradecenyl-3-hydroxy-tetracosanoic acid (22:0/16:1).
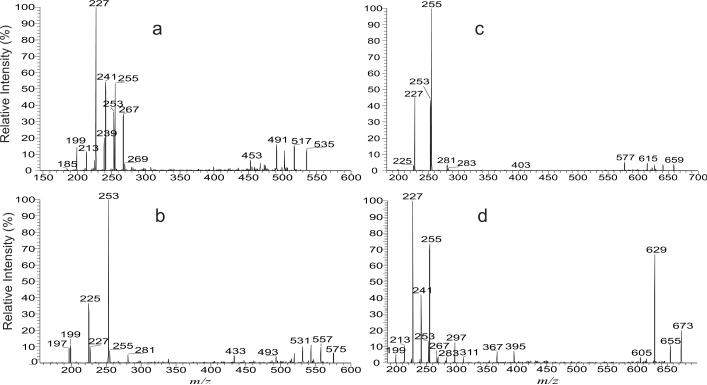
The minor ions at m/z 535, 563, 591, 619, 647, 675, and 703 belong to the odd number carbon chain ion series having one unsaturated bond situated either on the α-alkyl group or on the meromycolate chain. For example, the LIT MS2 spectrum of the ion of m/z 535 (Figure 4a) contained the major ion at m/z 227, representing a 14:0-carboxylate anion, along with ions at m/z 267, 255, 253, 241, 239, 225, 213, and 199, representing 17:1-, 16:0-, 16:1-, 15:0-, 15:1-, 14:1-, 13:0-, and 12:0-carboxylate anions, respectively. These results indicate that the ion of m/z 535 is a C35:1-mycolic acid and represents a major 21:1/14:0-mycolic acid together with the minor 18:0/17:1-, 19:1/16:0-, 19:0/16:1-, 20:1/15:0-, 20:0/15:1-, 21:0/14:1, 22:1/13:0-, and 23:1/12:0-mycolic acid isomers. The 18:0/17:1-, 20:1/15:0, 20:0/15:1-, and 22:1/13:0-mycolic acids all contain odd carbon chain α-alkyl branches, while the isomers including the major species of 20:1/12:0-mycolic acid all contain even carbon chain α-alkyl branches. These structural assignments, again, are further confirmed by the tandem mass spectrum of the analogous [M – D]− ion at m/z 536 after H-D exchange (data not shown).
Figure 4.
The LIT MS2 spectra of the [M – H]− ions at m/z 535 (a), m/z 575 (b), m/z 659 (c) and at m/z 673 (d).
In the same mixture, the ion series containing two double bonds were observed at m/z 575, 603, 631, 659, 673, 687, and 715, which are of low abundance. As shown in Figure 4b, the LIT MS2 spectrum of the ion at m/z 575 contains the major ions at m/z 253 (16:1), 225 (14:1) along with ions at m/z 281 (18:1), 255 (16:0), 227 (14:0), 199 (12:0) and 197 (12:1), suggesting the presence of the major isomers of 22:1/16:1-, 24:1/14:1- together with 20:1/18:1-, 22:2/16:0-, 24:2/14:0-, 26:2/12:0- and 26:1/12:1-mycolic acids, of which the molecules all contain C38:2. By contrast, the MS2 spectrum of m/z 659 (Figure 4c) is dominated by the ion at m/z 255 (16:0), corresponding to a 2-tetradecyl-3-hydoxy-triacontandienoic acid (28:2/16:0), suggesting the presence of the structure having a saturated α-branch with two unsaturated bonds along the meromycolate chain.,. The ions at m/z 253 and 227 arising from 2-tetradecenyl-3-hydoxytriacontenoic acid (28:1/16:1) and 2-dodecyl-3-hydoxy-dotriacontandienoic acid (30:2/14:0), respectively, were also seen in the spectrum, as well as the minor ions at m/z 281 and 225 arising from 26:1/18:1- and 30:1/14:1-mycolic acids, respectively.
In addition to the above described structures, the minor ions containing two double bonds with an odd α-alkyl or meromycolate hydrocarbon chain were seen at m/z 617, 645, and 673 (Figure 1). The MS2 spectrum of the ion of m/z 673 (Figure 4d), for example, contains carboxylate anions at m/z 311, 297, 283, 267, 255, 241, 227, 213, and 199, indicating the presence of 20:0, 19:0, 18:0, 17:0, 16:0, 15:0, 14:0, 13:0, 12:0 α-branches. These ions are paired with 25:2, 26:2, 27:2, 28:2, 29:2, 30:2, 31:2, 32:2, 33:2 meromycolate chains, respectively, arising from 25:2/20:0-, 26:2/19:0-, 27:2/18:0-, 28:2/17:0-, 29:2/16:0-, 30:2/15:0-, 31:2/14:0-, 32:2/13:0 and 33:2/12:0-mycolic acids. The spectrum also contains the carboxylate anions at m/z 267 (17:1) and 253 (16:1), suggesting the presence of the structures of 28:1/17:1-, and 29:1/16:1-mycolic acids, consistent with the notion that all these molecules consist of 45 carbons with two double bonds (C45:2).
Identification of mycolic acid with specific structure by tandem quadrupole mass spectrometry
The product-ion spectra of the [M – H]− ions of mycolic acid obtained with a tandem quadrupole instrument are similar to those obtained with a LIT. The spectra (data not shown) are dominated by the carboxylate anions arising from elimination of the meroaldehyde residue via cleavage of the C2–C3 bond as described earlier. These unique features provide a simple means for profiling specific mycolic acid subclasses in mixtures by tandem quadrupole mass spectrometry. For example, precursor-ion scan spectra of m/z 227 (Figure 5a) and of m/z 255 (Figure 5b) reveal the [M – H]− ions of the mycolic acids consisting of 14:0 and 16:0 α-branches, respectively. The profiles of the two spectra (Figure 5a and 5b) are similar to that seen in Figure 1, consistent with the notion that the mycolic acids from R. equi mainly contain 14:0 and 16:0 α-branches. The tandem mass spectra arising from precursor-ion scans of m/z 225 (not shown) and of m/z 253 (Figure 5c) contained ions that are 2 Da lighter than the corresponding saturated mycolic acid ions and these ions are of low abundance as seen in Figure 1. The results support the fact that the mycolic acid subclasses consisting of unsaturated 14:1 or 16:1 α-branches are the minor isomers in the mixture (Table 1). The precursor-ion scan spectrum of m/z 199 (Figure 5d) revealing mycolic acids that possess shorter 12:0 α-branch contains the similar ions as those seen Figure 5a and 5b, indicating that nearly all the major mycolic acid species in the mixture also consist of isomers with 12:0 α-branch, in addition to the dominant isomers consisting of 14:0, and 16:0 α-branches.
Figure 5.
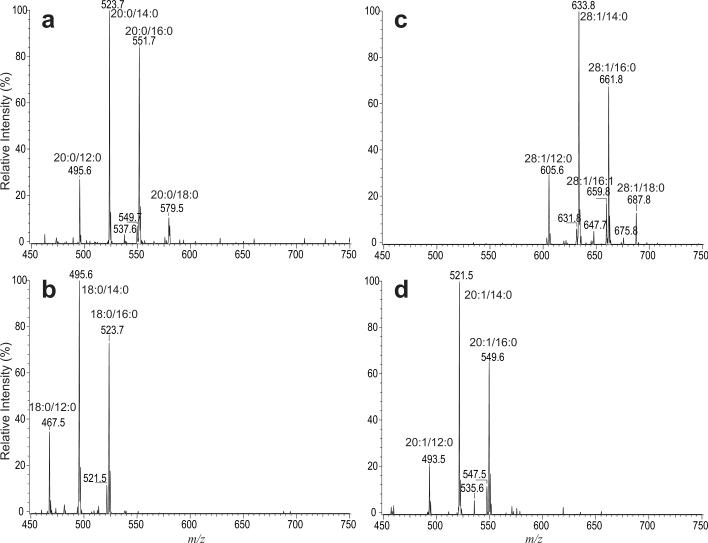
The tandem mass spectra obtained by precursor-ion scans of m/z 255 (a), m/z 227 (b), m/z 225 (c) and of m/z 199 (d) on the mycolic acid mixture from R. equi. The spectra identified the specific mycolic acid species with 16:0, 14:0, 14:1 or 12:0- α-branches, respectively, in the mixture.
The unique loss of the meroaldehyde residue upon CAD in a tandem mass spectrometer is also applicable for detection of specific mycolic acid subclasses in mixture by tandem quadrupole mass spectrometry employing constant neutral loss (CNL) scans. For example, CNL scan of 296 (loss of 20:0-meroaldehyde) (Figure 6a) gives rise to ions at m/z 551, 523, and 495, consistent with the notion that these ions all contain C20-meromycolate chain with 16:0, 14:0 and 12:0 α-branches, respectively. The spectrum also contained the minor ions at m/z 537, 549 and 579, in agreement with the fact that these ions also represent 20:0/15:0-, 20:0/16:1-, and 20:0/18:0-mycolic acids, respectively (Table 1). The tandem mass spectrum obtained by CNL of 268 that unveils mycolic acid subclass with C18-meromycolate chain (Figure 6b) contains ions at m/z 523, 521, 495, 481, and 467, reflecting the presence of 18:0/16:0-, 18:0/16:1-, 18:0/14:0-, 18:0/13:0-, and 18:0/12:0-mycolic acids. Both the ions at m/z 523 and 495 are present in Figure 6a and 6b, consistent with the notion that the ion at m/z 523 represents both a 20:0/14:0- and 18:0/16:0-mycolic acids, while the ion at m/z 495 represents both a 20:0/12:0 and 18:0/14:0-mycolic acid isomers.
Figure 6.
The tandem quadrupole mass spectra obtained with constant neutral loss scans of 296 Da (a), 268 Da (b), 406 Da (c), and of 294 Da (d). The spectra identify the specific mycolic acid species that possess 20:0-, 18:0-, 28:1-, and 20:1-meromycolate chains, respectively.
The mycolic acids possessing unsaturated 28:1-, or 20:1-meromycolate chain were recognized by CNL scans of 406 (Figure 6c) and of 294 (Figure 6d), respectively. The former spectrum contains major ions at m/z 661 and 633, representing 28:1/16:0-, and 28:1/14:0-mycolic acids, respectively, along with minor ions at m/z 687, 675, 659, 647, 631, and 605, arising from 28:1/18:1, 28:1/17:0, 28:1/16:1, 28:1/15:0, 28:1/14:1 and 28:1/12:0 mycolic acids, respectively. The latter spectrum contains major ions at m/z 549 and 521, arising from 20:1/16:0- and 20:1/14:0-mycolic acids, together with minor ions at m/z 547, 535, and 493, reflecting the fact that 20:1/16:1 (m/z 547), 20:1/15:0 (m/z 535), and 20:1/12:0 (m/z 493) mycolic acids are minor isomers (Table 1).
The application of the aforementioned linked scans for assignment of mycolic acid structures and for profiling mycolic acid in mixture is further shown for the mycolic acids extracted from Rhodococci rhodnii (R. rhodnii) as described below.
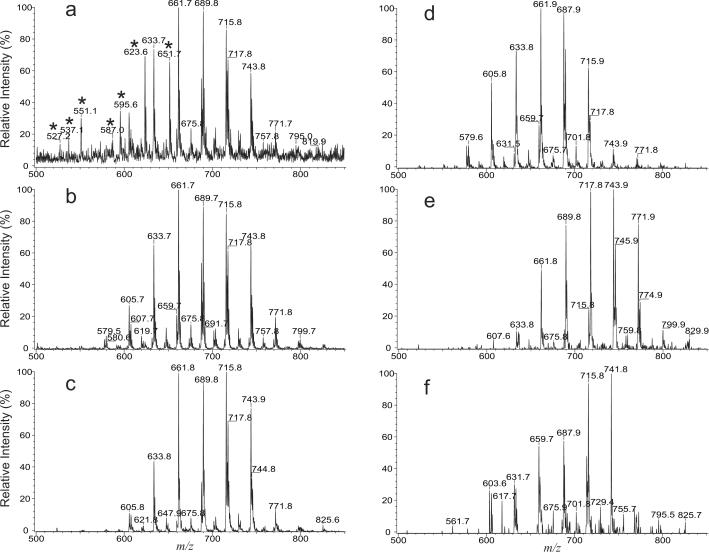
As shown in Figure 7, the full-scan MS spectrum of the crude lipid extract from R. rhodnii (Panel a) contained mycolic acid anions similar to those seen from the same mixture that has been purified with a Sep-Pak column (Panel b), but the mass spectrum (Figure 7a) also contains ions that are not mycolic acids (peaks labeled with “*”). However, precursor-ion scan of m/z 255 on the crude extract yielded a tandem mass spectrum (Panel c) similar to that arising from the same scan on the purified mycolic acid mixture (data not shown), and the profile of the spectrum is nearly identical to that seen in Figure 7b. The results are consistent with the report that the mycolic acids from R. rhodnii mainly contain 16:0 α-branch with 0–2 double bond on the various meromycolate chains [11]. However, tandem mass spectrum obtained by precursor-ion scans of m/z 227 (Figure 7d), and of m/z 283 (Figure 7e).revealed that the mycolic acid mixture also consists of abundant isomers having 14:0 and 18:0 α-branches, respectively.
Figure 7.
The negative-ion full-scan ESI-MS spectrum of the crude mycolic acid extract (a), of the Sep-Pak purified mycolic acids (b) from R. rhodnii. Also shown are the tandem mass spectra obtained by precursor-ion scans of m/z 255 (c), m/z 227 (d), m/z 283 (e) and of m/z 253 (f) on the same mixture. The mycolic acids from R. rhodnii contains 0–2 double bond in the α-branch and showed a great diversity in the chain length.
The presence of the mycolic acids with various α-branches in the extract is further evidenced by the product-ion spectra. For example, the MS2 spectrum of the ion at m/z 633 (Figure 8a) is dominated by the ion at m/z 255, along with ions at m/z 227, 297, 283, 253, and 199, indicating that the ion mainly represents 26:1/16:0-mycolic acid, together with minor isomers of 28:1/14:0-, 23:1/19:0-, 24:1/18:0-, 26:0/16:1-, and 30:1/12:0-mycolic acids. The MS2 product-ion spectrum of the ion at m/z 687 (Figure 8b) is dominated by the ions at m/z 255 and 227, along with ions at m/z 281, 283, and 253, indicating the presence of the major isomers of 30:2/16:0-, 32:2/14:0-mycolic acids, together with 28:1/18:1-, 28:2/18:0-, and 30:1/16:1-mycolic acid isomers. The assignment of the 26:0/16:1-mycolic acid for the ion of m/z 633 and of the 30:1/16:1-mycolic acid for the ion of m/z 687 is consistent with the observation of the ions at m/z 633 and 687 in the tandem mass spectrum arising from precursor ion scan of m/z 253 (Figure 7f), which revealed the isomers containing a 16:1 α-branch. By contrast, only the mycolic acids with 16:0 α-branch was reported in the previous studies on R. rhodnii using the traditional GC/MS approach [11].
Figure 8.
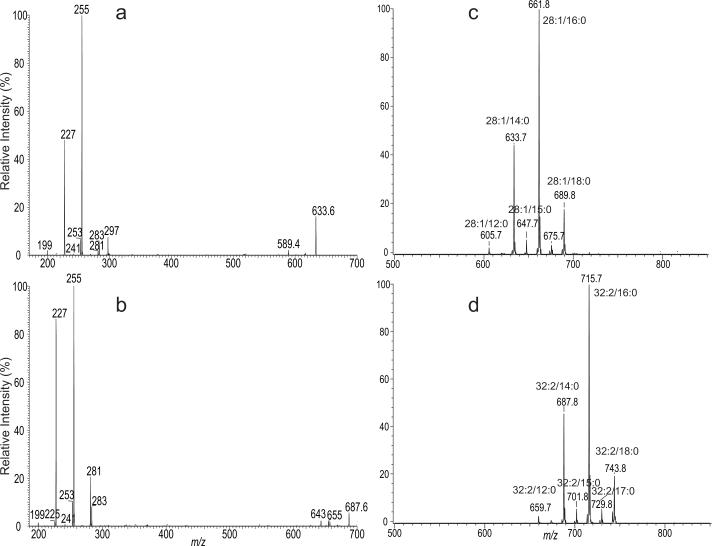
The MS2 spectra of the ions at m/z 633 (a), and at m/z 687 (b), and the tandem mass spectra obtained from CNL scans of 406 (c) and of 460 (d) on the mycolic acids isolated from R. rhodnii.
Tandem mass spectra obtained by CNL scans, for example, of 406 (Figure 8c), and of 460 (Figure 8d) exhibit mycolic acids having 28:1-, and 32:2-meromycolate chains, respectively. The former spectrum is dominated by the ion at m/z 661, arising from 28:1/16:0-mycolic acid, along with ions at m/z 605 (28:1/12:0), 633 (28:1/14:0), 647 (28:1/15:0), 675 (28:1/17:0), and 689 (28:1/18:0), whereas the latter spectrum is dominated by the ion at m/z 715, corresponding to 32:2/16:0-mycolic acid, along with ions at m/z 687 (32:2/14:0), 701 (32:2/15:0), 729 (32:2/17:0), and 743 (32:2/18:0). The observation of the 28:1/16:0- and 32:2/16:0-mycolic acids as the major isomers from the tandem mass spectra obtained by CNL scans is consistent with the notion that the main isomers representing the [M – H]− ions of mycolic acid in the mixture contain a 16:0 α-branch (Figure 7c). This dominance of 16:0 α-branch in the mycolic acids from R. rhodnii is further confirmed by the tandem mass spectra obtained by CNL scans of 448 (31:1-meromycolate), 434 (30:1-meromycolate), and of 432 (30:2-meromycolate) (data not shown), of which the ions representing the isomers having a 16:0 α-branch are the most prominent.
The tandem mass spectra from precursor ion scan of m/z 255 on the mycolic acid mixtures extracted from R. equi (Figure 5a) and from R. rhodnii (Figure 7c) are readily distinguishable; the spectra from the precursor-ion scan of m/z 227 on the mixtures from R. equi (Figure 5b) and from R. rhodnii (Figure 7d) are also distinguishable. The results indicate profiling mycolic acid using precursor-ion scans may provide a simple, specific means for classification of various species in the genus of Rhodococcus. By contrast, differentiation of Rhodococcus species previously established by HPLC analysis of mycolic acids required derivatization steps to convert to the ultraviolet (UV)-absorbing p-bromophenacyl esters, followed by extraction and laborious HPLC/UV analysis [19]. The standardized method for HPLC identification of mycobacteria not only requires a large amount of sample but also consumes a great deal of solvents (www.cdc.gov/ncidod/publications/hplc.pdf). Profiling mycobacterial mycolic acids for clinical study using the analogous precursor-ion scans as described in this study has been recently reported by Song et al [20].
Conclusions
The complexity of mycolic acids in the mixture was seen not only by the wide range of the homologous masses (m/z), but also by the various structures found in each of the masses that represent numerous isomers differed by the lengths of meromycolate chain and of the α-alkyl group, as well as by the unsaturated bond(s) located on the meromycolate branch or α-alkyl chain. More isomeric structures were seen for the minor ions (Table 1). For example, ions at m/z 547 and 575 each consists of 10 isomeric structures, while only three isomers were seen for the prominent ions at m/z 523 and m/z 495. The increased diversity in the isomeric structures among minor species in the mixture was also observed for trehalose monmycolate and trehalose dimycolate in the same lipid extract [Hsu & Haas, unpublished] and has been previously reported for phosphatidylinositol mannosides from Mycobacterium bovis Bacillus Calmette Guérin [21; 22]. This study also demonstrates that the mycolic acids from R. equi strain 103 belong to the short chain-length group [23]. The ESI tandem mass spectrometric approach for characterization of mycolic acids in mixture as reported here is simple, resulting in characterization of the structural diversity of mycolic acids without chromatographic separation and derivatization.
Supplementary Material
Figure S1. The ESI-MS profiles of the free mycolic acids (Panel a, c, e), and of the cell wall bound mycolic acids (Panel b, d, f) isolated from R. equi (a and b), R. rhodnii (c and d), and from R. terrae (e and f).
Acknowledgments
This research was supported by US Public Health Service Grants P41-RR-00954, R37-DK-34388, P60-DK-20579, P01-HL-57278, P30-DK56341 and Deutsche Forschungsgemeinschaft (SFB 670).
Footnotes
Publisher's Disclaimer: This is a PDF file of an unedited manuscript that has been accepted for publication. As a service to our customers we are providing this early version of the manuscript. The manuscript will undergo copyediting, typesetting, and review of the resulting proof before it is published in its final citable form. Please note that during the production process errors may be discovered which could affect the content, and all legal disclaimers that apply to the journal pertain.
References
- [1].Gigue`re S, Prescott JF. Clinical manifestations, diagnosis, treatment and prevention of Rhodococcus equi infections in foals. Vet. Microbiol. 1997;56:313–334. doi: 10.1016/s0378-1135(97)00099-0. [DOI] [PubMed] [Google Scholar]
- [2].Mosser DM, Hondalus MK. Rhodococcus equi: an emerging opportunistic pathogen. Trends Microbiol. 1996;4:29–33. doi: 10.1016/0966-842x(96)81502-2. [DOI] [PubMed] [Google Scholar]
- [3].Prescott JF. Rhodococcus equi: an animal and human pathogen. Clin Microbiol Rev. 1991;4:20–34. doi: 10.1128/cmr.4.1.20. [DOI] [PMC free article] [PubMed] [Google Scholar]
- [4].Kedlaya I, Ing Michael B., Wong Sammy S. Rhodococcus equi Infections in Immunocompetent Hosts: Case Report and Review. Clin Infect Dis. 2001;32:e39–e46. doi: 10.1086/318520. [DOI] [PubMed] [Google Scholar]
- [5].Weinstock DM, Brown AE. Rhodococcus equi: an emerging pathogen. Clin. Infect. Dis. 2002;34:1379–1385. doi: 10.1086/340259. [DOI] [PubMed] [Google Scholar]
- [6].Donisi A, Suardi MG, Casari S, Longo M, Cadeo GP, Carosi G. Rhodococcus equi infection in HIV-infected patients. AIDS. 1996;10:359–362. doi: 10.1097/00002030-199604000-00002. [DOI] [PubMed] [Google Scholar]
- [7].von Bargen K, Haas A. Molecular and infection biology of the horse pathogen Rhodococcus equi. FEMS Microbiol Rev. 2009;33:870–891. doi: 10.1111/j.1574-6976.2009.00181.x. [DOI] [PubMed] [Google Scholar]
- [8].Harvey RL, Sunstrum JC. Rhodococcus equi infection in patients with and without human immunodeficiency virus infection. Reviews of infectious diseases. 1991;13:139–145. doi: 10.1093/clinids/13.1.139. [DOI] [PubMed] [Google Scholar]
- [9].Munoz P, Burillo A, Palomo J, Rodriguez-Creixems M, Bouza E. Rhodococcus equi infection in transplant recipients: case report and review of the literature. Transplantation. 1998;65:449–453. doi: 10.1097/00007890-199802150-00031. [DOI] [PubMed] [Google Scholar]
- [10].Sutcliffe IC. Cell envelope composition and organisation in the genus Rhodococcus Antonie van Leeuwenhoek. 1998;74:49–58. doi: 10.1023/a:1001747726820. [DOI] [PubMed] [Google Scholar]
- [11].Nishiuchi Y, Baba T, Yano I. Mycolic acids from Rhodococcus, Gordonia, and Dietzia. J. Microbiol. Methods. 2000;40:1–9. doi: 10.1016/s0167-7012(99)00116-5. [DOI] [PubMed] [Google Scholar]
- [12].Brennan PJ, Nikaido H. The envelope of mycobacteria. Annu. Rev. Biochem. 1995;64:29–63. doi: 10.1146/annurev.bi.64.070195.000333. [DOI] [PubMed] [Google Scholar]
- [13].Tomiyasu I, Yoshinaga J, Kurano F, Kato Y, Kaneda K, Imaizun S, Yano I. Occurrence of a novel glycolipid, 'trehalose 2,3,6'-trimycolate' in a psychrophilic, acid-fast bacterium, Rhodococcus aurantiacus (Gordona aurantiaca) FEBS Letters. 1986;203:239–242. [Google Scholar]
- [14].Yano I, Kageyama K, Ohno Y, Masui M, Kusunose E, Kusunose M, Akimori N. Separation and analysis of molecular species of mycolic acids in Nocardia and related taxa by gas chromatography mass spectrometry. Biomed Mass Spectrom. 1978;5:14–24. doi: 10.1002/bms.1200050104. [DOI] [PubMed] [Google Scholar]
- [15].Alshamaony L, Goodfellow M, Minnikin DE. Free Mycolic Acids as Criteria in the Classification of Nocardia and the `rhodochrous' Complex. J Gen Microbiol. 1976;92:188–199. doi: 10.1099/00221287-92-1-188. [DOI] [PubMed] [Google Scholar]
- [16].Alshamaony L, Goodfellow M, Minnikin DE, Mordarska H. Free Mycolic Acids as Criteria in the Classification of Gordona and the `rhodochrous' Complex. J Gen Microbiol. 1976;92:183–187. doi: 10.1099/00221287-92-1-183. [DOI] [PubMed] [Google Scholar]
- [17].De la Pena-Moctezuma A, Prescott JF. Association with HeLa cells by Rhodococcus equi with and without the virulence plasmid. Vet. Microbiol. 1995;46:383–392. doi: 10.1016/0378-1135(95)00034-8. [DOI] [PubMed] [Google Scholar]
- [18].Nishiuchi Y, Baba T, Hotta HH, Yano I. Mycolic acid analysis in Nocardia species. The mycolic acid compositions of Nocardia asteroides, N. farcinica, and N. nova. J. Microbiol. Methods. 1999;37:111–22. doi: 10.1016/s0167-7012(99)00055-x. [DOI] [PubMed] [Google Scholar]
- [19].Butler WR, Kilburn JO, Kubica GP. High-Performance Liquid Chromatography Analysis of Mycolic Acids as an Aid in Laboratory Identification of Rhodococcus and Nocardia Species. J. Clin. Microbiol. 1987;25:2126–2131. doi: 10.1128/jcm.25.11.2126-2131.1987. [DOI] [PMC free article] [PubMed] [Google Scholar]
- [20].Song SH, Park KU, Lee JH, Kim EC, Kim JQ, Song J. Electrospray ionization-tandem mass spectrometry analysis of the mycolic acid profiles for the identification of common clinical isolates of mycobacterial species. J. Microbiol. Methods. 2009;77:165–177. doi: 10.1016/j.mimet.2009.01.023. [DOI] [PubMed] [Google Scholar]
- [21].Hsu FF, Turk J, Owens RM, Rhoades ER, Russell DG. Structural Characterization of Phosphatidyl-myo-inositol Mannosides from Mycobacterium bovis Bacillus Calmette Guerin by Multiple-Stage Quadrupole Ion-Trap Mass Spectrometry with Electrospray Ionization. I. PIMs and Lyso-PIMs. J Am Soc Mass Spectrom. 2007;18:466–78. doi: 10.1016/j.jasms.2006.10.012. [DOI] [PMC free article] [PubMed] [Google Scholar]
- [22].Hsu FF, Turk J, Owens RM, Rhoades ER, Russell DG. Structural Characterization of Phosphatidyl-myo-Inositol Mannosides from Mycobacterium bovis Bacillus Calmette Guerin by Multiple-Stage Quadrupole Ion-Trap Mass Spectrometry with Electrospray Ionization. II. Monoacyl- and Diacyl-PIMs. J Am Soc Mass Spectrom. 2007;18:479–92. doi: 10.1016/j.jasms.2006.10.020. [DOI] [PMC free article] [PubMed] [Google Scholar]
- [23].Sutcliffe IC. Macroamphiphilic cell envelope components of Rhodococcus equi and closely related bacteria. Vet Microbiol. 1997;56:287–299. doi: 10.1016/s0378-1135(97)00097-7. [DOI] [PubMed] [Google Scholar]
Associated Data
This section collects any data citations, data availability statements, or supplementary materials included in this article.
Supplementary Materials
Figure S1. The ESI-MS profiles of the free mycolic acids (Panel a, c, e), and of the cell wall bound mycolic acids (Panel b, d, f) isolated from R. equi (a and b), R. rhodnii (c and d), and from R. terrae (e and f).


