

Abstract
Recent studies suggest that the deregulation of pathways, rather than individual genes, may be critical in triggering carcinogenesis. The pathway deregulation is often caused by the simultaneous deregulation of more than one gene in the pathway. This suggests that robust gene pair combinations may exploit the underlying bio-molecular reactions that are relevant to the pathway deregulation and thus they could provide better biomarkers for cancer, as compared to individual genes. In order to validate this hypothesis, in this paper, we used gene pair combinations, called doublets, as input to the cancer classification algorithms, instead of the original expression values, and we showed that the classification accuracy was consistently improved across different datasets and classification algorithms. We validated the proposed approach using nine cancer datasets and five classification algorithms including Prediction Analysis for Microarrays (PAM), C4.5 Decision Trees (DT), Naive Bayesian (NB), Support Vector Machine (SVM), and k-Nearest Neighbor (k-NN).
Introduction
The use of DNA microarrays has resulted in the identification and monitoring of numerous cancer marker genes. These genes have been widely used to differentiate not only cancerous tissue samples from normal healthy ones, but also between different sub-types of cancer [1]–[3]. From a diagnostic point of view, it is important to correctly identify cancerous tissue so that the most appropriate treatment can be given as early as possible.
Numerous classifiers have been proposed and evaluated for their comparative accuracy in correctly identifying cancer tumors [4]–[7]. The most prominent of these classifiers are PAM [8], SVM [9], [10], k-NN [11], DT [12], Top Scoring Pair (TSP) [13], and k-Top Scoring Pair (k-TSP) [6]. The results from these studies indicate that there is no single classifier that has the highest accuracy for all the microarray expression datasets. In this paper, we introduce a novel method that uses gene pairs to improve the overall accuracy of the existing classification methods without altering the underlying algorithms.
Recent research has revealed that biomolecular pathways may be stronger biomarkers for cancer, as compared to the deregulation of individual genes [14]. The deregulation of a different subset of genes, associated with the same pathway, may result in the deregulation of the pathway. Inspecting gene combinations may thus be more effective for cancer classification as compared to independently inspecting individual genes. Motivated by that, the proposed method uses the information derived from the gene pair combinations, instead of the original expression values of the genes. We use the derived information as the input to the existing classification methods. We show that these gene pair combinations, called doublets, consistently improve the classification accuracy of the existing classification algorithms.
The significance of the proposed method is that without changing the underlying classification algorithms we can significantly improve the performance of the algorithms by simply constructing doublets and by using them as input, instead of the raw gene expression values. The doublets can be constructed in various ways. In this paper, we experimented with three different types of doublets: sumdiff, mul and sign doublets. The sumdiff doublets are constructed by taking the sum and difference of all pairs of the gene expression vectors such that a doublet is represented as a vector sum or difference of two gene vectors. The mul doublets are similarly constructed by taking multiplication, and the sign doublets are constructed by taking the signs of the differences of the two gene vectors. Refer to the “Materials and Methods” section for more details.
Results
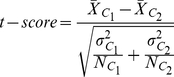
LOOCV (Leave One Out Cross Validation) was conducted to measure the accuracy of doublet-based classification. To test a sample, all the samples, but the tested one, are used to compute the  of genes, and the genes are arranged in accordance with the descending absolute values of the scores. The formula used to calculate this score is
 |
(1) |
where  represent the class means;
  represent the variances; and
  represent the number of samples for the two classes
  and
and  , respectively.
We then select the top 0.2%, 0.4%, 0.6%, 0.8%, 1%, 2%, 4%, 10% of the total number of genes in the dataset for making doublets. We further prune the doublets so that no gene appears more than once in the final set of doublets. The algorithm we use to formulate these unique doublets from the original microarray expression dataset is outlined as below.
Input: Gene Expression Matrix  with
with  genes and
  samples, class vector
  for the
  samples and
  for the number of the genes required for analysis.
Output: Unique doublets
1. Compute t-scores for matrix
 using class vector
  .
.2. Make an ordered list
 of all the genes
  , in decreasing value of their absolute t-score.
3. Take the top
 genes from the ordered list
  , and extract their expression values from
  . The new expression matrix
  has
has  rows and
  columns.
4. Make doublets from
 to get a new matrix
  , with
  rows and
  columns.
5. Compute t-scores for matrix
 using class vector
  .
.6. Make an ordered list
 of all the doublets
  in
in  , in decreasing value of their absolute t-score.
7. Initialize
 as an empty list.
8. forall doublets
 in
in
 do (in decreasing absolute t-score order); If neither of the genes in the doublet
  is in
is in  , then add doublet
  to
to 
9. Return

The accuracy of the original algorithms is measured using all the raw expression values of the genes as input. We shall refer to the accuracy of the original algorithm, for example for PAM, as PAM, and the accuracy obtained using sumdiff/mul/sign doublets as input to PAM as sumdiff/mul/sign-PAM, respectively. Figure 1 compares the accuracy of the standard PAM classifier to that of sumdiff/mul/sign-PAM, obtained by taking the top  % genes, for the nine datasets listed in Table 1. It can be seen that even taking a small percentage of the top genes and making doublets could improve the performance of PAM. The sumdiff/mul/sign-PAM classifier outperforms the standard PAM classifier in many datasets.
Figure 1. The accuracy of sumdiff/mul/sign-PAM for the top
 % genes compared with the PAM accuracy for each of the nine datasets.

Table 1. The microarray datasets used for classification.
| Dataset | Platform | Total | Total | Reference |
| Genes (N) | Samples (M) | |||
| Colon | cDNA | 2000 | 62 | Alon [23] |
| Leukemia | Affy | 7129 | 72 | Golub [24] |
| CNS | Affy | 7129 | 34 | Pomeroy [25] |
| DLBCL | Affy | 7129 | 77 | Shipp [26] |
| Lung | Affy | 12533 | 181 | Gordon [27] |
| Prostate1 | Affy | 12600 | 102 | Singh [28] |
| Prostate2 | Affy | 12625 | 88 | Stuart [29] |
| Prostate3 | Affy | 12626 | 33 | Welsh [30] |
| GCM | Affy | 16063 | 280 | Ramaswamy [31] |
For the two datasets, CNS and DLBCL, this gain is substantial. For example, with sign-PAM using the top 2% genes, the accuracy has increased from 82.4% to 91.2% for the CNS dataset; and for the DLBCL dataset, the accuracy has increased from 85.5% to 97.4%. The average accuracy of the PAM classifier for the nine datasets has increased from 88.7% to 90.6%, 89.3% and 91.7% with sumdiff, mul and sign-PAM with top 2% genes, respectively.
We can make two observations from this result. Only a small number of the top genes are required to achieve improvements and that the improvements are quite consistent across the datasets. In order to show whether or not these observations are still valid for other classification methods, we performed the same experiments using different classification methods including the DT, NB, SVM and k-NN classifiers.
Figure 2 shows the comparison results with DT. The accuracy of DT was consistently improved across the nine datasets. In some cases, the improvements were significant. For example, sumdiff-DT improved the accuracy of DT from 64.8% to 77.3% in the Pros.2 dataset using the top 4% genes; from 73.6% to 93.1% in the Leukemia dataset with only the top 0.2% genes; and from 80.5% to 98.7% in the DLBCL dataset with only the top 0.2% genes. Similarly, mul-DT improved the accuracy of DT from 64.8% to 84.1% in the Pros.2 dataset using the top 0.4% genes; from 84.9% to 100% in the Pros.3 dataset with the top 0.4% genes; and from 80.5% to 97.4% in the DLBCL dataset with the top 1% genes. Finally, sign-DT improved the accuracy of DT from 84.9% to 97.0% in the Pros.3 dataset using the top 0.2% genes; from 73.6% to 95.8% in the Leukemia dataset with the top 0.6% genes; and from 77.4% to 93.6% in the Colon dataset with the top 0.6% genes. On average, over the nine datasets, the accuracy of DT was improved from 78.9% to 85.2%, 84.2% and 89.1% using sumdiff, mul and sign doublets with the top 0.8% genes, respectively.
Figure 2. The accuracy of sumdiff/mul/sign-DT for the top  % genes compared with the DT accuracy for each of the nine datasets.

Similarly for NB, the accuracy was significantly improved with sumdiff and mul doublets. The result is shown in Figure 3. One interesting observation we made is that for NB the sign doublets have consistently performed worse than the others independent of the number of the top genes used for doublet generation. This is because the sign doublets transform the expression values into binary variables indicating the order of expression level between the genes in the gene pairs and the transformed binary values do not retain enough information to compute the class probability used for classification. Thus, the sign doublets are not suitable for the NB classifiers. Nonetheless, the performance gains with sumdiff and mul doublets were substantial. In the Pros.1 dataset, both sumdiff/mul-NB improved the accuracy from 62.8% to 91.2% with the top 0.2% genes; in the Colon dataset, the accuracy was improved from 56.5% to 87.1% and 88.7% with the top 1% genes, respectively. Finally, in the DLBCL dataset, the accuracy was improved from 80.5% to 96.1% and 92.2% with the top 0.2% genes, respectively. On average, the accuracy was improved from 81% to 90.7% and 89.5% with sumdiff and mul doublets with the top 0.2% genes, respectively.
Figure 3. The accuracy of sumdiff/mul/sign-NB for the top  % genes compared with the NB accuracy for each of the nine datasets.

SVM is known to be one of the most robust classifiers in many domains. Although its performance was compelling by itself, we observed that in some cases our doublet approach improved its performance significantly. The result is shown in Figure 4. In the Colon dataset, the performance gain was most striking. The accuracy was improved from 82.3% to 87.1%, 87.1% and 93.6% with sumdiff/mul/sign doublets with the top 1% genes, respectively. In the Pros.2 dataset, the accuracy was improved from 76.1% to 80.7%, 84.1% and 85.2% with the top 8%, 0.2% and 1% genes, respectively. On average, the accuracy was improved from 91.2% to 92%, 91.9%, and 89.4% with sumdiff/mul/sign doublets with the top 4% genes, respectively.
Figure 4. The accuracy of sumdiff/mul/sign-SVM for the top  % genes compared with the SVM accuracy for each of the nine datasets.

Lastly, for k-NN, the same was observed, as is shown in Figure 5. For k-NN, the performance gain was substantial in almost all datasets. For example, in the Leukemia dataset, the accuracy was improved from 84.7% to 98.6%, 98.6%, and 100% with sumdiff/mul/sign doublets with the top 2%, 0.8% and 0.2% genes, respectively. On average, the accuracy was improved from 84.3% to 91%, 90.1% and 90.7% with sumdiff/mul/sign doublets with the top 4% genes, respectively.
Figure 5. The accuracy of sumdiff/mul/sign-k-NN for the top  % genes compared with the k-NN accuracy for each of the nine datasets.

Other than the sign doublets in the NB classifier, use of three doublets led to improved performance of the baseline classifiers. The baseline classifiers' average accuracy rates over the nine datasets ranged from 79% to 91% (i.e., DT = 79%, kNN = 84%, NB = 81%, SVM = 91%, and PAM = 89%). On the other hand, their average rates with doublets hovered at a higher range, or from 89% to 92% (i.e., sign-DT = 89%, sumdiff-kNN = 91%, sumdiff-NB = 89%, sumdiff-SVM = 92%, and mul-PAM = 90%; all the figures with top 4% genes). The baseline classifiers showed a substantial performance difference among them. When it comes to doublets, however, the difference was minimized and the performance was improved. All of the three doublet types almost equally contributed to performance enhancement across various datasets (except the sign doublets in the NB). The sumdiff/mul/sign doublets with the top 4% genes marked average accuracies over the five classifiers of 88.7% (std. 3.4), 88.5% (std. 3.8), and 85.4% (std. 9.9), respectively. The sumdiff doublets demonstrated a slightly better performance than the others did. This result is possibly attributable to the following fact: The sumdiff doublets capture both of the upwards and downwards relations (i.e., up-up, down-down, and up-down) and of the order relations of the expression values of each gene pair. On the contrary, the mul doublets capture the former alone, and the sign doublets capture the latter alone. (See the Materials section for more details.)
Discussion
A recent study suggested that the pathway level deregulation is more important to carcinogenesis than the deregulation of individual genes [14]. A pathway is typically deregulated by the deregulation of more than one gene that is associated with that pathway. This supports our motivation to use doublets as features for classification, as the doublets could capture potentially more information about the pathway level deregulation than the individual genes. In this study, however, the doublets were pooled from diverse pathways; namely, not limited to those of the gene pairs belonging to the same pathways. By allowing all possible gene combinations, we attempted to capture not only the direct intra-pathway interactions, but also some of the potential indirect inter-pathway associations. We plan to pursue in our future work, the cases where only the intra-pathway doublets are used.
A number of independent studies have attested to the effectiveness of combining gene pairs. Zhou and her colleagues have introduced a technique called second-order correlation analysis in which the pair-wise correlations of genes are utilized for the functional classification of genes [15]. Their approach operates, as follows: First computed are all pair-wise correlations of genes within each dataset (1st-order correlations); then, the correlation patterns are analyzed across multiple datasets (2nd-order correlations). Selection is made of the gene pairs that show high correlations in multiple datasets, and the selected form doublets. A doublet is represented as a vector such that its dimension and value, respectively, correspond to a dataset and to the correlation value of the gene pair in the corresponding dataset. The doublets are then clustered using the correlation as similarity metric. The doublets clustered together are considered to share similar functions, because they are turned-on and off collectively across datasets.
We also have developed microarray data integration techniques that exploit inter-gene relations, such as correlation signature [16] and signature cube [17]. The correlation signature projects heterogeneous microarray expression data onto a coherent information space where a gene is represented by the vector of its correlations against a series of landmark genes. If the same set of landmarks is used, heterogeneous microarray datasets, which could not have been directly combined, can be integrated, because the correlation signatures of the genes have compatible dimensions. The signature cube generalizes the principles of the correlation signature by providing a heterogeneous microarray data mining framework where data are represented in relative terms (i.e., inter-gene relations). Thus, mining algorithm is coherently applicable all across datasets. Besides the microarray data integration, we also have applied the principle to the clustering problem and have introduced a novel clustering framework, SignatureClust [18]. SignatureClust clusters microarray data after projecting it into a signature space defined by a set of landmark genes chosen by the user, allowing biologists to get different perspectives of the same underlying data simply by changing the landmark genes.
It also has been proved that the inter-gene information is useful for cancer classification purposes. The k-TSP exploits changes in the expression levels of gene pairs in order to improve the classification accuracy [6]. The k-TSP classifier uses gene pairs that are similar to our sign doublets. The k-TSP classifier identifies the gene pairs whose expression orders are consistently reversed across the classes; i.e., if  in most of the control samples and
  in most of the cancer samples, then the k-TSP classifier regards the gene pair
  and
and  as a good indicator of the classes. The k-TSP classifier finds the top-
 pairs, referred to as TSP (Top Scoring Pairs), and it uses them to determine the classes. The k-TSP classifier combines the prediction of each TSP using the unweighted majority voting to determine the final class of a sample. Recently, the k-TSP algorithm has also been used to improve the classification accuracy of the SVM classifier [19].
Our method is different from the k-TSP classifier in three important aspects. First,  -TSP is designed to work with only one type of gene pairing (similar to our sign doublets), whereas our method is not limited to specific types of pairing. In this paper, we have defined three doublets, i.e., sumdiff, mul and sign, but various other doublets can also be used with the proposed framework. Second, our method uses existing well established classifiers instead of devising new classification models. This was made possible because our method separates the gene pairing step (i.e., feature extraction step) from the classification model construction. Lastly, the k-TSP classifier uses frequency as a metric to assign score to their gene pairs, whereas we use reliable t-scores. Table 2 summarizes the accuracy results of the doublets and the baseline classifiers, as well as the accuracy of TSP and k-TSP. TSP refers to the case where only the single most influential TSP was used for classification. The TSP and k-TSP classifiers reported a robust performance, outperforming most of the baseline classifiers. Still, the two classifiers fall short for the purpose of our study. This study is significant in that it was demonstrated that a simple doublet-based feature extraction method remarkably improves the accuracy of conventional classifiers all the way up to the level of specialized classification algorithms such as TSP and k-TSP.
Table 2. LOOCV accuracy of the classifiers for the binary class expression datasets.
| Method | Leukemia | CNS | DLBCL | Colon | Pros.1 | Pros.2 | Pros.3 | Lung | GCM | Avg. |
| TSP* | 93.80 | 77.90 | 98.10 | 91.10 | 95.10 | 67.60 | 97.00 | 98.30 | 75.40 | 88.26 |
| k-TSP* | 95.83 | 97.10 | 97.40 | 90.30 | 91.18 | 75.00 | 97.00 | 98.90 | 85.40 | 92.01 |
| DT | 73.61 | 67.65 | 80.52 | 77.42 | 87.25 | 64.77 | 84.85 | 96.13 | 77.86 | 78.90 |
| sumdiff-DT† | 91.67 | 70.59 | 97.40 | 64.52 | 82.35 | 77.27 | 87.88 | 95.03 | 81.43 | 83.13 |
| mul-DT† | 84.72 | 55.88 | 97.40 | 79.03 | 86.27 | 69.32 | 90.91 | 92.27 | 83.21 | 82.11 |
| sign-DT† | 93.06 | 82.35 | 97.40 | 88.71 | 86.27 | 73.86 | 96.97 | 98.34 | 85.00 | 89.11 |
| NB | 100.00 | 82.35 | 80.52 | 56.45 | 62.75 | 73.86 | 90.91 | 97.79 | 84.29 | 80.99 |
| sumdiff-NB† | 98.61 | 82.35 | 92.21 | 87.10 | 82.35 | 76.14 | 96.97 | 99.45 | 81.43 | 88.51 |
| mul-NB† | 97.22 | 79.41 | 89.61 | 85.48 | 85.29 | 75.00 | 100.00 | 100.00 | 82.50 | 88.28 |
| sign-NB† | 65.28 | 73.53 | 75.32 | 64.52 | 50.98 | 56.82 | 72.73 | 82.87 | 67.86 | 67.77 |
| k-NN | 84.72 | 82.35 | 89.61 | 74.19 | 74.51 | 73.86 | 93.94 | 98.34 | 86.79 | 84.26 |
| sumdiff-k-NN† | 98.61 | 85.29 | 94.81 | 83.87 | 91.18 | 76.14 | 96.97 | 99.45 | 92.86 | 91.02 |
| mul-k-NN† | 97.22 | 85.29 | 93.51 | 80.65 | 85.29 | 77.27 | 100.00 | 100.00 | 91.79 | 90.11 |
| sign-k-NN† | 97.22 | 85.29 | 96.10 | 82.26 | 88.24 | 76.14 | 100.00 | 99.45 | 91.79 | 90.72 |
| SVM | 98.61 | 82.35 | 97.40 | 82.26 | 91.18 | 76.14 | 100.00 | 99.45 | 93.21 | 91.18 |
| sumdiff-SVM† | 98.61 | 82.35 | 96.10 | 88.71 | 93.14 | 78.41 | 100.00 | 99.45 | 91.07 | 91.98 |
| mul-SVM† | 97.22 | 88.24 | 96.10 | 87.10 | 88.24 | 79.55 | 100.00 | 99.45 | 91.07 | 91.89 |
| sign-SVM† | 97.22 | 79.41 | 97.40 | 79.03 | 89.22 | 75.00 | 100.00 | 99.45 | 87.5 | 89.36 |
| PAM | 94.03 | 82.35 | 85.45 | 89.52 | 90.89 | 81.25 | 94.24 | 97.90 | 82.32 | 88.66 |
| sumdiff-PAM† | 95.83 | 79.41 | 87.01 | 87.10 | 93.14 | 77.27 | 96.97 | 98.34 | 83.57 | 88.74 |
| mul-PAM† | 95.83 | 85.29 | 92.21 | 90.32 | 92.16 | 79.55 | 93.94 | 98.90 | 82.86 | 90.12 |
| sign-PAM† | 95.83 | 85.29 | 94.81 | 88.71 | 90.20 | 76.14 | 100.00 | 98.9 | 81.07 | 90.11 |
*Results obtained in [6]
Results from taking the top 4% of genes for making unique doublets.
The top 15 doublets and their associated KEGG pathways for the CNS dataset are shown in Table 3. One possible explanation on why the doublet accuracy is higher than those of the baseline classifiers could be that the pathways associated with each element of the doublet are somehow interlocked with each other, and therefore form a more robust biomarker compared to each of the pathways taken individually. However, a more robust investigation is required before any hypothesis can be validated. In our future work, we intend to conduct a systematic analysis of these top doublets, their associated pathways and their possible links to cancer.
Table 3. KEGG pathways related to the top 15 doublets for the CNS dataset.
| Doublet No. | Probe 1 | Gene 1 | KEGG 1 | Probe 2 | Gene 2 | KEGG 2 |
| 1 | U40317_s_at | PTPRS | Unknown | U27459_at | ORC2L | Cell cycle |
| 2 | J00212_f_at | IFNA21 | Cytokine-cytokine receptor interaction | U33920_at | SEMA3F | Axon guidance |
| Regulation of autophagy | ||||||
| Antigen processing and presentation | ||||||
| Toll-like receptor signaling pathway | ||||||
| Jak-STAT signaling pathway | ||||||
| Natural killer cell mediated cytotoicity | ||||||
| Autoimmune thyroid disease | ||||||
| 3 | D50924_at | DHX34 | Unknown | X04707_at | THRB | Neuroactive ligand-receptor interaction |
| 4 | U31215_s_at | GRM1 | Calcium signaling pathway | M64929_at | PPP2R2A | Tight junction |
| Neuroactive ligand-receptor interaction | ||||||
| Gap junction | ||||||
| Long-term potentiation | ||||||
| Long-term depression | ||||||
| 5 | U52828_s_at | CTNND2 | Unknown | U33267_at | GLRB | Neuroactive ligand-receptor interaction |
| 6 | D50582_at | KCNJ11 | Type II diabetes mellitus | Y10204_at | Unknown | Unknown |
| 7 | U83600_at | TNFRSF25 | Cytokine-cytokine receptor interaction | HG2260-HT2349_s_at | Unknown | Unknown |
| 8 | S77835_s_at | IL2 | Cytokine-cytokine receptor interaction | M60858_rna1_at | NCL | Pathogenic Escherichia coli infection - EHEC |
| Jak-STAT signaling pathway | Pathogenic Escherichia coli infection - EPEC | |||||
| T cell receptor signaling pathway | ||||||
| Type I diabetes mellitus | ||||||
| Autoimmune thyroid disease | ||||||
| Allograft rejection | ||||||
| Graft-versus-host disease | ||||||
| 9 | L32179_at | AADAC | Alkaloid biosynthesis II | M14660_at | IFIT2 | Unknown |
| 10 | D50310_at | CCNI | Unknown | L78833_cds2_at | RND2 | Unknown |
| 11 | HG2417-HT2513_at | Unknown | Unknown | U35451_at | CBX1 | Unknown |
| 12 | U03090_at | PLA2G5 | Glycerophospholipid metabolism | M16594_at | GSTA2 | Glutathione metabolism |
| Ether lipid metabolism | Metabolism of enobiotics by cytochrome P450 | |||||
| Arachidonic acid metabolism | Drug metabolism - cytochrome P450 | |||||
| Linoleic acid metabolism | ||||||
| alpha-Linolenic acid metabolism | ||||||
| MAPK signaling pathway | ||||||
| VEGF signaling pathway | ||||||
| Fc epsilon RI signaling pathway | ||||||
| Long-term depression | ||||||
| GnRH signaling pathway | ||||||
| 13 | U68536_at | ZNF24 | Unknown | X64728_at | CHML | Unknown |
| 14 | L43964_at | PSEN2 | Notch signaling pathway | X98206_at | Unknown | Unknown |
| Alzheimers disease | ||||||
| 15 | D13118_at | ATP5G1 | Oxidative phosphorylation | U78556_at | MTMR11 | Unknown |
| Alzheimers disease | ||||||
| Parkinsons disease |
We have shown that combining the expression data from gene pairs increases the accuracy of classifiers. We also have shown that increasing the number of genes for making doublets does not necessarily result in a commensurate increase in accuracy. This is significant because we can get a very high accuracy even though we use a very small subset of the total number of genes. Thus, the computational complexity of computing doublets, which can potentially be quadratic to the total number of genes in the dataset, is not critical since only a very small subset of the genes is used.
The genes comprising the top doublets also provide easily interpretable results, as compared to other methods like SVM. Although SVM may provide a higher accuracy than others, it is essentially a black box and no insight can be gained regarding biomarker genes. Doublets, on the other hand, are easily interpretable. Doublets identify which genes and which gene pairs can serve as biomarkers for tumor classification.
In the future, we plan to analyze these doublets across datasets and cancer types to select more robust cancer biomarker gene pairs. Especially, we will investigate how the individual doublets map to real genes' relations, such as suppression or stimulation, and how the relations function with regard to the carcinogenesis. It is further intended to exam the effectiveness of doublets in classifying multi-class cancer datasets.
Conclusion
The contribution of this paper is twofold. First, it has introduced doublets, a novel method to combine expression data from gene pairs. Gene pairs are more robust biomarkers as compared to individual genes, perhaps reflecting the fact that genes are interacting to perform a molecular function and the deregulation of the genes in the interaction, rather than independent genes, may be responsible for deregulating the critical pathways. Second, we have combined doublets with conventional classifiers to produce classifiers whose accuracy is greater than that of the original ones. We validated the framework using five well-known classifiers including PAM, DT, NB, SVM, and kNN. We showed that doublets can be easily incorporated into the existing classifiers without having to change the underlying algorithms, and that using doublets can consistently improve the classification accuracy of the original algorithms across different datasets.
Materials and Methods
Gene Doublets
Let there be N genes  in a tissue sample, and let there be M such tissue samples
  . The cancer dataset could then be represented as matrix
  of dimension
  . Then,
  would denote the expression value of the i-th gene,
  in the j-th sample,
  . The gene vector
  =
=  would denote the expression value of the i-th gene across the M tissue samples, and the column vector
  =
=  would represent the j-th tissue sample across the N genes. The class labels for the tissue samples are represented by vector
  =
=  , where
  , the set of all class labels. For our binary classification problem,
  , where
  denotes cancerous and
  denotes normal tissue samples.
For each pair of genes  in a dataset, we define a positive doublet vector and a negative doublet vector as
| (2) |
| (3) |
Thus, for our dataset with  genes, we have
  positive doublets and
  negative doublets, and our original microarray dataset of dimension
  is transformed into an
  matrix. Each row in this new matrix represents a doublet (positive or negative). We denote this matrix as
  , with dimension
  , where
  ; thus, the defined doublets are known as sumdiff doublets. In another variation of making doublets, we define the mul doublets as:
| (4) |
and sign doublets as:
| (5) |
The sumdiff doublets capture up-up, down-down (i.e. positive doublets) and up-down (i.e. negative doublets) relations of the expression values of gene pairs. Furthermore, the negative doublets capture the order of expression values between the genes in the gene pair. Please be noted that the datasets were processed to have a minimum value of 10 and a maximum of 16,000. Thereafter, the values were converted through  . Then, all the samples were standardized to zero mean and unit variance. The mul doublets not only capture the up-up, down-down, and up-down relations of gene pairs, but also amplify the relations through multiplication. However, the mul doublets do not capture the expression orders between genes. On the other hand, the sign doublets capture the inter-gene expression orders alone.
Microarray Data and Classification Methods
The microarray data is taken from several studies, as is shown in Table 1. These are the same datasets that were used in [6] for comparing TSP and k-TSP with various classifiers. The microarrays consist of the expression data for the tissues associated with colon, blood, lung, breast, prostate, and cancer of the central nervous system. The number of samples and the number of genes in each study are also shown in Table 1. For the baseline classifiers, we used the implementations available in Bioconductor (for PAM) [20] and Weka (for DT, NB, SVM and kNN) [21].
Classification Accuracy
We use the LOOCV (Leave One Out Cross Validation) method to estimate the classifier accuracy. For each sample  in the dataset, we use the rest of the
  samples in the dataset to predict the class of the
  sample. The classification accuracy of each dataset is the ratio of the number of the correctly classified samples (True Positives+True Negatives) to the total number of samples
  in that dataset.
Acknowledgments
This paper is a substantially extended version of our preliminary work presented in the 2009 IEEE International Conference on Bioinformatics and Biomedicine [22]. The paper presented in the conference introduced the preliminary findings limited only to one particular classification algorithm, PAM. In this extended paper, we generalized the findings by showing that the derived information from robust gene pairs could improve the accuracy of cancer classification independent of the underlying classification algorithms. We also discussed the interpretation of gene pairs in the highly indicative doublets and their association with cancer.
Footnotes
Competing Interests: The authors have declared that no competing interests exist.
Funding: This work was supported by the Second Brain Korea 21 Project Grant, a Microsoft Research Asia Grant, a National Research Foundation of Korea (NRF) grant funded by the Korean government (MEST) (2010-0015713, 2009-0086140), and a Korea Science and Engineering Foundation (KOSEF) grant funded by the Korean government (MEST) (R01-2008-000-20564-0). The funders had no role in study design, data collection and analysis, decision to publish, or preparation of the manuscript.
References
- 1.Lapointe J, Li C, Higgins JP, van de Rijn M, Bair E, et al. Gene expression profiling identifies clinically relevant subtypes of prostate cancer. PNAS. 2004;101:811–816. doi: 10.1073/pnas.0304146101. [DOI] [PMC free article] [PubMed] [Google Scholar]
- 2.Mramor M, Leban G, Demsar J, Zupan B. Visualization-based cancer microarray data classification analysis. Bioinformatics. 2007;23:2147–2154. doi: 10.1093/bioinformatics/btm312. [DOI] [PubMed] [Google Scholar]
- 3.Liu J, Ranka S, Kahveci T. Classification and feature selection algorithms for multi-class CGH data. Bioinformatics. 2008;24:i86–95. doi: 10.1093/bioinformatics/btn145. [DOI] [PMC free article] [PubMed] [Google Scholar]
- 4.Dudoit S, Fridlyand J, Speed TP. Comparison of discrimination methods for the classification of tumors using gene expression data. Journal of the American Statistical Association. 2002;97:77–87. [Google Scholar]
- 5.Dettling M, Buhlmann P. Boosting for tumor classification with gene expression data. Bioinformatics. 2003;19:1061–1069. doi: 10.1093/bioinformatics/btf867. [DOI] [PubMed] [Google Scholar]
- 6.Tan AC, Naiman DQ, Xu L, Winslow RL, Geman D. Simple decision rules for classifying human cancers from gene expression profiles. Bioinformatics. 2005;21:3896–3904. doi: 10.1093/bioinformatics/bti631. [DOI] [PMC free article] [PubMed] [Google Scholar]
- 7.Rogers MF, Ben-Hur A. The use of gene ontology evidence codes in preventing classifier assessment bias. Bioinformatics. 2009;25:1173–1177. doi: 10.1093/bioinformatics/btp122. [DOI] [PubMed] [Google Scholar]
- 8.Tibshirani R, Hastie T, Narasimhan B, Chu G. Diagnosis of multiple cancer types by shrunken centroids of gene expression. PNAS. 2002;99:6567–6572. doi: 10.1073/pnas.082099299. [DOI] [PMC free article] [PubMed] [Google Scholar]
- 9.Vapnik VN. The Nature of Statitistical Learning Theory. Springer 1995 [Google Scholar]
- 10.Guyon I, Weston J, Barnhill S, Vapnik V. Gene selection for cancer classification using support vector machines. Machine Learning. 2002;46:389–422. [Google Scholar]
- 11.Ripley B. Cambridge: Cambridge University Press; 1996. Pattern Recognition and Neural Networks. [Google Scholar]
- 12.Quinlan J. C4.5: Program for Machine Learning. Kaufmann 1993 [Google Scholar]
- 13.Geman D, d'Avignon C, Naiman DQ, Winslow RL. Classifying Gene Expression Profiles from Pairwise mRNA Comparisons. Statistical Applications in Genetics and Molecular Biology. 2004;3 doi: 10.2202/1544-6115.1071. doi: 10.2202/1544-6115.1071. [DOI] [PMC free article] [PubMed] [Google Scholar]
- 14.Parsons DW, Jones S, Zhang X, Lin JCH, Leary RJ, et al. An Integrated Genomic Analysis of Human Glioblastoma Multiforme. Science. 2008;321:1807–1812. doi: 10.1126/science.1164382. [DOI] [PMC free article] [PubMed] [Google Scholar]
- 15.Zhou XJ, Kao MCJ, Huang H, Wong A, Nunez-Iglesias J, et al. Functional annotation and network reconstruction through cross-platform integration of microarray data. Nature Biotechnology. 2005;23:238–243. doi: 10.1038/nbt1058. [DOI] [PubMed] [Google Scholar]
- 16.Kang J, Yang J, Xu W, Chopra P. Integrating heterogeneous microarray data sources using correlation signatures. In: Ludäscher B, Raschid L, editors. Data Integration in the Life Sciences, Second International Workshop, DILS 2005. San Diego, CA: Volume 3615 of Lecture Notes in Computer Science. Springer; 2005. pp. 105–120. [Google Scholar]
- 17.Lin Km, Kang J, Shin H, Lee J. A cube framework for incorporating inter-gene information into biological data mining. Int J Data Min Bioinformatics. 2009;3:3–22. doi: 10.1504/ijdmb.2009.023881. [DOI] [PubMed] [Google Scholar]
- 18.Chopra P, Kang J, Yang J, Cho H, Kim HS, et al. Microarray data mining using landmark gene-guided clustering. BMC Bioinformatics. 2008;9:92. doi: 10.1186/1471-2105-9-92. [DOI] [PMC free article] [PubMed] [Google Scholar]
- 19.Yoon S, Kim S. Top scoring pair algorithm for feature selection in svm with applications to microarray data classification. Soft Computing - A Fusion of Foundations, Methodologies and Applications. 2010;14:151–159. [Google Scholar]
- 20.Gentleman R, Carey V, Bates D, Bolstad B, Dettling M, et al. Bioconductor: open software development for computational biology and bioinformatics. Genome Biol. 2004;5:R80. doi: 10.1186/gb-2004-5-10-r80. [DOI] [PMC free article] [PubMed] [Google Scholar]
- 21.Hall M, Frank E, Holmes G, Pfahringer B, Reutemann P, et al. The weka data mining software: An update. SIGKDD Explorations. 2009;2 [Google Scholar]
- 22.Chopra P, Kang J, Lee J. Washington D.C., USA: Proceedings of the IEEE International conference on Bioinformatics and Biomedicine(BIBM); 2009. Using gene pair combinations to improve the accuracy of the pam classifier. [Google Scholar]
- 23.Alon U, Barkai N, Notterman D, Gish K, Ybarra S, et al. Multiclass cancer diagnosis using tumor gene expression signatures. PNAS. 1999;96:6745–6750. doi: 10.1073/pnas.96.12.6745. [DOI] [PMC free article] [PubMed] [Google Scholar]
- 24.Golub TR, Slonim DK, Tamayo P, Huard C, Gaasenbeek M, et al. Molecular Classification of Cancer: Class Discovery and Class Prediction by Gene Expression Monitoring. Science. 1999;286:531–537. doi: 10.1126/science.286.5439.531. [DOI] [PubMed] [Google Scholar]
- 25.Pomeroy S, Tamayo P, Gaasenbeek M, Sturla L, Angelo M, et al. Prediction of central nervous system embryonal tumour outcome based of gene expression. Nature. 2002;415:436–442. doi: 10.1038/415436a. [DOI] [PubMed] [Google Scholar]
- 26.Shipp MA, Ross KN, Tamayo P, Weng AP, Kutok JL, et al. Diffuse large B-cell lymphoma outcome prediction by gene-expression profiling and supervised machine learning. Nat Med. 2002;8:68–74. doi: 10.1038/nm0102-68. [DOI] [PubMed] [Google Scholar]
- 27.Gordon GJ, Jensen RV, Hsiao LL, Gullans SR, Blumenstock JE, et al. Translation of Microarray Data into Clinically Relevant Cancer Diagnostic Tests Using Gene Expression Ratios in Lung Cancer and Mesothelioma. Cancer Res. 2002;62:4963–4967. [PubMed] [Google Scholar]
- 28.Singh D, Febbo PG, Ross K, Jackson DG, Manola J, et al. Gene expression correlates of clinical prostate cancer behavior. Cancer Cell. 2002;1:203–209. doi: 10.1016/s1535-6108(02)00030-2. [DOI] [PubMed] [Google Scholar]
- 29.Stuart RO, Wachsman W, Berry CC, Wang-Rodriguez J, Wasserman L, et al. In silico dissection of cell-type-associated patterns of gene expression in prostate cancer. PNAS. 2004;101:615–620. doi: 10.1073/pnas.2536479100. [DOI] [PMC free article] [PubMed] [Google Scholar]
- 30.Welsh JB, Sapinoso LM, Su AI, Kern SG, Wang-Rodriguez J, et al. Analysis of Gene Expression Identifies Candidate Markers and Pharmacological Targets in Prostate Cancer. Cancer Res. 2001;61:5974–5978. [PubMed] [Google Scholar]
- 31.Ramaswamy S, Tamayo P, Rifkin R, Mukherjee S, Yeang CH, et al. Multiclass cancer diagnosis using tumor gene expression signatures. PNAS. 2001;98:15149–15154. doi: 10.1073/pnas.211566398. [DOI] [PMC free article] [PubMed] [Google Scholar]