Abstract
We have constructed a three-dimensional (3D) whole body mouse atlas from coregistered x-ray CT and cryosection data of a normal nude male mouse. High quality PET, x-ray CT and cryosection images were acquired post mortem from a single mouse placed in a stereotactic frame with fiducial markers visible in all three modalities. The image data were coregistered to a common coordinate system using the fiducials and resampled to an isotropic 0.1 mm voxel size. Using interactive editing tools we segmented and labelled whole brain, cerebrum, cerebellum, olfactory bulbs, striatum, medulla, masseter muscles, eyes, lachrymal glands, heart, lungs, liver, stomach, spleen, pancreas, adrenal glands, kidneys, testes, bladder, skeleton and skin surface. The final atlas consists of the 3D volume, in which the voxels are labelled to define the anatomical structures listed above, with coregistered PET, x-ray CT and cryosection images. To illustrate use of the atlas we include simulations of 3D bioluminescence and PET image reconstruction. Optical scatter and absorption values are assigned to each organ to simulate realistic photon transport within the animal for bioluminescence imaging. Similarly, 511 keV photon attenuation values are assigned to each structure in the atlas to simulate realistic photon attenuation in PET. The Digimouse atlas and data are available at http://neuroimage.usc.edu/Digimouse.html.
1. Introduction
The Digimouse atlas was generated from a normal nude male mouse using two imaging modalities, x-ray microCT and colour cryosection images. The atlas also includes coregistered PET data representing the distribution of a mixture of the tracers 18F− and 18F-fluorodeoxyglucose (FDG) within the mouse. In this paper we describe our methodology for acquiring and registering the PET, x-ray CT and cryosection data. We then describe our approach to defining and labelling anatomical structures in the atlas.
A number of alternative mouse atlases are currently available, including the MOBY phantom (Segars et al 2004) created from Visible Mouse data from the Duke Center for In Vivo Microscopy, the atlas of embryonic mouse development at Caltech (Dhenain et al 2001) and the Mouse Atlas Project developed at the University of Edinburgh (Burger et al 2002). The Visible Mouse (Johnson et al 2002) is a 110 micron resolution magnetic resonance microscopy volume image of a normal 16 week old male C57BL/6 mouse. The organ models in the MOBY phantom were segmented from this data. Three-dimensional non-uniform rational B-spline (NURBS) surfaces were then fit to each segmented structure to generate a mathematical phantom. Cardiac and respiratory motion were also modelled using four-dimensional (4D) NURBS in the MOBY phantom (Segars et al 2004). The embryonic mouse atlas is a three-dimensional (3D) digital atlas of mouse embryo development from conception through birth, again constructed using magnetic resonance microscopy (Dhenain et al 2001). The atlas developed at the University of Edinburgh is a spatial database of gene expression patterns in the developing mouse embryo (Burger et al 2002). There are also a number of atlases that focus on the mouse brain (MacKenzie-Graham et al 2004, Rosen et al 2000, Hof et al 2000) and hypothalamus (Broadwell and Bleier 1976).
All but one of the atlases listed above are either restricted to a specific organ or are of embryonic rather than mature animals. The MOBY atlas is closest in spirit and content to the Digimouse atlas described here. However, in addition to differences in terms of the strain of the mouse, the types of organs defined, and resolution, these atlases differ in the modalities from which they were constructed, i.e. magnetic resonance microscopy versus x-ray CT and cryosectioning. The MOBY atlas has the advantage of modelling cardiac and respiratory motion providing a 4D mouse phantom for use by the small animal imaging community. The Digimouse atlas includes functional information (PET) in addition to the anatomical information (x-ray CT and cryosections) which together with the labelled atlas represent a multimodal mouse phantom. With the increasing use of small animal whole body in vivo imaging across multiple modalities the availability of a whole body multimodal atlas has many potential applications in both simulation and in vivo studies. Potential applications of the mouse atlas include the following:
A pedagogical tool for exploring mouse anatomy across modalities.
Automated labelling of anatomical structures by coregistration of in vivo mouse image data either directly to the atlas or to the source x-ray CT and cryosection image data from which the atlas was constructed.
Computer phantom studies to simulate small animal PET, SPECT, x-ray CT or MRI imaging systems.
Generation of boundary or finite element meshes for use in modelling of light propagation for 3D bioluminescence (Chaudhari et al 2005) and fluorescence imaging (Ntziachristos et al 2002) systems. These can be used either for simulation purposes, or when combined with automated registration from an individual mouse to the atlas, for solving the forward problem in in vivo tomographic studies.
2. Mouse preparation and imaging
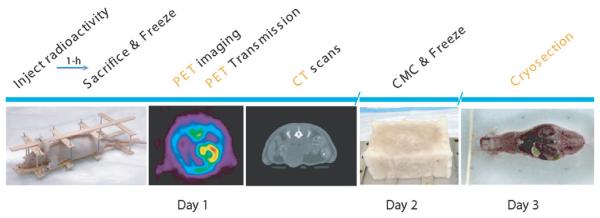
We injected a 28 g normal nude male mouse with 765 μCi of FDG and 216 μCi of 18F− ion in solution, a mixture chosen to show uptake in PET images in both soft tissue (heart, brain, kidney, muscle, bladder) and skeletal structures. Uptake and non-specific clearance was allowed for 1 h under light anaesthesia (ketamine/xylazine). During the last 15 min of uptake, the bladder was expressed and we sutured the mouse into a rigid framework (figure 1). We designed this framework to hold the mouse in place throughout the imaging protocol, and attached six 0.8 mm diameter hollow teflon tubes which were filled with ink and 18F− ion (18 μCi each tube) to serve as fiducial markers for the three imaging modalities. The posture of the mouse in this framework was as close as possible to that of the mouse in a typical PET or x-ray CT imaging experiment (Stout et al 2003). After 1 h we sacrificed the mouse using pentobarbital overdose and immediately froze it in liquid nitrogen to prevent bloating from rapidly developing gas pockets. Careful attention was needed to gently freeze the animal in stages to prevent cracking due to large temperature gradients in the tissues. We used two 8 s immersions in liquid nitrogen to rapidly freeze the mouse. During the imaging process we maintained this frozen state by blowing a cold stream of nitrogen gas over the mouse. The liquid nitrogen was boiled off in a Dewar using a heater connected to a power supply, which allowed the gas flow to be easily controlled. The end of the Dewar pipe was held in place and positioned just outside the active field of view for the PET and x-ray CT systems. Testing of this cooling system using frozen water in a 50 cc test tube with an embedded thermocouple showed that the temperature could be maintained well below freezing for as long as liquid nitrogen was available, which was in excess of 10 h for the Dewar size we used.
Figure 1.
The sequence of processing of the mouse for acquiring the PET, x-ray CT and cryosection image data.
We acquired the PET images in one bed position in a Concorde P4 microPET scanner (Siemens Preclinical Solutions, Knoxville, TN) following 60 min uptake of the probe and the images were reconstructed using a MAP (maximum a posteriori) reconstruction algorithm (Qi et al 1998). The whole PET imaging process consisted of a 30 min emission scan followed by 2 × 10 min of transmission scanning using singles and a 360 μCi Ge-68 point source. An additional 10 min singles scan was acquired without the point source to estimate the emission contamination in the transmission scans. We also corrected for attenuation using the x-ray CT data we acquired in the next step (Chow et al 2005).
We acquired the x-ray CT images of the whole body in two bed positions using the Imtek microCAT system (Siemens Preclinical Solutions, Knoxville, TN) immediately following the PET scans. Each position was acquired using 0.5 mm aluminium filtration, 784 steps, 450 ms exposures at 50 kvp and 250 μA. We reconstructed the two CT images on a 18 CPU Beowulf PC cluster using the Feldkamp cone beam reconstruction method with a ramp filter to produce a volumetric image with a voxel size of 0.1 mm.
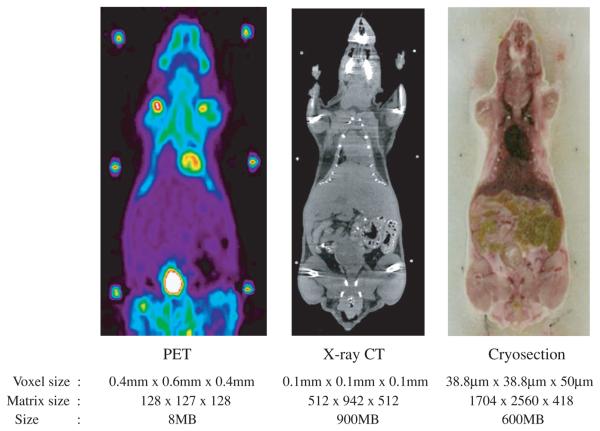
Following PET and CT imaging, we packed the mouse and framework in carboxyl methyl cellulose (CMC) inside a plastic pipette box and froze it for 60 s in liquid nitrogen. The CMC not only acts as a common stabilizer but also assists the smooth motion of the cryosection blade. After freezing overnight at −20 C, the plastic box was stripped off and the block was attached to the cryostat cutting plate using additional CMC. We froze the plate and the block overnight to ensure a strong bond. The cryostat was set to cut 50 μm thick sections throughout the entire mouse. We acquired digital images of the block using a Nikon CoolPix 5700 camera and a 1 GB microdrive. To avoid changes in focus, the camera was set to manual focus of 30 cm with a fixed aperture of 11.3. No flash was used since it caused unwanted reflections from the surface. After each slice was removed the block was cleaned with a single swipe of a 70% EtOH pad to remove any ice or bone chips and create a smooth clear image surface. The camera was mounted on a stand and operated remotely to avoid moving the camera between images. Additional testing indicated that no loss of resolution could be determined between using the raw data, uncompressed TIFF images or minimal JPEG compression; therefore we used the minimal JPEG compression setting. The main advantage of using JPEG was the ability to fit the entire image volume onto a single 1 GB microdrive, allowing the camera to remain untouched during the entire cryosectioning session. An additional advantage was that the imaging time was considerably shortened, since storing the uncompressed images required significantly longer waits between imaging each slice. The sequence of events for processing of the mouse for PET, x-ray CT and cryosectioning is illustrated in figure 1 and representative image slices from PET, x-ray CT and the cryosection data are shown in figure 2. A preliminary report on this procedure is given in Stout et al (2002).
Figure 2.
Representative slices from the image data for (a) PET (b) x-ray CT and (c) cryosection (voxel and matrix sizes are given in the sagittal, axial and coronal directions, respectively).
3. Processing the data
3.1. Data alignment and resampling
Prior to constructing the Digimouse atlas we resampled the cryosection images onto an isotropic 0.1 mm grid and then coregistered and resampled the x-ray CT and PET data to the same coordinate system. We will now describe these steps in detail.
The cryosections were obtained as coronal sections with an in-plane voxel size of 38.8 μm in the sagittal and axial directions and a 50 μm slice thickness in the coronal direction, making a matrix size of 1704 × 2560 × 418 (throughout the paper we list matrix sizes as sagittal × axial × coronal). In the process of acquiring the cryosection images, minor shifts occurred since the moving belt of the cryostat did not always reposition the block in exactly the same location with each pass under the cutting knife. This caused relative movement between some sections and hence linear misalignment of these slices. Since these misalignments occurred only in the coronal sectioning plane they could be corrected slice-by-slice through translation in the axial and sagittal directions. We segmented the fiducial markers in each slice and cross-correlated the images of the fiducial markers between successive images to determine which slices were misaligned. In these slices, the translation was chosen to maximize interslice correlation of the images of the fiducial markers. The final result was verified by visual inspection. We then cropped the cryosection slices to remove background and resampled each slice using bicubic interpolation to a 0.1 mm × 0.1 mm voxel size. Since the slice thickness was 50 μm we used every second slice to generate an isotropic 0.1 mm cubical voxel for a matrix size of 380 × 992 × 208 for the entire mouse.
The x-ray CT image reconstructed from the two bed positions had a 0.1 mm isotropic voxel size with a matrix size of 512 × 942 × 512. We cropped the volume to 372 × 920 × 292 voxels and adjusted the image intensity scale to maximize soft tissue contrast using the software ImageJ (Rasband 2003). We then registered the x-ray CT data to the cryosection data using the RVIEW software, which finds the rigid transformation (rotation, translation and scaling) that maximizes mutual information between the two image volumes (Studholme et al 1999).
After rigid registration, overlay of the cryosection and x-ray CT images showed misalignment in the head and forelimbs. We believe this was because the animal was not completely frozen during x-ray CT and PET imaging, and subsequent small displacements of the head and forelimbs occurred during packing and freezing of the mouse in CMC. To correct this problem we applied piecewise rigid registration separately for body, head and forelimbs, followed by a nonrigid refinement using the LEREG (linear elastic registration) software (Christensen 1999) to ensure a continuous deformation field between the two volumes.
The PET image data were reconstructed on 0.4 mm voxels in the transaxial planes and 0.6 mm in the axial direction with a matrix size of 128 × 127 × 128. These were rigidly registered to the x-ray CT data using RVIEW (Studholme et al 1999). The PET data were then transformed into the space of the cryosection images by applying the same nonrigid registration transformation we previously used to map the x-ray CT to the cryosection data. The PET data were then resampled in this space at the same density as the resampled x-ray CT and cryosection data to produce the final set of coregistered data.
3.2. Segmentation and labelling
The anatomy of the mouse was defined using an interactive curve editing tool implemented in Matlab (Mathworks, Natick, MA) specifically for development of this atlas. The graphical user interface allowed us to load the registered two-dimensional (2D) cryosection and x-ray CT volumes, blend the two images, and view in three orthogonal planes. Using this tool we were able to segment individual organs from coronal slices. We then verified segmentation accuracy in sagittal and transaxial views.
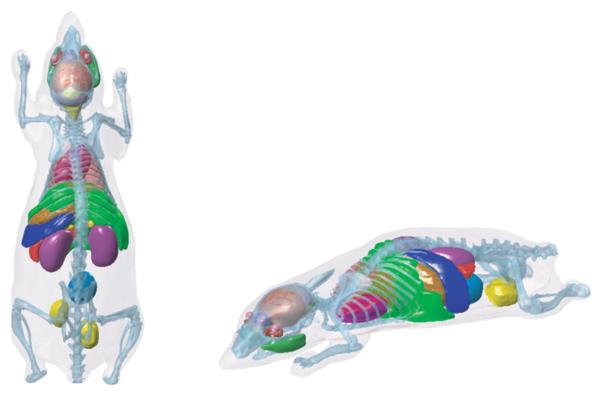
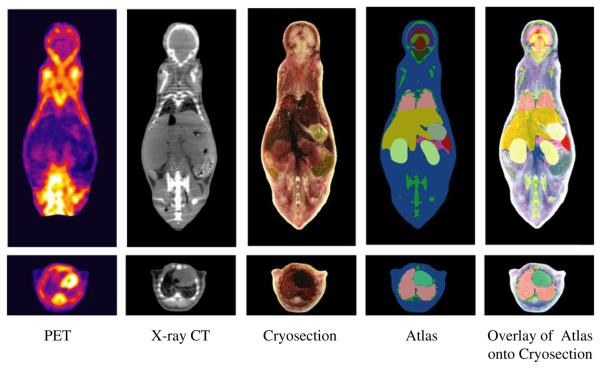
We began by segmenting the outer skin boundary and skeleton by thresholding the x-ray CT images. The resulting skeleton was then edited using the interactive tool to correct bone boundaries affected by partial volume effects and artefacts due to scatter and beamhardening. Additional soft tissue structures were then added to the atlas by tracing their boundaries in successive coronal sections of the fused x-ray CT and cryosection images. The boundaries were defined by the user as a set of points which are then automatically interpolated using a cubic B-spline. The boundaries were then refined by dragging and adding control points to achieve the best fit to the organs in the fused image data. After segmenting an organ in each slice, the surface of the resulting volume was tesselated using the marching cubes algorithm and then smoothed using a mean curvature flow algorithm as implemented in our BrainSuite software (Shattuck and Leahy 2002). Organ volumes were then reconstructed from these smoothed surfaces. The following organs were defined in this way: whole brain, external cerebrum, cerebellum, olfactory bulbs, striatum, medulla, masseter muscles, eyes, lachrymal glands, heart, lungs, liver, stomach, spleen, pancreas, adrenal glands, kidneys, testes and bladder. Since the organs were segmented one at a time, further processing was needed to correct for overlap between organs and/or the skeleton. We corrected these overlaps using a volumetric hand-editing tool in BrainSuite (Shattuck and Leahy 2002). Figure 3 shows a 3D surface rendering of the structures in the final atlas. Coronal and transaxial sections through the atlas and coregistered datasets are shown in figure 4.
Figure 3.
Surface rendering of atlas structures: whole brain, external cerebrum, cerebellum, olfactory bulbs, striatum, medulla, masseter muscles, eyes, lachrymal glands, heart, lungs, liver, stomach, spleen, pancreas, adrenal glands, kidneys, testes, bladder, skeleton and skin in Digimouse.
Figure 4.
Coronal and transaxial sections through the coregistered PET, x-ray CT and cryosection datasets and atlas.
The complete set of coregistered data and volumetric labelled atlas are available at the website http://neuroimage.usc.edu/Digimouse.html together with a mesh representation of the atlas for use with boundary and finite element methods as described in the following section.
4. Applications: PET and optical simulations using the mouse atlas
We conclude by illustrating use of the atlas in simulating small animal bioluminescence and PET imaging studies. We assume a cancer model in which we implant three tumours at distinct locations in the atlas. The spherical tumours each have a radius of 1.8 mm and were placed in the brain, lung and spleen. We assume that the tumour cells are labelled with the firefly luciferase (FFL) gene so that they can be localized with a bioluminescence imaging system. We also simulate PET imaging of the uptake of FDG in the same three tumours with realistic non-specific background activity as described below.
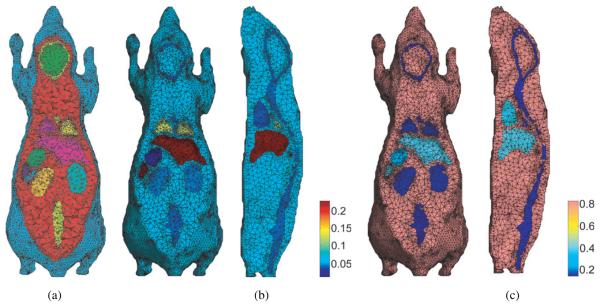
For the bioluminescence simulation we downsampled the mouse atlas to a matrix size of 95 × 248 × 52 with a voxel size of 0.4 mm. We then generated a 3D mesh representation of the atlas using a constrained Delaunay tetrahedralization method (Si 2005), in which the organ boundaries are more densely tesselated than their interiors to more accurately reflect the surface shape of different organs. The final mesh, illustrated in figure 5(a), had 306 773 elements, 16 164 surface nodes and 42 080 internal nodes. To simulate bioluminescence imaging we solve the diffusion equation using frequency dependent optical attenuation and scatter coefficients (Alexandrakis et al 2005) assigned to each organ in the atlas. We simulate volumetric reconstruction of bioluminescent sources as described in Chaudhari et al (2005), in which multispectral images of the light emitted from the animal are used. A source grid was defined within the atlas on a regular grid with 1.2 mm voxel spacing for a total of 9192 source locations. A finite element method (FEM) solution of the diffusion equation was computed to define the mapping from each source location within the animal to each of the mesh nodes on the skin surface. We used the optical properties as reported in Alexandrakis et al (2005) assigned element-wise for all organs for six wavelength bins uniformly spaced by 20 nm from 600 nm to 700 nm, as illustrated in figure 5(b). Details of the multispectral forward model can be found in Chaudhari et al (2005).
Figure 5.
(a) Tetrahedral mesh representation of the mouse atlas using 3D constrained Delaunay method; (b) assignment of optical absorption coefficients to the FEM mesh at 700 nm; (c) assignment of optical diffusion coefficients also at 700 nm.
Bioluminescence data are acquired in the focal plane of the CCD camera, but for the purposes of this simulation we assume that we directly measure photon density at the skin surface of the animal. We computed the photon density at the surface of the atlas for each of the six wavelength bins assuming uniform expression of FFL within each tumour (Wet et al 1987). Noise (SNR = 200) sampled from a bioluminescence background image taken with the CCD camera mounted on the IVIS200 imaging system (Xenogen, Alameda, CA) was added to simulate realistic noise conditions. The 3D reconstruction of FFL was computed using a positively constrained regularized least-squares method as described in Chaudhari et al (2005).
The PET simulation is based on a model of the F220 microPET (Siemens Preclinical Solutions, Knoxville, TN) small animal scanner. To simulate PET data we used a forward projector based on the factored system approach described in Qi et al (1998). This system model includes geometric sensitivity, attenuation and normalization factors together with a blur kernel that takes into account the block structure of the scanner and intercrystal penetration and scatter. Fully 3D sinograms were simulated with a maximum ring difference of 47 and span 3.
To generate an attenuation map we used an idea similar to that described in Chow et al (2005) where we assigned linear attenuation coefficients to each structure in the atlas according to the values listed in table 1. These values were obtained by logarithmic interpolation of published values (Hubbell and Seltzer 1996) to compute specific coefficients at 511 keV. Soft tissue attenuation coefficients vary little at this energy level and assigning different attenuation values to each organ would have a larger impact on SPECT studies with lower energy gamma rays.
Table 1.
Linear attenuation coefficients assigned to different tissues in Digimouse to generate the attenuation map for the PET simulation.
| Tissue type | Type of material |
LAC (cm−1) |
|---|---|---|
| Air | Air | 1.04 × 10⁻⁴ |
| Background | Adipose tissue | 0.0913 |
| Skeleton | Bone cortical | 0.1717 |
| Eye | Eye lens | 0.1012 |
| Medulla, olfactory bulbs, heart, lachrymal glands, bladder wall, stomach, spleen, pancreas, liver, kidneys, adrenal glands, skin | Soft tissue | 0.1008 |
| Cerebellum, external cerebrum, striatum, rest of the brain | Brain | 0.0994 |
| Testes | Testis | 0.0993 |
| Masseter muscles | Muscle | 0.0999 |
| Lungs | Lung tissue | 0.0317 |
| Bladder content | Water | 0.0960 |
| Tumours | Soft tissue | 0.1008 |
To simulate FDG uptake in the atlas we assumed uniform activity in the three tumours and added as background a scaled version of the Digimouse activity reconstructed from the PET data acquired during preparation of the atlas. While this does not closely reflect a true study, since the Digimouse PET data used a combination of 18F− and FDG, it does provide texture to the background similar to that found in in vivo studies. The combined tumour and background activity was forward projected through the system model to simulate sinogram data. Data were scaled after forward projection using a measured normalization scan from the F220 scanner. Pseudo-Poisson noise was then added to achieve the equivalent of an average of 20 counts per line of response. Images were reconstructed using two iterations of a 3D OSEM algorithm and 18 iterations of a preconditioned conjugate gradient MAP method (Qi et al 1998, Qi and Leahy 2000,Li et al 2004). A quadratic prior was used with a smoothing parameter of 0.1.
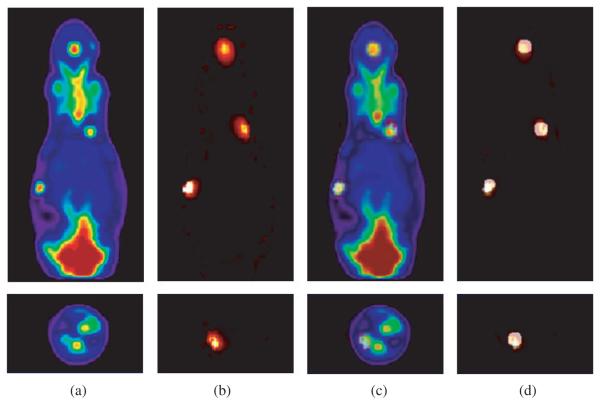
Figure 6 shows a comparison of the PET and bioluminescence reconstructions from data simulated using the Digimouse atlas. The PET images illustrate the ability of microPET scanners to image relatively small tumours. Through use of the phantom we can investigate the behaviour of different reconstruction algorithms or imaging systems for realistic anatomically based PET tracer distributions. The bioluminescence images show that it is possible to accurately reconstruct FFL sources in 3D using multispectral data, at least in cases where the forward model (i.e. the spatial distribution of optical diffusion and absorption coefficients) are known. Through use of the atlas we are able to investigate the accuracy with which FFL and other bioluminescent and fluorescent sources can be estimated as a function of imaging system parameters and reconstruction algorithm. Furthermore, we can investigate the sensitivity of these results to errors in our estimates of the optical properties of the animal.
Figure 6.
Comparison of PET and 3D bioluminescence reconstructions in coronal (top row) and transaxial (bottom row) views: (a) PET; (b) bioluminescence; (c) fusion of bioluminescence and PET reconstructions; (d) fusion of bioluminescence and ground truth tumour image.
5. Discussions and future work
We have constructed a volumetric mouse atlas for which we identified a number of potential uses in the introduction. We also illustrated its application to the evaluation of small animal imaging systems and reconstruction methods. The combination of cryosection and x-ray CT images enhanced our ability to delineate both soft tissue structures and bone. We encountered unexpected problems in coregistering the data sets due to relative motion of the limbs and head after the x-ray CT and PET data were acquired. This could be reduced in future atlas projects by further reducing the internal temperature of the mouse before scanning. Nevertheless, computational tools for nonrigid registration allowed us to align the data after acquisition. Soft tissue structures in the mouse would have been more clearly delineated if the x-ray CT data had been acquired using a contrast agent such as Fenestra (Advanced Research Technologies, Quebec, Canada); however, this was not available at the time that the data were acquired (Stout et al 2002). Coregistered high resolution magnetic resonance image data, such as that used in the MOBY phantom (Segars et al 2004), would also have added to our ability to delineate structures in the atlas. Nevertheless, the high resolution cryosection data provides a wealth of anatomical detail which we believe, in combination with the labelled volume and coregistered x-ray CT and PET data, will make this a useful tool for researchers working in small animal imaging.
Acknowledgments
The authors would like to thank Patrick L Chow for his help in PET and CT data acquisitions and reconstructions and Robert Silverman for his help in animal freezing and cooling. We would also like to thank Colin Studholme for providing RVIEW and Gary Christensen for providing the LEREG software. We would also like to thank Caroline Brun for help in brain segmentation and Abhijit J Chaudhari and Quanzheng Li for help with the bioluminescence and PET examples. This work was supported by the National Institutes of Health under grants R01 EB000363, P20 CA086352, and R24 CA92865 and the US Department of Energy under contract no DE-FC03-02ER63420.
References
- Alexandrakis G, Rannou FR, Chatziioannou AF. Tomographic bioluminescence imaging by use of a combined optical-PET (OPET) system: a computer simulation feasibility study. Phys. Med. Biol. 2005;50:4225–41. doi: 10.1088/0031-9155/50/17/021. [DOI] [PMC free article] [PubMed] [Google Scholar]
- Broadwell RD, Bleier R. A cytoarchitectonic atlas of the mouse hypothalamus. J. Comp. Neurol. 1976;167:315–39. doi: 10.1002/cne.901670304. [DOI] [PubMed] [Google Scholar]
- Burger A, Baldock R, Yang Y. The Edinburgh mouse atlas and gene-expression database: a spatio-temporal database for biological research; Proc. 14th Int. Conf. on Scientific and Statistical Database Management (SSDBM02); 2002. http://genex.hgu.mrc.ac.uk/ [Google Scholar]
- Chaudhari AJ, Darvas F, Bading JR, Moats RA, Conti PS, Smith DJ, Cherry SR, Leahy RM. Hyperspectral and multispectral bioluminescence optical tomography for small animal imaging. Phys. Med. Biol. 2005;50:5421–41. doi: 10.1088/0031-9155/50/23/001. [DOI] [PubMed] [Google Scholar]
- Chow P, Rannou F, Chatziioannou A. Attenuation correction for small animal pet tomographs. Phys. Med. Biol. 2005;50:1837–50. doi: 10.1088/0031-9155/50/8/014. [DOI] [PMC free article] [PubMed] [Google Scholar]
- Christensen GE. Information Processing in Medical Imaging, LCNS 1613. Springer; Berlin: 1999. Consistent linear-elastic transformations for image matching; pp. 224–37. [Google Scholar]
- Dhenain M, Ruffins SW, Jacobs RE. Three-dimensional digital mouse atlas using high-resolution mri. Dev. Biol. 2001;232:458–70. doi: 10.1006/dbio.2001.0189. http://mouseatlas.caltech.edu/ [DOI] [PubMed]
- Hof PR, Young WG, Bloom FE, Belichenko PV, Celio MR. Comparative Cytoarchitectonic Atlas of the C57BL/6 and 129/Sv Mouse Brains. Elsevier; New York: 2000. [Google Scholar]
- Hubbell JH, Seltzer SM. Tables of x-ray mass attenuation coefficients and mass energy absorption coefficients from 1 keV to 20 MeV for elements ζ = 1 to 92 and 48 additional substances of dosimetric interest. National Institute of Standards and Technology; Gaithersburg, MD: 1996. http://physics.nist.gov/PhysRefData/XrayMassCoef/cover.html(accessed August 2005) [Google Scholar]
- Johnson GA, Cofer GP, Gewalt SL, Hedlund LW. Morphologic phenotyping with magnetic resonance microscopy: the visible mouse. Radiology. 2002;222:789–93. doi: 10.1148/radiol.2223010531. [DOI] [PubMed] [Google Scholar]
- Li Q, Asma E, Qi J, Bading JR, Leahy RM. Accurate estimation of the fisher information matrix for the pet image reconstruction problem. IEEE Trans. Med. Imaging. 2004;23:1057–64. doi: 10.1109/TMI.2004.833202. [DOI] [PubMed] [Google Scholar]
- MacKenzie-Graham A, et al. A multimodal, multidimensional atlas of the c57bl/6j mouse brain. J. Anat. 2004;204:93–102. doi: 10.1111/j.1469-7580.2004.00264.x. [DOI] [PMC free article] [PubMed] [Google Scholar]
- Ntziachristos V, Tung C, Bremer C, Weissleder R. Fluorescence molecular tomography resolves protease activity in vivo. Nat. Med. 2002;8:757–61. doi: 10.1038/nm729. [DOI] [PubMed] [Google Scholar]
- Qi J, Leahy RM. Resolution and noise properties of map reconstruction for fully 3d pet. IEEE Trans. Med. Imaging. 2000;19:493–506. doi: 10.1109/42.870259. [DOI] [PubMed] [Google Scholar]
- Qi J, Leahy RM, Cherry SR, Chatziioannou A, Farquhar TH. High resolution 3d bayesian image reconstruction using the microPET small-animal scanner. Phys. Med. Biol. 1998;43:1001–13. doi: 10.1088/0031-9155/43/4/027. [DOI] [PubMed] [Google Scholar]
- Qi J, Leahy RM, Hsu C, Farquhar TH, Cherry SR. Fully 3d bayesian image reconstruction for the ecat exact hr+ IEEE Trans. Nucl. Sci. 1998;45:1096–103. [Google Scholar]
- Rasband W. Imagej. 2003 http://rsb.info.nih.gov/ij/
- Rosen GD, Williams AG, Capra JA, Connolly MT, Cruz B, Lu L, Airey DC, Kulkarni K, Williams RW. The mouse brain library. Int. Mouse Genome Conference 14. 2000;166 @ www.mbl.org.
- Segars WP, Tsui BMW, Frey EC, Johnson GA, Berr SS. Development of a 4D digital mouse phantom for molecular imaging research. Mol. Imaging Biol. 2004;6:149–59. doi: 10.1016/j.mibio.2004.03.002. [DOI] [PubMed] [Google Scholar]
- Shattuck DW, Leahy RM. Brainsuite: an automated cortical surface identification tool (invited article) Med. Image Anal. 2002;8:129–42. doi: 10.1016/s1361-8415(02)00054-3. http://brainsuite.usc.edu/ [DOI] [PubMed]
- Si H. A quality tetrahedral mesh generator and three-dimensional delaunay triangulator. 2005 (version 1.3.4, June 17, 2005) ( http://tetgen.berlios.de/)
- Stout DB, Chow PL, Gustilo A, Grubwieser S, Chatziioannou AF. Mol. Imaging Biol. (Madrid) Vol. 5. Elsevier; New York: 2003. Multimodality isolated bed system for mouse imaging experiments. [Google Scholar]
- Stout DB, Chow PL, Silverman R, Leahy R, Lewis X, Gambhir S, Chatziioannou A. Creating a whole body digital mouse atlas with PET, CT and cryosection images. Mol. Imaging Biol. 2002;4 [Google Scholar]
- Studholme C, Hill DLG, Hawkes D. An overlap invariant entropy measure of 3D medical image alignment. Pattern Recognit. 1999;32:71–86. ( http://rview.colin-studholme.net/
- Wet JRD, Wood KV, DeLuca M, Helinski DR, Subramani S. Firefly luciferase gene: structure and expression in mammalian cells. Mol. Cell Biol. 1987;7:725–37. doi: 10.1128/mcb.7.2.725. [DOI] [PMC free article] [PubMed] [Google Scholar]


