

Abstract
The hypothalamic-pituitary-thyroid (HPT) axis is a major contributor in maintaining energy expenditure and body weight, and the adipocyte hormone leptin regulates this axis by increasing TRH levels in the fed state. Leptin stimulates TRH directly in the hypothalamic paraventricular nucleus (PVN; direct pathway) and indirectly by regulating proopiomelnocortin neurons in the hypothalamic arcuate nucleus (ARC; indirect pathway). Whereas the indirect pathway is fully functional in lean animals, it is inactive during diet-induced obesity (DIO) because of the establishment of leptin resistance. Despite this, the HPT axis activity in obese humans and rodents remains within the normal levels or slightly higher. Therefore, in this study, we aimed to determine the mechanism(s) by which the HPT axis is still active despite leptin resistance. With a combination of using the Sprague-Dawley rat physiological model and the Zuker rat that bears a mutation in the leptin receptor, we were able to demonstrate that under DIO conditions the HPT axis is regulated at the central level, but only through the direct pathway of leptin action on TRH neurons. Deiodinase enzymes, which are present in many tissues and responsible for converting thyroid hormones, were not statistically different between lean and DIO animals. These data suggest that the increase in T4/3 seen in obese animals is due mostly to central leptin action. We also found that T3 feedback inhibition on the prepro-TRH gene is controlled partially by leptin-induced pSTAT3 signaling via the TRH promoter. This interactive relationship between T3 and pSTAT3 signaling appears essential to maintain the HPT axis at normal levels in conditions such as obesity.
the interaction between TRH and leptin has important implications in the maintenance of the thyroid status during nutritional changes (38). Different from insulin and cortisol, which fluctuate in response to nutritional changes and stress, thyroid hormones are typically maintained at a constant level, keeping the metabolic machinery running at a proper metabolic rate (22, 38, 39a). Thyroid hormones are crucial for survival in both rodents and humans by adjusting its levels from the fed to the starved state. In the case of starvation, a rapid suppression of thyroxine (T4) and triiodothyronine (T3) levels occurs to preserve energy stores. The secretion of T3 and T4 is controlled by a feedback system involving the pituitary gland and hypothalamus that produces hormones that regulate thirst, hunger, body temperature, sleep, mood, and sex drive. When plasma levels of thyroid hormone fall, the biosynthesis and secretion of hypophysiotropic TRH increase, raising the threshold for feedback inhibition by thyroid hormone on anterior pituitary thyrotrophs and thus increasing TSH secretion. Conversely, elevations in plasma concentrations of thyroid hormone suppress the biosynthesis and secretion of TRH, causing a reduced threshold for feedback regulation by thyroid hormone on thyrotrophs, resulting in suppression of TSH secretion, thus leading to a reduced release of thyroid hormones (58). In addition, the levels of thyroid hormones in tissues and circulation are catalyzed by the action of iodothyronine deiodinase enzymes (D1, D2, and D3) (3). Therefore, circulating thyroid hormone levels depend on both the central regulation of the hypothalamic-pituitary-thyroid (HPT) axis by leptin and the activity of deiodinases.
Most obese humans and rodents have high levels of plasma leptin, which neither reduces appetite nor increases energy expenditure (23, 25). This condition of hyperleptinemia is known as leptin resistance. Many aspects of this “leptin-resistant” state are still poorly understood. There is virtually no information regarding leptin resistance in TRH neurons when diet-induced obesity (DIO) is established. We showed earlier that leptin stimulates TRH neurons in the paraventricular nucleus (PVN) of the hypothalamus through two distinct pathways, a direct and an indirect pathway. In the direct pathway, leptin induces STAT3 phosphorylation in TRH neurons. Phospho-STAT3 (pSTAT3) binds to the prepro-TRH promoter and regulates prepro-TRH transcription (24, 29, 40). In the indirect pathway, leptin upregulates proopiomelanocortin (POMC) expression and inhibits neuropeptide Y (NPY) and agouti-related protein (AgRP) expressions (13, 20, 21, 26, 45, 52) in the arcuate nucleus (ARC) of hypothalamus. The POMC-processing product α-melanocyte stimulating hormone (α-MSH) stimulates TRH neurons via the activation of cAMP response element-binding protein intracellular signaling. Leptin administrated centrally to fasted rats activates both direct and indirect pathways of leptin action on TRH neurons (45). Leptin-induced effects on the HPT axis in fasted rats pretreated with a melanocortin antagonist are fully blocked (45), suggesting that leptin action on ARC-derived neuropeptides via the indirect pathway plays the most significant role in regulating TRH neurons in the lean animals. However, the indirect pathway does not function in the obese condition; the ARC becomes leptin resistant when obesity is established by high-fat diet (HFD) (18, 37).
There is evidence suggesting, however, that other brain regions remain sensitive to leptin notwithstanding obesity-induced leptin resistance. For example, leptin-activated pSTAT3 decreases in the ARC but not in other brain nuclei of rats kept on HFD (37). Hyperleptinemia in obese humans and some rodent species is associated with high (upper normal range) circulating thyroid hormone levels compared with normal individuals, suggesting that leptin still functions to activate the HPT axis (14, 15, 51, 54, 57). Furthermore, leptin-deficient (ob/ob) mice are considerably more obese than animals subjected to HFD, supporting the idea that leptin still functions to regulate body weight in the diet-induced obese condition (38). Therefore, using a combination of an in vivo physiological and a genetic rat model of obesity along with in vitro and biochemical analysis, we were able to demonstrate that TRH neurons are receptive to leptin, which is potentially responsible for maintaining the HPT axis at physiological levels in the obese condition.
MATERIALS AND METHODS
Reagents and antibodies.
Recombinant murine leptin was obtained from Dr. E. Parlow (National Institute of Diabetes and Digestive and Kidney Diseases and The National Hormone and Pituitary Program, Torrance, CA). The specific JAK2 inhibitor AG-490 was from Biomol Research Laboratories (Plymouth, PA). Rabbit anti-pSTAT3 (Tyr705) antibody (cat. no. 9145) was from Cell Signaling Technology (Beverly, MA). Goat anti-uncoupling protein 1 (UCP)1 antibody (M-17, cat. no. sc-6529) was from Santa Cruz Biotechnology (Santa Cruz, CA). Guinea pig anti-UCP3 antibody (cat. no. 4093) and rabbit anti-ObRb (cat. no. 4781-L) were from Linco Research (St. Charles, MO). Rabbit anti-thyroid hormone receptor-β2 (TRβ2) antibody (cat. no. 06-540) was from Upstate (Lake Placid, NY). Guinea pig anti-FluoroGold (FG) antibody was from Protos Biotech (New York, NY). Mouse anti-β-actin (C4) antibody (cat. no. sc-47778) was from Santa Cruz Biotechnology. Rabbit anti-TRH, anti-pro-TRH (against prepro-TRH239–255 sequence of pro-TRH), and anti-α-MSH antibodies were developed in our laboratory and fully described earlier (39, 44). Biotinylated goat anti-rabbit and FITC-conjugated goat anti-guinea pig were from Jackson ImmunoResearch Laboratories (West Grove, PA). Fluorescent goat anti-rabbit immunoglobulin conjugated (Alexa fluor 594) and fluorescent goat anti-guinea pig immunoglobulin conjugated (Alexa fluor 488) were from Molecular Probes (Eugene, OR). Goat anti-rabbit antibody-AP conjugate and rabbit anti-goat antibody-AP conjugate were from Bio-Rad Laboratories (Richmond, CA). Normal donkey serum and normal goat serum were obtained from Invitrogen Life Technologies (Carlsbad, CA). FG was from Fluorochrome (Denver, CO). Avidin-biotin complex Vectastain and fluorescence mounting solution were from Vector Laboratories (Burlingame, CA), and diaminobenzidine-developing solution was from Roche (Basel, Switzerland). Most of the reagents were purchased from Sigma-Aldrich (St. Louis, MO), except when indicated.
Animals.
Male Sprague-Dawley and Zucker rats were obtained from Charles River Laboratories (Wilmington, MA). At 22 days of age, they were fed a regular diet (Purina Laboratory Chow no. 5001; Ralston Purina, St. Louis, MO) or a high-fat diet (HFD-Rodent Chow no. D12492; Research Diets, New Brunswick, NJ) for 12 wk. Regular diet provided 3.3 kcal/g of energy (59.9% carbohydrate, 28.0% protein, and 12.1% fat). HFD provided 5.24 kcal/g of energy (20.0% carbohydrate, 20.0% protein, and 60.0% fat). Food and water were available ad libitum unless otherwise indicated. Body weights were measured weekly. To measure food intake, some rats were individually housed. After 12 wk, rats eating HFD had a bimodal distribution of body weight, similar to what we found in mice (18). Approximately 87% of rats fed HFD were significantly heavier than control (lean) rats (see results). This obese group was named DIO and used for experimentation. It is well known that when a population of Sprague-Dawley rats (as well as other rodents) is kept on HFD, some individuals will not become obese; instead, these individuals gain weight and fat at the same rate as their counterparts kept on regular diet. These individuals are referred to as DIO resistant (DIO-R) (33). In the current study, DIO-R was defined as any rat kept on HFD for 12 wk whose body weight was less than the mean + 3 SD of the lean group fed a regular diet. About 13% of rats on HFD were DIO-R and consequently excluded from these experiments. The Institutional Animal Care and Use Committee of Rhode Island Hospital/Brown University approved all the experimental protocols and euthanasia procedures.
In vivo studies.
Initially, lean and DIO animals were euthanized by decapitation in the fed condition; each group contained 10–12 animals. Blood was collected for TSH, T3, T4, and leptin analysis. The PVN were removed from the hypothalamus by surgical dissection and subjected to 1) peptide extraction with 2 N acetic acid supplemented with a protease inhibitor cocktail, which contains 4-(2-aminoethyl)benzenesulfonyl fluoride, pepstatin A, E64, bestatin, leupeptin, and aprotin (cat. no. P8340; Sigma-Aldrich), to measure peptides by specific radio immunoassays (RIAs); 2) protein extraction with RIPA buffer (50 mM Tris·HCl, pH 7.4, 150 mM NaCl, 0.5% sodium deoxycholate, 0.1% SDS, 1% NP-40) supplemented with protease inhibitor cocktail for Western blot analysis; or 3) RNA isolation with TRIzol Reagent (Invitrogen) according to the manufacturer's instructions for real-time PCR analysis. Peptide and protein concentrations were determined by the Bradford assay (Pierce, Rockford, IL). RNA concentration and quality was determined by spectrophotometry. To evaluate the response to fasting, lean and DIO rats were divided into two groups; one group was allowed free access to food, and the other was fasted for 48 h. Animals and samples were processed as indicated above, and each group contained 8–10 animals per groups per treatment. We also evaluated the response to leptin or AG-490 in both groups of rats. To perform these experiments, rats were stereotaxically implanted with an intracerebroventricular (icv) cannula (Plastics One) 10 days before the experiment, as described previously (45). The placement coordinates for the lateral ventricle were anteroposterior: −0.8 mm; lateral: −2.0 mm; and ventral: −4.0 mm. The correct placement of the cannulas was verified by measurement of water intake in response to icv injection of angiotensin II (40 ng/rat). On the day of the experiment, overnight-fasted animals were given 10 μl icv of vehicle [artificial cerebrospinal fluid (aCSF)] alone or containing leptin (3.5 μg/rat). All injections were performed between 9 and 10:30 AM. Animals were euthanized 30 min later by decapitation, and samples were processed for immunohistochemistry. An extra group of fed lean and DIO rats was also used in these studies. Each group contained three to five rats. In the case of inhibition of leptin signaling, animals were given 10 μl icv of vehicle (13% DMSO in aCSF) alone or containing AG-490 (54 nmol/rat) at 6 PM. Animals were euthanized the following morning by decapitation. Each group contained eight to 10 rats per treatment.
To perform immunohistochemistry, rats were treated as described previously (45). Briefly, anesthetized rats were systemically perfused with 4% paraformaldehyde in phosphate buffer. Brains were removed, postfixed for 2 h, and finally cryoprotected in 20% sucrose solution. Brains were frozen and cut in 25-mm-thick coronal sections on a sliding cryostat. To carry out the tracing studies, rats were injected intraperitoneally with the retrogradely transported marker FG (15 mg/kg body wt of 2.5% solution in saline) 48 h before perfusion (34).
Energy expenditure and body basal temperature measurements.
These studies were performed at Charles River Laboratories. Energy expenditure (EE) was evaluated by indirect calorimetry using an Oxymax housing system (Columbus Instruments, Columbus, OH). For this purpose, rats with free access to food and water were individually housed in metabolic cages. Cages were connected to oxygen and carbon dioxide sensors and placed in an incubator, enabling precise temperature control. EE was measured every 6 min during a complete cycle of 24 h. For monitoring the core body temperature, a thermosensitive chip (BioMedic Data Systems, Maywood, NJ) was implanted in the interscapular region under isoflurane anesthesia in both groups of rats. On experimental days, the ambient temperature was 20.5°C. Basal temperature recordings were made using a transponder (IPTT-100; BioMedic Data Systems) communicating with a personal computer for data acquisition. For these experiments, each group contained four rats. Results were expressed per rat per hour. Daily EE was not normalized by body weight given the differences of surface area and body composition between the experimental groups (27).
Gene expression analysis.
Total RNA was treated with DNase I (Roche). cDNA synthesis was generated using random hexamer primers and SuperScript III reverse transcriptase (Invitrogen). Real-time PCRs were done using the SYBR Green PCR Core Reagents and the ABI 7500 Fast Real-Time PCR system (Applied Biosystems, Foster City, CA). Averaged levels of pro-TRH normalized to hypoxanthine phosphoribosyl transferase (hprt1) in each experimental group (n = 6) were compared with similar values obtained from fed control rats to determine relative expression levels (50). Primers sequences were upstream pro-TRH, 5′-GGAGAGGGTGTCTTAATGCCT-3′; downstream pro-TRH, 5′-GGCCTGTTTGACCACAAGTCC-3′; upstream HPRT1, 5′-gcagactttgctttccttgg-3′; and downstream HPRT1, 5′-GTCTGGCCTGTATCCAACACT-3′. All reactions were performed in triplicate in sealed fast optical 96-well reaction plates (Applied Biosystems). Standard curves for pro-TRH, hprt1, and PPII transcript levels were generated using hypothalamic cDNA of lean rat with ABI 7500 Fast System SDS Software version 1.3.1 (Applied Biosystems).
Immunohistochemistry.
Procedure for pSTAT3 was performed as described (29). Briefly, tissues were treated sequentially with 1% NaOH and 1% H2O2 for 20 min, 0.3% glycine for 10 min, and 0.03% SDS for 10 min. Sections were then blocked with normal goat serum and incubated with anti-pSTAT3 antibody (1:1,500) overnight at 4°C. The next day, sections were incubated with biotinylated goat anti-rabbit antibody (1:1,000), followed by avidin-biotin complex solution and brown precipitate development by diaminobenzidine solution. Sections containing the ARC were then mounted. For double pSTAT3/pro-TRH immunostaining, pro-TRH staining was performed consecutively to the pSTAT3 staining. Briefly, pSTAT3-immunostained brain slices were incubated overnight at 4°C with anti-pro-TRH antibody (1:5,000). The next day, sections were incubated with fluorescent goat anti-rabbit Alexa 594 (red) antibody, mounted, and coverslipped in a fluorescence mounting solution containing 4,6-diamidino-2-phenylindole (DAPI). To increase the FG fluorescent signal, triple pSTAT3/pro-TRH/FG immunostaining was performed. FG staining was performed by overnight incubation with anti-FG (1:3,000) antibodies at 4°C, and then visualization was done with goat anti-guinea pig FITC (green) antibodies. Results were visualized using either fluorescence (pro-TRH and FG) or bright-field light (pSTAT3) sources. Fluorescent images and diaminobenzidine images were acquired with a Nikon E800 microscope (Nikon, Melville, NY) and a Spot II digital camera (Diagnostic Instruments, Sterling Heights, MI). Using ImageJ (National Institutes of Health, Springfield, VA) and Adobe Photoshop (Adobe, San Jose, CA), fluorescence and bright-field photographs were combined. TRH immunostaining was confined to the perikarya and dendrites to see the nucleus containing brown label for pSTAT3. FG immunostaining was seen as cytoplasmic granular green staining. Percentage of TRH neurons containing labeled nuclei was determined at medial and posterior level of the PVN (45). TRH neurons with visible DAPI-positive nuclei and TRH neurons with visible pSTAT3-positive nuclei on each side of the third ventricle were counted. The relationship was expressed as a percentage, which represents pSTAT3-positive TRH neurons compared with the total number of TRH neurons observed. Quantitative analysis was performed in three animals per each condition.
RIAs.
Plasma TSH levels were determined using a highly sensitive double-antibody method developed by A. F. Parlow (National Hormone and Pituitary Program; Harbor-UCLA Medical Center, Torrance, CA). Plasma thyroid hormones (total and free) and leptin levels were measured using commercial RIA kits from MP Biomedicals Diagnostic Division (Orangeburg, NY) and Linco Research (St. Charles, MO), respectively. The use of the MP Biomedical free T4 kit in the DIO group was validated using a kit based on equilibrium dialysis technology (data not shown). The sensitivity of the T3 and T4 assays were 25 ng/dl and 1.2 mg/dl, respectively, and the intra- and interassay variabilities were ∼5–7 and 10–11%, respectively. RIAs for TRH and α-MSH were developed in our laboratory, as described previously (39, 46). The tracers were iodinated using the Chloramine T method followed by HPLC purification. The sensitivity of the RIA systems for TRH and α-MSH were 2.0 and 15.0 pg/tube, respectively. The intra- and interassay variabilities were 5–6 and 9–12%, respectively.
Western blot analysis.
For ObRb and TRβ2 analyses, we used 25 μg of PVN-extracted protein of the different animal groups. For UCP1 and UCP3 analyses, we used 40 μg of total protein from brown adipose tissue (BAT) and muscle tissue, respectively. We used 50 μg of total protein from ARC/ median eminence (ME) tissue samples for D3 analysis. Samples were separated on 8% Tris-glycine-SDS-PAGE gels. The Precision Plus Protein standards were used as molecular weight markers (Bio-Rad Laboratories, Richmond, CA). After the electrophoresis, proteins were electroblotted onto PDVF membranes (Millipore Laboratories) for immunodetection and blocked with milk in Tween-Tris-buffered saline (50 mM Tris, 150 mM NaCl, 0.1% Tween 20, pH 7.4). Membranes with PVN samples were probed overnight at 4°C with the anti-ObRb (1:100) or anti-TRβ2 (1:500) antibodies. Membranes with muscle and BAT samples were probed overnight at 4°C with the anti-UCP1 (1:200) or anti-UCP3 (1:100) antibodies, respectively. Membranes with ARC/ME samples were probed overnight at 4°C with the anti-D3 (1:2,000). Membranes were incubated with an alkaline phosphatase-linked secondary antibody (1:2,000) and immunoreactive bands visualized by the Immunostar Assay, as described by the manufacturer (Bio-Rad Laboratories). In all cases, β-actin was used as internal control to normalize Western blot data.
Luciferase and β-galactosidase assays.
This procedure was performed as described previously in detail (26). Briefly, 293T cells were grown in DMEM supplemented with 10% of fetal bovine serum, 100 U/ml penicillin, and 10 μg/ml streptomycin. For the luciferase and β-galactosidase assays, 293T cells were transfected with prepro-TRH-luciferase reporter, β-galactosidase expression vector, and each plasmid (ObRb, STAT3, PKCR2-TRβ2) or the empty expression vector. All transfections were performed with Mammalian Cell Transfection kit (Specialty Media, Phillipsburg, NJ), following the manufacturer's instructions. Twenty-eight hours after transfection, cells were incubated in serum-free Gibco OptiMEM (Invitrogen) and subsequently stimulated overnight with T3 (0, 10, and 100 nM) and/or further stimulation with leptin (0, 1, 10, and 100 nM) for 6 h. After stimulation, cells were lysed in lysis buffer A (25 mM glycylglycine, 15 mM MgSO4, 4 mM EGTA, 1% Triton X-100, and 2 mM dithiothreitol) and assayed for luciferase and β-galactosidase activity. Enzymatic activities were measured using Luminometer (LB 9501; EG & G Berthold, Bad Wildbad, Germany). Luciferase activity was determined using Luciferin (Molecular Probes, Eugene, OR) and β-galactosidase activity using Galacton (Tropix, Bedford, MA) as described by the manufacturers. Data show the relative luciferase activity, and it is the mean of at least three separate experiments performed in triplicate.
Deiodinase activity assays.
Deiodinase activity assays were performed according to Richard et al. (48). Briefly, extracted BAT and liver tissue were homoginized in P100E2D1 and extracted, and ARC tissue was homoginized in P100E2D10. Total protein concentrations were determined using a Bradford assay. D2 activity in BAT and ARC samples was assayed using P100E2D25 and [3′5′-125I]T4 (3,000 counts/min) with 1 mM 6-propyl-2-thiouracil (PTU; Sigma p3755; to block D1 activity) and 1 μm T3 (to block D3 activity) in a total reaction volume of 0.5 ml. D1 activity in liver samples was assayed using P100E2D10 and [3′5′-125I]T4 (3,000 counts/min) in a reaction volume of 0.5 ml. Liver samples were run with and without 1 mM PTU (a D1 inhibitor) to determine D1 activity only. D3 activity was assayed using P100E2D50 and [125I]T3 (3,000 counts/min) in a total reaction volume of 0.5 ml. Samples were incubated at 37°C for 30 min, and reactions were stopped with 0.2 ml ice-cold methanol. Samples were then centrifuged at 3,200 rpm for 30 min, and 0.5 ml of supernatant was removed and counted for radioactivity. All samples were run in the same assay on the same day. Extracted ARC/ME tissue was homoginized in P100E2D10. Total protein concentrations were determined using a Bradford assay.
Statistical analysis.
The results are presented as the mean ± SE. Statistical significance was determined by analysis of variance followed by post hoc Newman-Keuls test. Differences were considered to be significant at P < 0.05. Correlation between plasma leptin and T3 was performed by linear regression analysis using a general linear model. Significant differences between the slopes were investigated by calculating a P value (2-tailed), testing the null hypothesis that the slopes are identical.
RESULTS
The HPT axis in DIO rats responds to changes in leptin levels.
The first question we asked was whether, despite leptin resistance seen in the DIO condition, the HPT axis remains sensitive to leptin. For this purpose, we compared the metabolic changes produced in DIO rats with lean counterparts and whether the HPT axis responded to nutritional changes (variation in leptin levels) in the same fashion as lean animals. Male Sprague-Dawley rats fed for 12 wk on HFD were heavier than lean controls (P < 0.05; Fig. 1A and Table 1), and daily food intake increased in DIO compared with lean rats (P < 0.05; Fig. 1B). Plasma leptin levels were also higher in DIO rats (P < 0.05; Fig. 1C and Table 1). Intracerebroventricular administration of leptin (3.5 μg/rat) decreased the overnight food intake of lean rats (−26.9 ± 3.9%, P < 0.05 vs. vehicle; Fig. 1D) yet failed to affect food intake of DIO rats (−1.7 ± 4.2% vs. vehicle; Fig. 1D). We then determined STAT3 phosphorylation, a specific marker of leptin signaling (28, 45). Leptin-induced activation of pSTAT3 signaling in the ARC of fasted DIO rats (3.5 μg/rat icv) was substantially lower compared with lean rats (P < 0.05; Fig. 1, E and F), consistent with the state of leptin resistance (18). As a result of a diminution of STAT3 signaling in the ARC, α-MSH, a mediator of leptin action on food intake, was also significantly reduced in the ARC of DIO rats (P < 0.05; Fig. 1G). This observation supports the hypothesis of leptin resistance in the ARC as it has been shown by us and other laboratories using the mice model (18, 37).
Fig. 1.
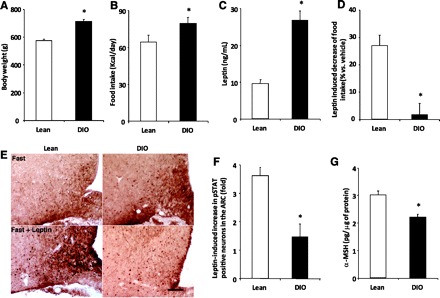
Diet-induced obese (DIO) rats are resistant to the anorexogenic action of leptin. DIO and lean rats were weighed (A), and daily food intake was determined (B) before euthanization. C: serum was obtained for leptin. D: an independent group of animals was vehicle or leptin treated (3.5 μg/rat icv) in the afternoon, and the overnight food intake was determined. E: representative microphotographs of phospho-STAT3 (pSTAT3) staining in the arcuate nucleus (ARC) of fasted lean (left) or DIO (right) rats treated with either vehicle or leptin (3.5 μg/rat icv, 30 min). Scale bars, 50 μm. F: fold stimulation in the number of pSTAT3-positive cells/section in the ARC of lean and DIO rats. G: the hypothalamic ARC was also removed from fed lean and DIO rats, and peptides were extracted for α-MSH RIA. Values are the means ± SE. *P < 0.05 vs. lean group.
Table 1.
HFD alters basal activity of the HPT axis in rats
| Lean | DIO | |
|---|---|---|
| Body weight, g | 574.4 ± 8.1 | 710.5 ± 15.6* |
| Leptin, ng/ml | 9.61 ± 0.99 | 26.74 ± 2.57* |
| α-MSH in ARC, pg/μg | 3.05 ± 0.15 | 2.21 ± 0.11* |
| TRH in PVN, fg/TRH neuron | 146.65 ± 13.2 | 218.2 ± 19.3* |
| TRH mRNA, RU/TRH neuron | 0.49 ± 0.05 | 0.83 ± 0.07* |
| Total T4, μg/dl | 4.77 ± 0.18 | 5.18 ± 0.12* |
| Free T4, ng/dl | 2.32 ± 0.08 | 2.56 ± 0.08* |
| Total T3, ng/dl | 63.2 ± 2.9 | 81.8 ± 2.5* |
| Free T3, pg/ml | 2.31 ± 0.10 | 3.04 ± 0.15* |
| UCP1 (BAT) | 1.4 ± 0.07 | 4.2 ± 1.0* |
| UCP3 (muscle) | 1.1 ± 0.1 | 1.7 ± 0.1* |
| EE, kcal/h | 3.32 ± 0.13 | 4.89 ± 0.19* |
| Body temperature, °C | 35.78 ± 0.10 | 36.63 ± 0.67* |
Data are means ± SE. HFD, high-fat diet; HPT, hypothalamic-pituitary-thyroid; ARC, arcuate nucleus; PVN, paraventricular nucleus; T4, thyroxine; T3, triiodothyronine; UCP1 and -3, uncoupling protein 1 and 3, respectively; EE, energy expenditure. Rats were euthanized by decapitation after eating normal chow or HFD for 12 wk. The mRNAs were quantified by real-time PCR, and values have been normalized to the hypoxanthine phosphoribosyltransferase 1 mRNAs. RIA measured the TRH peptide, and values are expressed as pg/mg protein. Plasma levels were also measured by RIA.
P < 0.05 vs. lean.
To determine whether there was a central activation of the HPT axis by leptin in the DIO group, we measured the propro-TRH gene, one of its translation/processing products, TRH, and the physiological end points of the thyroid axis, T3/4. The data showed an increase in prepro-TRH mRNA and TRH in PVN and TRH in ME as well as a significant increase in plasma T3 and T4 for both total and free hormones compared with lean rats (Table 1). Consistent with the increase in leptin levels in DIO, there was a correlated increase with plasma T3 in both groups of rats (lean group: r = 0.46, n = 28, P < 0.02; DIO group: r = 0.66, n = 31, P < 0.001; Fig. 2A). The slopes of the correlation were not statistically different between the experimental groups.
Fig. 2.
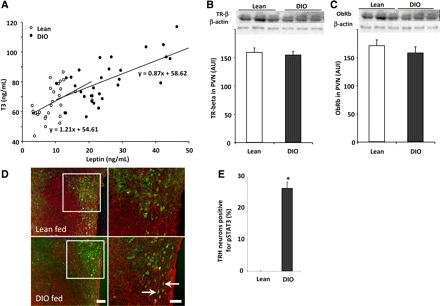
The change in the set point of the hypothalamic-pituitary-thyroid (HPT) axis of DIO rats correlates with plasma leptin and with an increase of pSTAT3 signaling within TRH neurons. A: correlation between serum leptin and serum tiiodothyronine (T3) in lean and DIO rats (r = 0.46 and 0.66 for lean and DIO rats, respectively). Each point represents a measurement from a single animal. B and C: thyroid hormone receptor-β2 (TRβ2) and leptin receptor (ObRb) protein levels were similar in both groups of rats. To perform this, hypothalamic paraventricular nuclei (PVN) were removed from fed lean and DIO rats; proteins were extracted in RIPA lysis buffer, and TRβ2 (60 kDa), ObRb (120 kDa), and β-actin (43 kDa) levels were assayed by Western blot. In addition, brain sections of fed rats were subjected to double immunohistochemistry using anti-pSTAT3 (brown staining) and anti-pro-TRH (red fluorescent staining) antiserum. D: low-magnification images for each individual staining for each group and high-magnification merged images. Arrows point to dual-labeled cells. Scale bars, 50 (low magnification) and 20 μm (high magnification). E: bar graph of the quantitative analysis of the percentage of TRH neurons positive for pSTAT3 in the PVN of fed lean and DIO rats (n = 3 and 5/group). Values are means ± SE. *P < 0.05 vs. lean group.
In rodents, thyroid hormones act synergistically with the sympathetic nervous system to regulate UCP1 expression (5). UCP1 expression relies on functional T3 response elements and cAMP response element-binding protein motifs in the UCP1 gene upstream enhancer region (56). BAT contains abundant type 2 deiodinase (D2), which catalyzes the conversion of T4 to the more biologically active and potent T3 and which is activated by the sympathetic nervous system (56). In addition, D2 was shown to play a role in the conversion of T4 to T3 in the ARC, and hepatic D1 could be affected as well (38). Therefore, we evaluated the possibility that leptin or other metabolic changes seen in the DIO may affect the activity of deiodinases and in turn change the amount of T3 produced independently of the central action of leptin (3). Analysis of deiodinase activity in ARC/ME, BAT, and liver showed no statistical differences between the DIO and lean animals either for D1 and D2 that increase active thyroid hormone levels or for D3 that inactivates thyroid hormones by breaking down T4 and T3 to inactive forms (Fig. 3). The results show that the deiodinase activities are not affected in DIO, which suggests that the increased activity of the HPT axis in the DIO can be attributed only to a central regulation by leptin. In addition, thyroid hormone receptor (TRb2) and leptin receptor (ObRb) protein levels in the PVN were altered (Fig. 2, B and C) in the DIO state.
Fig. 3.
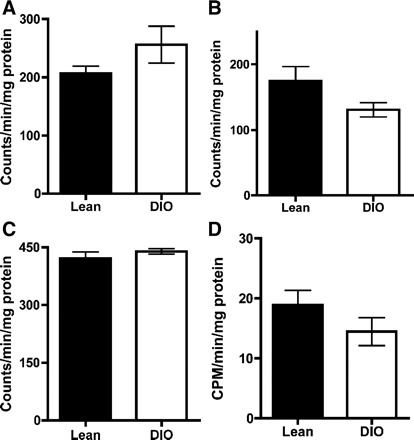
Deiodinase activity does not increase in the DIO. Tissue samples were extracted in P100E2D10 for ARC and P100E2D1 for brown adipose tissue (BAT) and liver, and activity assays were performed an all samples. For D1 activity in liver, samples were run with and without the D1 inhibitor 6-propyl-2-thiouracil (PTU) to determine D1 activity only. Sample sizes were D2 in ARC control: n = 6; DIO: n = 5; D2 in BAT control: n = 8; DIO: n = 10; D1 in liver control: n = 8; DIO: n = 10. Values are means ± SE.
Further supporting the responsiveness of TRH neurons to leptin in DIO, our results showed that whereas the fed lean animals presented low or undetected levels of positive staining for pSTAT3 in TRH neurons, DIO rats showed that 26.2 ± 2.0% of the TRH neurons were positive for pSTAT3 (P < 0.05 vs. %lean animals, Fig. 2, D and E). This enhanced activity of the HPT axis seen in DIO was associated with an increase in basal EE and body basal temperature (55). Total daily EE was higher in DIO rats compared with the controls (P < 0.05; Fig. 4A and Table 1). Basal body temperature (AM) was also higher in DIO rats on 2 of the 3 days recorded (P < 0.05; Fig. 4B and Table 1). Although mitochondrial UCPs have been shown to increase EE and are regulated by thyroid hormones (4, 31), factors other than the HPT axis can affect the UCP levels. However, consistent with the EE data, DIO rats significantly increased UCP1 in BAT (Fig. 4C) and UCP3 in skeletal muscle (Fig. 4D).
Fig. 4.
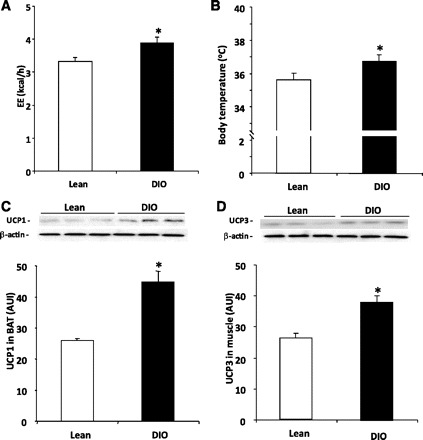
DIO rats have a higher metabolic rate. A and B: DIO rats have increased energy expenditure (EE) and body temperature compared with lean rats. EE was evaluated by indirect calorimetry, and the core body temperature was determined with a thermosensitive chip implanted in the interscapular region of the rats. C and D: DIO rats have higher uncoupling protein (UCP) levels compared with lean rats. To perform this, the interscapular BAT and skeletal muscle from hindlimb were extracted in RIPA lysis buffer, and UCP1 (32 kDa), UCP3 (32 kDa), and β-actin (43 kDa) levels were assayed by Western blot; n = 12/group. Values are means ± SE. The loading control β-actin is shown for all the cases. *P < 0.05 vs. lean group. AUI, arbitrary units of intensity.
Having determined the metabolic parameters that changed in the obese rat and those affected in the HPT axis, we wondered whether under nutritional changes the HPT axis responds in a similar way to the lean animal. Our results indicate that fasting decreased plasma leptin levels in lean and DIO rats, but fasted DIO rats had higher leptin levels (6.4 ± 0.8 ng/ml) than fasted lean rats (2.1 ± 0.2 ng/ml, P < 0.05; Fig. 5A) as a result of the hyperleptinemia developed during the HFD regimen. Fasting also downregulated the HPT axis activity in both groups of rats; prepro-TRH mRNA decreased ∼44%, the TRH peptide levels decreased ∼31% in the PVN of lean rats (P < 0.05), prepro-TRH mRNA decreased ∼33%, and TRH peptide levels decreased ∼23% in the DIO rats (P < 0.05; Fig. 5, B–E). Importantly, whereas fasting significantly decreased the content of α-MSH peptide in the ARC of lean rats (P < 0.05), it failed to affect the content of α-MSH in the ARC of DIO rats (Fig. 5D). In the periphery, fasting decreased TSH and T3 in both rat groups; however, fasted DIO rats had higher plasma T3 levels than fasted lean rats (P < 0.05; Fig. 5F). Altogether, these experiments strongly suggest that the HPT axis in the DIO condition remains responsive to leptin.
Fig. 5.
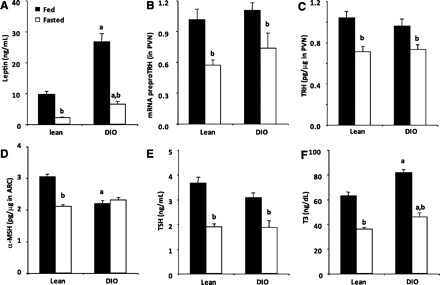
TRH neurons of DIO rats remain sensitive to changes in leptin levels. Fed and fasted (48 h) rats from both experimental groups were euthanized, and brains were removed immediately. Serum was obtained for leptin (C), TSH (G), or T3 (H) RIAs. Hypothalamic PVN were extracted for mRNA prepro-TRH quantification (D) or for TRH RIA (E). Hypothalamic ARCs were extracted for α-MSH RIA (F). Values are means ± SE. For A–H: aP < 0.05 vs. lean group in same condition; bP < 0.05 vs. same group treated with vehicle.
Thyroid hormone levels fail to increase during DIO in rats with inactive leptin receptor.
Having determined the possibility that leptin could regulate TRH neurons despite the leptin resistance in the ARC, we decided to use the Zucker rat model, which is unresponsive to leptin because of a mutation in the leptin receptor gene (9, 47). After 12 wk on HFD, Zucker rats were heavier (499.8 ± 19.6 g) than Zucker rats fed with regular chow (455.0 ± 12.5 g, P < 0.05). However, DIO Zucker rats and Zucker rats fed with regular chow had similar levels of TRH in the PVN, plasma TSH, T3 (P < 0.05; Fig. 6A), and T4 (regular chow 4.63 ± 0.19 vs. HFD 5.12 ± 0.25 μg/dl). Next, we treated Sprague-Dawley lean and DIO rats with AG-490, a specific inhibitor of the enzyme coupled to the leptin receptor that phosphorylates STAT3. Centrally administrated AG-490 strongly decreased the basal level of pSTAT3 in the hypothalamus (Ref. 53 and data not shown). AG-490 also significantly reduced plasma T3 levels of fed DIO rats compared with vehicle-treated fed DIO rats (P < 0.05; Fig. 6B). A similar effect was seen for T4, where T4 levels in response to AG-490 were 3.37 ± 0.20 μg/dl in lean rats and 4.02 ± 0.19 μg/dl in DIO rats. In contrast, this drug slightly reduced plasma T3 levels of fed lean animals (56.20 ± 5.59 and 44.25 ± 5.62 ng/dl in vehicle- and AG-490-treated fed lean rats; data not shown). AG-490 treatment did not affect TRH levels in PVN of any group. Taken together, these results indicate that stimulation of the HPT axis in the obese condition could be fully dependent on central leptin-induced pSTAT3 signaling.
Fig. 6.
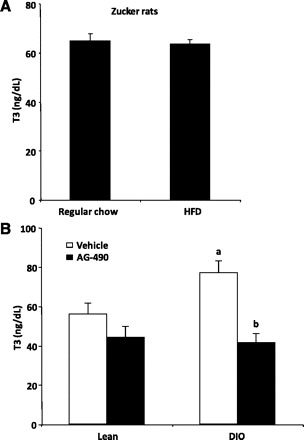
Elevated HPT axis activity in DIO rats depends on the leptin signaling. A: genetically resistant Zucker rats fed high-fat diet (HFD) for 12 wk do not show higher levels of thyroid hormones compared with Zucker rats fed regular chow. B: icv treatment of DIO rats with AG-490, a specific inhibitor of the enzyme coupled to the leptin receptor that phosphorylates STAT3 and fully blocks the increase in T3 levels found in DIO rats.
To further determine whether the response of the HPT axis in the obese condition was leptin related, we measured the changes in STAT3 phosphorylation in the PVN of lean vs. DIO animals (Fig. 7A) after 30 min of icv leptin administration, as previously done in our laboratory (29). Fasted lean rats, as shown by us earlier (29), demonstrate undetectable levels of pSTAT3 staining, whereas 5.1 ± 2.0% of the TRH neurons in fasted DIO rats that still have high levels of leptin (hyperleptinemia) showed positive staining for pSTAT3 (P < 0.05 vs. percentage in DIO fed; Fig. 7B), suggesting that leptin remains active in at least in one subgroup of TRH neurons. Consistent with this observation, there was a substantial decrease in the percentage of TRH neurons positive for pSTAT3 in fasted DIO rats (5.1 ± 2.0%) compared with fed DIO rats (26.2 ± 2.0%), suggesting that the fasting-induced decrease in leptin attenuated the direct activation of TRH neurons in DIO rats. Altogether, these results suggest that leptin may act on TRH neurons in the PVN of DIO independently of the ARC. Quantitative analysis indicated that 43.3 ± 3.4% of parvocellular TRH cells were positive for pSTAT3 in the PVN of leptin-treated lean rats and 42.0 ± 4.5% of TRH cells of DIO rats were positive for pSTAT3 (P < 0.05 vs. basal; Fig. 7B). The leptin-induced increase of pSTAT3 levels in TRH neurons of lean and DIO rats was not statistically different. After 30 min of leptin administration, there was no change in the levels of TRH in PVN or plasma TSH, T3, and T4 (not shown), which is consistent with our previous studies (45). These results suggest that TRH neurons of lean and DIO rats are equally sensitive to the leptin-induced increase in pSTAT3.
Fig. 7.
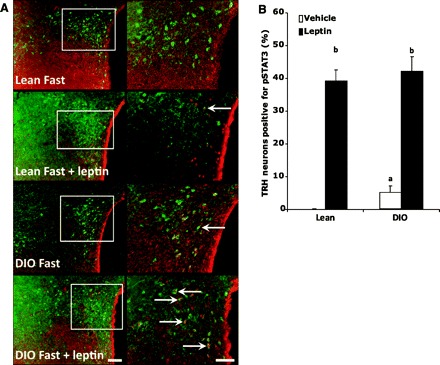
The magnitude of leptin-induced increase of pSTAT3 in TRH neurons is the same in both DIO and lean rats. Brain sections of fasted (48 h) and fasted/leptin-treated (3.5 μg/rat icv 30 min) rats were subjected to double immunohistochemistry using anti-pSTAT3 (brown staining) and anti-pro-TRH (red fluorescent staining) antiserum. A: low-magnification images for each individual staining for each group on the left and high-magnification merged images on the right. Arrows point to dual-labeled cells. Scale bars, 50 (low magnification) and 20 μm (high magnification). B: number of TRH neurons positive for pSTAT3 in lean vs. DIO rats when treated with leptin icv. The statistics were done by counting >50 fields/condition.
Leptin-responsive TRH neurons are hypophysiotropic.
After establishing the fact that phophorylation of STAT3 was detected in TRH neurons of DIO animals and was affected by leptin, the remaining question was whether these neurons are hypophysiotropic. For this purpose, animals were injected intraperitoneally with the retrogradely transported marker FG, which is concentrated by axons that terminate outside of the blood-brain barrier (34). Two days later, rats subjected to feeding, fasting, or fasting plus leptin conditions were perfused, and brain slices were costained with antibodies against pro-TRH, FG, and pSTAT3. Figure 8 depicts a set of representative images of the hypothalamic PVN from animals subjected to triple staining. Green, brown, and red staining represents FG, pSTAT3, and proTRH, respectively. Colocalization of FG, pro-TRH, and pSTAT3 is shown in the merge images in Fig. 8, right, with arrows pointing to triple-labeled cells. Quantitative analysis indicated that 85.7 ± 5.8 and 91.2 ± 3.2% of the TRH neurons that expressed pSTAT3 also expressed FG in leptin-infused lean and DIO rats, respectively (Fig. 8). In fed and fasted DIO rats, all TRH neurons expressing pSTAT3 also expressed FG (not shown). Quantitative analysis also indicated that 69.8 ± 4.3 and 72.6 ± 4.9% of the hypophysiotropic TRH neurons were positive for pSTAT3 in the PVN of leptin-treated lean and DIO rats, respectively (P < 0.05 vs. basal). These data clearly demonstrate that most TRH neurons directly responsive to leptin are hypophysiotropic and that most of the hypophysiotropic TRH neurons increase pSTAT3 in response to leptin in both DIO and lean rats.
Fig. 8.
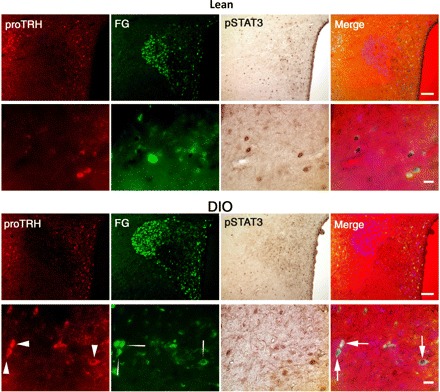
Most TRH neurons directly responsive to leptin are hypophysiotropic. FluoroGold (FG) was injected 48 h before the experiment to identify the hypophysiotropic TRH neurons. Brain sections of fasted DIO and lean rats treated with leptin (3.5 μg/rat icv, 30 min) were subjected to triple immunohistochemistry using anti-FG (green fluorescent staining), anti-pSTAT3 (brown staining), and anti-proTRH (red fluorescent staining) antiserum. For each group, the top and bottom sets of images depict in low and high magnification, respectively, a representative picture of the triple-stained PVN. Colocalization of FG, pro-TRH, and pSTAT3 is shown in the merged images (right). Arrows point to the triple-labeled cells; n = 3/group. Scale bars, 50 (low magnification) and 20 μm (high magnification).
STAT3 signaling partially overrides the T3-induced downregulation of prepro-TRH promoter activity.
The results above show that in the DIO there was an increase in hypophysiotropic prepro-TRH gene expression and an increase in the biosynthesis of the TRH peptide, which resulted in an increase in the physiological end points of the HPT axis, T3/4. Since under the hyperleptinemic condition established in the DIO the TRH neurons seem to be continuously activated by leptin, we wondered whether the T3 feedback mechanism to inhibit TRH was partially prevented by leptin competing with thyroid hormone action on the TRH promoter. To test this paradigm, we determined the competitive effect of leptin and T3 in regulating the prepro-TRH promoter using 293T cells cotransfected with TRb2, ObRb, STAT3, and the human prepro-TRH promoter linked to a luciferase reporter. The human prepro-TRH promoter contains the same regulatory elements for these factors as the rat promoter (26). As shown in Fig. 9, 10 and 100 nM of T3 treatment reduced the prepro-TRH promoter activity in a dose-dependent manner (P < 0.05). This action was specific for TRb2 since it requires the presence of this plasmid (not shown). On the other hand, 1, 10, and 100 nM of leptin treatment increased prepro-TRH promoter activity in a dose-dependent manner (P < 0.05 vs. leptin = 0 nM) in a STAT3-dependent fashion. When transfected cells were treated with leptin and T3 simultaneously, we found that leptin blocked the T3-induced inhibition of prepro-TRH promoter activity. Cells incubated with a constant concentration of leptin (100 nM) and increasing concentrations of T3 revealed a diminution of luciferase activity 56.2 ± 8.1-, 49.7 ± 10.4-, and 39.4 ± 7.5-fold. When expressed as a percentage over the basal levels, 10 and 100 nM T3 reduced the prepro-TRH promoter activity from 82.3 ± 6.5 to 67.0 ± 5.4% (Fig. 9). Taken together, these results demonstrate that the magnitude of T3 inhibition on prepro-TRH promoter activity is dependent upon leptin concentration, suggesting an interactive relationship between T3 levels and pSTAT3 signaling to maintain the HPT axis when this axis is stressed by conditions such obesity.
Fig. 9.
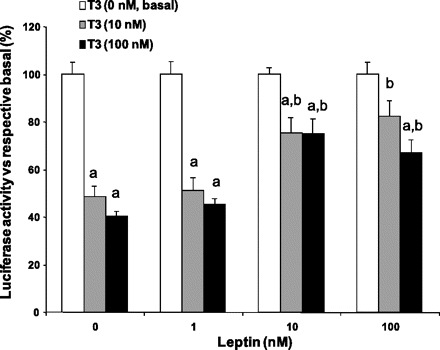
STAT3 signaling alters the negative action of T3 on prepro-TRH gene expression. 293T cells were cotransfected with TRβ2, ObRb, STAT3, β-galactosidase expression vector, and the human prepro-TRH promoter linked to the luciferase reporter. Cells were treated overnight with T3 (10–100 nM) and further treated with leptin (1–100 nM) for 6 h. For each condition, the luciferase activity was normalized to β-galactosidase activity. Results are shown as the relative luciferase activity normalized to each basal activity of the promoter for the different leptin treatments (0, 1, 10, and 100 nM). Results are the mean of 3 separate experiments performed in triplicate. aP < 0.05 vs. 100% luciferase activity (T3 = 0 nM) at the same concentration of leptin; bP < 0.05 vs. normalized luciferase activity at leptin = 0 nM and the same concentration of T3.
DISCUSSION
Although it has been widely accepted that the melanocortin system plays a key role in mediating leptin's actions on food intake and energy balance, several convincing studies have shown that leptin signaling in the brain is not limited to ARC neurons. Earlier work showed that deletion of leptin receptors specifically from POMC neurons in the ARC results in modest obesity, which is much less severe than that observed in the leptin receptor deficient (db/db) mice (2). In addition, ablation of the leptin receptor for both NPY/AgRP and POMC/CART neurons results only in brief hyperphagia not seen at the adult stage (59). On the other hand, mice lacking leptin receptor in the whole central nervous system are obese and hyperphagic throughout all developmental stages (11). In addition, animals with transgenic expression of leptin receptors restricted to the ARC do not fully ameliorate the hyperphagia and obesity seen in db/db mice. Altogether, these collection of data suggest that leptin receptors in other brain nuclei must be critically important in integrating and processing leptin signals (12). Consistent with this paradigm, the leptin receptor with its signaling pathway is widely expressed in the mediobasal hypothalamus and throughout the brain (17). Leptin administration increases neuronal activity within the ventromedial nucleus of the hypothalamus (16). Leptin also acts directly on neurons of the lateral hypothalamus to reduce food intake and body weight (32). As we described earlier, TRH neurons in the PVN also express the active form of the leptin receptor (38).
We had shown previously that leptin regulates the HPT axis by increasing the production of the TRH peptide in the PVN via a direct and an indirect pathway (26, 40) and that pretreatment of fasted rats with a melanocortin antagonist fully blocks the leptin-induced activation of the HPT axis (45), demonstrating in principle that the indirect pathway is necessary for leptin-mediated HPT activity. It is important to note, however, that the activity of both pathways in response to leptin was seen early in the lean condition, but over time the indirect pathway becomes the physiologically relevant pathway (45) as far as icv infusion of fasted rats with leptin is concerned. Different from the lean condition, the indirect pathway is blocked during DIO (Fig. 10). Despite leptin resistance in the ARC, obese humans and rodents have functional, and even enhanced, HPT axis activity. Patients with leptin receptor mutations or leptin deficiency show features of hypothalamic hypothyroidism (10, 36), and leptin treatment increases plasma thyroid hormones in leptin-deficient humans (19). Also, leptin administration reverses the low thyroid hormones in subjects on hypocaloric diets (49). Studies in mice also support the idea that leptin is necessary to maintain the HPT axis during obesity. For example, several studies have reported that ob/ob mice lacking the leptin receptor have low circulating thyroid hormone levels and reduced energy expenditure (6, 42, 43, 60), suggesting that that leptin is required to increase circulating T3. In addition, ob/ob mice are inefficient in their response to cold stress, further indicating a deficiency in HPT axis regulation (19, 41). Based on these observations in humans and mice, one would expect to find high activity of the HPT axis in hyperleptinemic obese subjects. Although this has not been observed consistently, several studies reported that obese individuals have a higher activity of thyroid axis within the normal range (14, 15, 51, 54, 57). Patients with morbid obesity have higher levels of thyroid hormones compared with normal-weight subjects (35). Therefore, it is possible that this model of leptin-induced resetting of the hypothalamic thyrostat may explain the alteration of the thyroid axis found in at least a subpopulation of obese individuals.
Fig. 10.
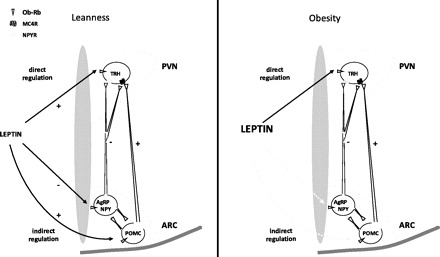
Proposed model of leptin action on hypothalamic TRH neurons in lean vs. obese animals. In lean animals, leptin activates TRH neurons both directly and indirectly via the regulation of proopiomelanocortin (POMC) and neuropeptide Y (NPY)/agouti-related protein (AgRP) neurons in the ARC, and both pathways are active (solid line). In contrast, in the obese condition there is a resistance to leptin at the ARC level (dotted line), but the direct pathway of leptin action remains active. MC4R, melanocortin-4 receptor; NPYR, NPY receptor.
Previous studies have shown that thyroid hormone levels increase during DIO (1, 30). Consistent with these early findings, the current report demonstrates that in DIO rats there is an increase in thyroid hormones as well as an increase in prepro-TRH mRNA, TRH, and pSTAT3 signaling in TRH neurons. The increase of T3 and T4 seen in DIO was associated with an increase in energy expenditure, body temperature, and mitochondrial UCP expression, further supporting the established mechanism of the synergistic relationship between T3 and the sympathetic nervous system to upregulate UCP1 expression (5). These findings may explain why higher thyroid axis activity within the normal range is observed in some obese humans (14, 15, 51, 54, 57) and why morbidly obese patients have higher circulating thyroid hormone levels compared with normal-weight subjects (35).
Here we show that the augmentation of the HPT axis seen in DIO was due mostly to leptin signaling acting centrally. To support this hypothesis, we show that the HPT axis of DIO Sprague-Dawley rats was sensitive to nutritional changes by altering the levels of prepro-TRH mRNA, TRH, and pSTAT3 in the hypothalamus and TSH, T3, and T4 in the circulation, which is consistent with leptin responsiveness in hypothalamic TRH neurons. Further supporting this premise, Zucker rats [rats that genetically lack a leptin response (8, 47)] fed with regular chow or HFD failed to increase T3 levels to the levels observed in normal Sprague-Dawley DIO rats, confirming the need for active leptin signaling. We also provided an additional experiment where AG-490 (a drug that inhibits phosphorylation of STAT3) that was centrally administered to normal Sprague-Dawley rats reduced thyroid hormone levels in DIO animals. Although pSTAT3 is also stimulated by other factors, including prolactin, IL-6, and IFN, the combined physiological and genetic data strongly support our hypothesis.
Analysis of deiodinase activities showed no increase as a result of the DIO condition in several key tissues related to thermogenic activity. Deiodinase enzymes regulate circulating thyroid hormone levels where D2 produces active T3 and D1 can either activate or inactivate T3. In contrast, D3 inactivates T3 and T4 and functions as the primary clearing mechanism for plasma T3 (3). When we measured the activity in ARC/ME, BAT, and liver, no statistical differences between the DIO and lean animals were observed. The results show that the deiodinase activities are not affected in DIO, which suggests that the increased activity of the HPT axis seen in the long-term HFD regime can be attributed only to a central regulation by leptin. A previous study showed that central administration of leptin increased D2 activity in BAT (7), which elevated plasma T3 levels. In contrast, D1 activity in liver, D2 activity in ARC and BAT, and ARC D3 activity were similar in lean and DIO animals. However, this study involved pharmacological manipulations, which are very different from the physiological study reported here. Taken together, our results indicate that deiodinases (at least in the tissues measured in the current study) do not contribute to the increase in thyroid hormones observed in the DIO but instead support the hypothesis of a central activation by leptin through the direct pathway. These novel findings could have important implications for understanding obesity-induced changes in the HPT axis of humans.
Using a neuronal tracing approach, the results reveal that the TRH neurons activated by leptin in the DIO are hypophysiotropic and that these TRH neurons originating from the PVN project their axon terminals to the ME, where TRH is released into the portal vessels and transported to the pituitary to stimulate TSH. In terms of the TRH gene regulation, our in vitro studies showed that leptin and T3 compete for the same promoter site, suggesting that up- and downregulation of the TRH gene by these two factors represent an integrated mechanism of regulation that depends upon nutritional changes. The magnitude of T3 inhibition of prepro-TRH promoter activity decreased with increasing leptin concentrations, suggesting that when leptin, and thus pSTAT3, levels are high (as in the DIO condition), more T3 is necessary to inhibit the prepro-TRH gene expression. A simple mechanism to explain this interaction would implicate either a physical or functional competition between these two factors for binding to the promoter. The integration of the α-MSH-induced p-CREB signaling and the TRb2 signaling occurs in a similar way, where both factors compete to bind to the same sequence of the prepro-TRH promoter (site 4, between the nucleotides −60 and −55), and these factors regulate prepro-TRH gene expression in opposite directions (26). However, pSTAT3 signaling may be different since the main STAT-responsive region localizes between the nucleotides −150 and −125 of the human prepro-TRH promoter (26). Further work is required to discern how pSTAT3 and TRb2 signaling interact on the prepro-TRH promoter to regulate gene expression. Taken together, these studies provide the first evidence that TRH neurons regulated directly by leptin play a significant role in the DIO condition by allowing the HPT axis to continue to function when leptin resistance is established in the ARC. Figure 10 shows a schematic description of leptin activation of TRH neurons in lean and obese animals.
GRANTS
This study was supported by the Dr. George A. Bray Research Scholar's Award Fund to M. Perello, National Institute of Diabetes and Digestive and Kidney Diseases (NIDDK) Grant R01-DK-58148 to E. A. Nillni, and NIDDK Grant RO1 DK-078090 to A. N. Hollenberg.
DISCLOSURES
The authors have nothing to disclose.
ACKNOWLEDGMENTS
We thank Virginia Hovanesian for assistance in the acquisition of the images.
Present address for M. Perello: Laboratory of Neurophysiology, Multidisciplinary Institute of Cell Biology (IMBICE), CONICET/CIC-PBA, 1900 La Plata, Argentina.
REFERENCES
- 1. Almeida NG, Levitsky DA, Strupp B. Enhanced thermogenesis during recovery from diet-induced weight gain in the rat. Am J Physiol Regul Integr Comp Physiol 271: R1380–R1387, 1996 [DOI] [PubMed] [Google Scholar]
- 2. Balthasar N, Coppari R, McMinn J, Liu SM, Lee CE, Tang V, Kenny CD, McGovern RA, Chua SC, Jr, Elmquist JK, Lowell BB. Leptin receptor signaling in POMC neurons is required for normal body weight homeostasis. Neuron 42: 983–991, 2004 [DOI] [PubMed] [Google Scholar]
- 3. Bianco AC, Kim BW. Deiodinases: implications of the local control of thyroid hormone action. J Clin Invest 116: 2571–2579, 2006 [DOI] [PMC free article] [PubMed] [Google Scholar]
- 4. Bianco AC, Maia AL, da Silva WS, Christoffolete MA. Adaptive activation of thyroid hormone and energy expenditure. Biosci Rep 25: 191–208, 2005 [DOI] [PubMed] [Google Scholar]
- 5. Bianco AC, Sheng XY, Silva JE. Triiodothyronine amplifies norepinephrine stimulation of uncoupling protein gene transcription by a mechanism not requiring protein synthesis. J Biol Chem 263: 18168–18175, 1988 [PubMed] [Google Scholar]
- 6. Breslow MJ, Min-Lee K, Brown DR, Chacko VP, Palmer D, Berkowitz DE. Effect of leptin deficiency on metabolic rate in ob/ob mice. Am J Physiol Endocrinol Metab 276: E443–E449, 1999 [DOI] [PubMed] [Google Scholar]
- 7. Cettour-Rose P, Burger AG, Meier CA, Visser TJ, Rohner-Jeanrenaud F. Central stimulatory effect of leptin on T3 production is mediated by brown adipose tissue type II deiodinase. Am J Physiol Endocrinol Metab 283: E980–E987, 2002 [DOI] [PubMed] [Google Scholar]
- 8. Chua SC, Hennessey K, Zeitler P, Leibel RL. The little (lit) mutation cosegregates with the growth hormone releasing factor receptor on mouse chromosome 6. Mamm Genome 4: 555–559, 1993 [DOI] [PubMed] [Google Scholar]
- 9. Chua SC, Jr, Chung WK, Wu-Peng XS, Zhang Y, Liu SM, Tartaglia L, Leibel RL. Phenotypes of mouse diabetes and rat fatty due to mutations in the OB (leptin) receptor. Science 271: 994–996, 1996 [DOI] [PubMed] [Google Scholar]
- 10. Clement K, Vaisse C, Lahlou N, Cabrol S, Pelloux V, Cassuto D, Gourmelen M, Dina C, Chambaz J, Lacorte JM, Basdevant A, Bougneres P, Lebouc Y, Froguel P, Guy-Grand B. A mutation in the human leptin receptor gene causes obesity and pituitary dysfunction. Nature 392: 398–401, 1998 [DOI] [PubMed] [Google Scholar]
- 11. Cohen P, Zhao C, Cai X, Montez JM, Rohani SC, Feinstein P, Mombaerts P, Friedman JM. Selective deletion of leptin receptor in neurons leads to obesity. J Clin Invest 108: 1113–1121, 2001 [DOI] [PMC free article] [PubMed] [Google Scholar]
- 12. Coppari R, Ichinose M, Lee CE, Pullen AE, Kenny CD, McGovern RA, Tang V, Liu SM, Ludwig T, Chua SC, Jr, Lowell BB, Elmquist JK. The hypothalamic arcuate nucleus: a key site for mediating leptin's effects on glucose homeostasis and locomotor activity. Cell Metab 1: 63–72, 2005 [DOI] [PubMed] [Google Scholar]
- 13. Cowley MA, Smart JL, Rubinstein M, Cerdan MG, Diano S, Horvath TL, Cone RD, Low MJ. Leptin activates anorexigenic POMC neurons through a neural network in the arcuate nucleus. Nature 411: 480–484, 2001 [DOI] [PubMed] [Google Scholar]
- 14. Danforth E, Jr, Horton ES, O'Connell M, Sims EA, Burger AG, Ingbar SH, Braverman L, Vagenakis AG. Dietary-induced alterations in thyroid hormone metabolism during overnutrition. J Clin Invest 64: 1336–1347, 1979 [DOI] [PMC free article] [PubMed] [Google Scholar]
- 15. Donders SH, Pieters GF, Heevel JG, Ross HA, Smals AG, Kloppenborg PW. Disparity of thyrotropin (TSH) and prolactin responses to TSH-releasing hormone in obesity. J Clin Endocrinol Metab 61: 56–59, 1985 [DOI] [PubMed] [Google Scholar]
- 16. Elmquist JK, Ahima RS, Maratos-Flier E, Flier JS, Saper CB. Leptin activates neurons in ventrobasal hypothalamus and brainstem. Endocrinology 138: 839–842, 1997 [DOI] [PubMed] [Google Scholar]
- 17. Elmquist JK, Bjørbaek C, Ahima RS, Flier JS, Saper CB. Distributions of leptin receptor mRNA isoforms in the rat brain. J Comp Neurol 395: 535–547, 1998 [PubMed] [Google Scholar]
- 18. Enriori PJ, Evans AE, Sinnayah P, Jobst EE, Tonelli-Lemos L, Billes SK, Glavas MM, Grayson BE, Perello M, Nillni EA, Grove KL, Cowley MA. Diet-induced obesity causes severe but reversible leptin resistance in arcuate melanocortin neurons. Cell Metab 5: 181–194, 2007 [DOI] [PubMed] [Google Scholar]
- 19. Farooqi IS, Matarese G, Lord GM, Keogh JM, Lawrence E, Agwu C, Sanna V, Jebb SA, Perna F, Fontana S, Lechler RI, DePaoli AM, O'Rahilly S. Beneficial effects of leptin on obesity, T cell hyporesponsiveness, and neuroendocrine/metabolic dysfunction of human congenital leptin deficiency. J Clin Invest 110: 1093–1103, 2002 [DOI] [PMC free article] [PubMed] [Google Scholar]
- 20. Fekete C, Mihaly E, Luo LG, Kelly J, Clausen JT, Mao Q, Rand WM, Moss LG, Kuhar M, Emerson CH, Jackson IM, Lechan RM. Association of cocaine- and amphetamine-regulated transcript-immunoreactive elements with thyrotropin-releasing hormone-synthesizing neurons in the hypothalamic paraventricular nucleus and its role in the regulation of the hypothalamic-pituitary-thyroid axis during fasting. J Neurosci 20: 9224–9234, 2000 [DOI] [PMC free article] [PubMed] [Google Scholar]
- 21. Fekete C, Sarkar S, Rand WM, Harney JW, Emerson CH, Bianco AC, Beck-Sickinger A, Lechan RM. Neuropeptide Y1 and Y5 receptors mediate the effects of neuropeptide Y on the hypothalamic-pituitary-thyroid axis. Endocrinology 143: 4513–4519, 2002 [DOI] [PubMed] [Google Scholar]
- 22. Flier JS, Harris M, Hollenberg AN. Leptin, nutrition, and the thyroid: the why, the wherefore, and the wiring. J Clin Invest 105: 859–861, 2000 [DOI] [PMC free article] [PubMed] [Google Scholar]
- 23. Frederich RC, Hamann A, Anderson S, Lollmann B, Lowell BB, Flier JS. Leptin levels reflect body lipid content in mice: evidence for diet-induced resistance to leptin action. Nat Med 1: 1311–1314, 1995 [DOI] [PubMed] [Google Scholar]
- 24. Guo F, Bakal K, Minokoshi Y, Hollenberg AN. Leptin signaling targets the thyrotropin-releasing hormone gene promoter in vivo. Endocrinology 145: 2221–2227, 2004 [DOI] [PubMed] [Google Scholar]
- 25. Hamann A, Matthaei S. Regulation of energy balance by leptin. Exp Clin Endocrinol Diabetes 104: 293–300, 1996 [DOI] [PubMed] [Google Scholar]
- 26. Harris M, Aschkenasi C, Elias CF, Chandrankunnel A, Nillni EA, Bjøorbaek C, Elmquist JK, Flier JS, Hollenberg AN. Transcriptional regulation of the thyrotropin-releasing hormone gene by leptin and melanocortin signaling. J Clin Invest 107: 111–120, 2001 [DOI] [PMC free article] [PubMed] [Google Scholar]
- 27. Himms-Hagen J. On raising energy expenditure in ob/ob mice. Science 276: 1132–1133, 1997 [DOI] [PubMed] [Google Scholar]
- 28. Hubschle T, Thom E, Watson A, Roth J, Klaus S, Meyerhof W. Leptin-induced nuclear translocation of STAT3 immunoreactivity in hypothalamic nuclei involved in body weight regulation. J Neurosci 21: 2413–2424, 2001 [DOI] [PMC free article] [PubMed] [Google Scholar]
- 29. Huo L, Münzberg H, Nillni EA, Bjørbaek C. Role of signal transducer and activator of transcription 3 in regulation of hypothalamic trh gene expression by leptin. Endocrinology 145: 2516–2523, 2004 [DOI] [PubMed] [Google Scholar]
- 30. Iossa S, Lionetti L, Mollica MP, Crescenzo R, Barletta A, Liverini G. Effect of long-term high-fat feeding on energy balance and liver oxidative activity in rats. Br J Nutr 84: 377–385, 2000 [PubMed] [Google Scholar]
- 31. Lanni A, Moreno M, Lombardi A, de Lange P, Silvestri E, Ragni M, Farina P, Baccari GC, Fallahi P, Antonelli A, Goglia F. 3,5-diiodo-l-thyronine powerfully reduces adiposity in rats by increasing the burning of fats. FASEB J 19: 1552–1554, 2005 [DOI] [PubMed] [Google Scholar]
- 32. Leinninger GM, Jo YH, Leshan RL, Louis GW, Yang H, Barrera JG, Wilson H, Opland DM, Faouzi MA, Gong Y, Jones JC, Rhodes CJ, Chua S, Jr, Diano S, Horvath TL, Seeley RJ, Becker JB, Münzberg H, Myers MG., Jr Leptin acts via leptin receptor-expressing lateral hypothalamic neurons to modulate the mesolimbic dopamine system and suppress feeding. Cell Metab 10: 89–98, 2009 [DOI] [PMC free article] [PubMed] [Google Scholar]
- 33. Levin BE, Dunn-Meynell AA, Balkan B, Keesey RE. Selective breeding for diet-induced obesity and resistance in Sprague-Dawley rats. Am J Physiol Regul Integr Comp Physiol 273: R725–R730, 1997 [DOI] [PubMed] [Google Scholar]
- 34. Merchenthaler I, Liposits Z. Mapping of thyrotropin-releasing hormone (TRH) neuronal systems of rat forebrain projecting to the median eminence and the OVLT. Immunocytochemistry combined with retrograde labeling at the light and electron microscopic levels. Acta Biol Hung 45: 361–374, 1994 [PubMed] [Google Scholar]
- 35. Michalaki MA, Vagenakis AG, Leonardou AS, Argentou MN, Habeos IG, Makri MG, Psyrogiannis AI, Kalfarentzos FE, Kyriazopoulou VE. Thyroid function in humans with morbid obesity. Thyroid 16: 73–78, 2006 [DOI] [PubMed] [Google Scholar]
- 36. Montague CT, Farooqi IS, Whitehead JP, Soos MA, Rau H, Wareham NJ, Sewter CP, Digby JE, Mohammed SN, Hurst JA, Cheetham CH, Earley AR, Barnett AH, Prins JB, O'Rahilly S. Congenital leptin deficiency is associated with severe early-onset obesity in humans. Nature 387: 903–908, 1997 [DOI] [PubMed] [Google Scholar]
- 37. Münzberg H, Flier JS, Bjørbaek C. Region-specific leptin resistance within the hypothalamus of diet-induced obese mice. Endocrinology 145: 4880–4889, 2004 [DOI] [PubMed] [Google Scholar]
- 38. Nillni EA. Regulation of the hypothalamic thyrotropin releasing hormone (TRH) neuron by neuronal and peripheral inputs. Front Neuroendocrinol 31: 134–156, 2010 [DOI] [PMC free article] [PubMed] [Google Scholar]
- 39. Nillni EA, Friedman TC, Todd RB, Birch NP, Loh YP, Jackson IM. Pro-thyrotropin-releasing hormone processing by recombinant PC1. J Neurochem 65: 2462–2472, 1995 [DOI] [PubMed] [Google Scholar]
- 39a. Nillni EA, Sevarino KA. The biology of pro-thyrotropin-releasing hormone-derived peptides. Endocr Rev 20: 599–648, 1999 [DOI] [PubMed] [Google Scholar]
- 40. Nillni EA, Vaslet C, Harris M, Hollenberg A, Bjørbak C, Flier JS. Leptin regulates prothyrotropin-releasing hormone biosynthesis. Evidence for direct and indirect pathways. J Biol Chem 275: 36124–36133, 2000 [DOI] [PubMed] [Google Scholar]
- 41. O'Rahilly S, Farooqi IS, Yeo GS, Challis BG. Minireview: human obesity—lessons from monogenic disorders. Endocrinology 144: 3757–3764, 2003 [DOI] [PubMed] [Google Scholar]
- 42. Oh SS, Kaplan ML. Early treatment of obese (ob/ob) mice with triiodothyronine increases oxygen consumption and temperature and decreases body fat content. Proc Soc Exp Biol Med 207: 260–267, 1994 [DOI] [PubMed] [Google Scholar]
- 43. Pelleymounter MA, Cullen MJ, Baker MB, Hecht R, Winters D, Boone T, Collins F. Effects of the obese gene product on body weight regulation in ob/ob mice. Science 269: 540–543, 1995 [DOI] [PubMed] [Google Scholar]
- 44. Perello M, Stuart RC, Nillni EA. Differential effects of fasting and leptin on proopiomelanocortin peptides in the arcuate nucleus and in the nucleus of the solitary tract. Am J Physiol Endocrinol Metab 292: E1348–E1357, 2007 [DOI] [PubMed] [Google Scholar]
- 45. Perello M, Stuart RC, Nillni EA. The role of intracerebroventricular administration of leptin in the stimulation of prothyrotropin releasing hormone neurons in the hypothalamic paraventricular nucleus. Endocrinology 147: 3296–3306, 2006 [DOI] [PubMed] [Google Scholar]
- 46. Perello M, Stuart RC, Vaslet CA, Nillni EA. Cold exposure increases the biosynthesis and proteolytic processing of prothyrotropin-releasing hormone in the hypothalamic paraventricular nucleus via beta-adrenoreceptors. Endocrinology 148: 4952–4964, 2007 [DOI] [PubMed] [Google Scholar]
- 47. Phillips MS, Liu Q, Hammond HA, Dugan V, Hey PJ, Caskey CJ, Hess JF. Leptin receptor missense mutation in the fatty Zucker rat. Nat Genet 13: 18–19, 1996 [DOI] [PubMed] [Google Scholar]
- 48. Richard K, Hume R, Kaptein E, Sanders JP, van Toor H, De Herder WW, den Hollander JC, Krenning EP, Visser TJ. Ontogeny of iodothyronine deiodinases in human liver. J Clin Endocrinol Metab 83: 2868–2874, 1998 [DOI] [PubMed] [Google Scholar]
- 49. Rosenbaum M, Murphy EM, Heymsfield SB, Matthews DE, Leibel RL. Low dose leptin administration reverses effects of sustained weight-reduction on energy expenditure and circulating concentrations of thyroid hormones. J Clin Endocrinol Metab 87: 2391–2394, 2002 [DOI] [PubMed] [Google Scholar]
- 50. Rozen S, Skaletsky H. Primer3 on the WWW for general users and for biologist programmers. Methods Mol Biol 132: 365–386, 2000 [DOI] [PubMed] [Google Scholar]
- 51. Sari R, Balci MK, Altunbas H, Karayalcin U. The effect of body weight and weight loss on thyroid volume and function in obese women. Clin Endocrinol (Oxf) 59: 258–262, 2003 [DOI] [PubMed] [Google Scholar]
- 52. Sarkar S, Legradi G, Lechan RM. Intracerebroventricular administration of alpha-melanocyte stimulating hormone increases phosphorylation of CREB in TRH- and CRH-producing neurons of the hypothalamic paraventricular nucleus. Brain Res 945: 50–59, 2002 [DOI] [PubMed] [Google Scholar]
- 53. Satriotomo I, Bowen KK, Vemuganti R. JAK2 and STAT3 activation contributes to neuronal damage following transient focal cerebral ischemia. J Neurochem 98: 1353–1368, 2006 [DOI] [PubMed] [Google Scholar]
- 54. Scriba PC, Bauer M, Emmert D, Fateh-Moghadam A, Hofmann GG, Horn K, Pickardt CR. Effects of obesity, total fasting and re-alimentation on l-thyroxine (T4), 3,5,3′-l-triiodothyronine (T3), 3,3′,5′-l-triiodothyronine (rT3), thyroxine binding globulin (TBG), cortisol, thyrotrophin, cortisol binding globulin (CBG), transferrin, alpha 2-haptoglobin and complement C′3 in serum. Acta Endocrinol (Copenh) 91: 629–643, 1979 [DOI] [PubMed] [Google Scholar]
- 55. Silva JE. Thermogenic mechanisms and their hormonal regulation. Physiol Rev 86: 435–464, 2006 [DOI] [PubMed] [Google Scholar]
- 56. Silva JE. Thyroid hormone and the energetic cost of keeping body temperature. Biosci Rep 25: 129–148, 2005 [DOI] [PubMed] [Google Scholar]
- 57. Strata A, Ugolotti G, Contini C, Magnati G, Pugnoli C, Tirelli F, Zuliani U. Thyroid and obesity: survey of some function tests in a large obese population. Int J Obes 2: 333–340, 1978 [PubMed] [Google Scholar]
- 58. Toni R, Lechan RM. Neuroendocrine regulation of thyrotropin-releasing hormone (TRH) in the tuberoinfundibular system. J Endocrinol Invest 16: 715–753, 1993 [DOI] [PubMed] [Google Scholar]
- 59. van de Wall E, Leshan R, Xu AW, Balthasar N, Coppari R, Liu SM, Jo YH, MacKenzie RG, Allison DB, Dun NJ, Elmquist J, Lowell BB, Barsh GS, de Luca C, Myers MG, Jr, Schwartz GJ, Chua SC., Jr Collective and individual functions of leptin receptor modulated neurons controlling metabolism and ingestion. Endocrinology 149: 1773–1785, 2008 [DOI] [PMC free article] [PubMed] [Google Scholar]
- 60. York DA, Otto W, Taylor TG. Thyroid status of obese (ob/ob) mice and its relationship to adipose tissue metabolism. Comp Biochem Physiol B 59: 59–65, 1978 [DOI] [PubMed] [Google Scholar]