Abstract
Adipose tissue macrophages are associated with insulin resistance and are linked to changes in the extracellular matrix. To better characterize adipose macrophages, the extracellular matrix, and adipocyte-macrophage interactions, gene expression from adipose tissue and the stromal vascular fraction was assessed for markers of inflammation and fibrosis, and macrophages from obese and lean subjects were counted and characterized immunohistochemically. Coculture experiments examined the effects of adipocyte-macrophage interaction. Collagen VI gene expression was associated with insulin sensitivity and CD68 (r = −0.56 and 0.60, P < 0.0001) and with other markers of inflammation and fibrosis. Compared with adipose tissue from lean subjects, adipose tissue from obese subjects contained increased areas of fibrosis, which correlated inversely with insulin sensitivity (r = −0.58, P < 0.02) and positively with macrophage number (r = 0.70, P < 0.01). Although macrophages in crownlike structures (CLS) were more abundant in obese adipose tissue, the majority of macrophages were associated with fibrosis and were not organized in CLS. Macrophages in CLS were predominantly M1, but most other macrophages, particularly those in fibrotic areas, were M2 and also expressed CD150, a marker of M2c macrophages. Coculture of THP-1 macrophages with adipocytes promoted the M2 phenotype, with a lower level of IL-1 expression and a higher ratio of IL-10 to IL-12. Transforming growth factor-β (TGF-β) was more abundant in M2 macrophages and was further increased by coculture with adipocytes. Downstream effectors of TGF-β, such as plasminogen activator inhibitor-1, collagen VI, and phosphorylated Smad, were increased in macrophages and adipocytes. Thus adipose tissue of insulin-resistant humans demonstrated increased fibrosis, M2 macrophage abundance, and TGF-β activity.
Keywords: alternatively activated macrophages, inflammation, crownlike structures
many secretory products of adipose tissue have been implicated in the pathogenesis of chronic inflammation, which accompanies obesity and insulin resistance. Although some secretory products are derived from the adipocyte, many proinflammatory cytokines, such as TNF-α, are secreted by resident macrophages, which are more prevalent in adipose tissue of obese rodents and humans (7, 29, 31). Macrophages may infiltrate adipose tissue as a result of adipocyte-derived chemokines. Adipocytes express low levels of macrophage chemoattractant protein-1 (MCP-1), and expression is increased in obese subjects (7). Alternatively, macrophages may infiltrate adipose tissue as part of a scavenger function in response to hypoxia (32) and adipocyte necrosis. Immunohistological studies of adipose tissue have demonstrated a syncytium of macrophages surrounding dead adipocytes, often referred to as a “crownlike structure” (CLS) (5).
Recent studies have identified closer links between adipose tissue inflammation and the extracellular matrix (ECM). When the collagen VI knockout (KO) mouse was bred onto the ob/ob background, adipocytes of collagen VI KO ob/ob mice were larger than adipocytes of ob/ob mice. Blood glucose was normalized, along with other elements of the metabolic profile, suggesting that collagen VI and, perhaps, other elements of the ECM restrict adipocyte expansion during obesity (14). Some human studies have been performed, and an elevated expression of collagen VI, along with significant associations between collagen VI and macrophage number, was found in obese subjects (20).
Several studies have used different methods to characterize adipose macrophages as either classically activated (M1) or alternatively activated (M2). Adipose tissue macrophages in lean mice phenotypically resemble the alternatively activated, anti-inflammatory M2 type, and diet-induced obesity shifted the macrophages to a more proinflammatory state (16). A study in humans also found more CD40-positive (M1) macrophages with obesity and a decrease in these cells following weight loss (1). Other studies, however, used flow cytometry to analyze adipose tissue macrophages from obese subjects and found a complex phenotype, with high expression of M2 markers, but also proinflammatory mediators (4, 33). Alternatively activated macrophages typically express lower levels of inflammatory cytokines and higher levels of transforming growth factor (TGF)-β, which tend to promote collagen expression and fibrosis.
This study was intended to better understand adipose tissue inflammation, ECM formation, and the development of fibrosis. In obese adipose tissue, broad areas of fibrosis were found; these areas contained many macrophages, most of which were alternatively activated, expressing high levels of TGF-β and promoting fibrosis. In addition, the coculture of macrophages with adipocytes caused the macrophages to take on a more M2-like phenotype, which would be expected to promote fibrosis. These data suggest that inflammation and fibrosis go hand-in-hand in adipose tissue and are highly associated with alternatively activated macrophages.
METHODS
Human subjects.
Subcutaneous abdominal adipose tissue was obtained by incisional biopsy from subjects found through local advertisement. All subjects signed consent forms to participate in the study, which was approved by the University of Arkansas for Medical Sciences Institutional Review Board. Subjects were in good health: they were not taking anti-inflammatory medications, angiotensin-converting enzyme inhibitors, angiotensin II receptor blockers, or other medications likely to change adipocyte or lipid metabolism; they had no history of coronary artery disease and were nondiabetic, as determined by a 75-g oral glucose tolerance test. Among the total of 99 subjects studied (85 women and 14 men, 21–61 yr old), 25 had impaired glucose tolerance. The study group covered a wide range of body mass index (BMI, 19–40 kg/m2) and insulin sensitivity [SI, 0.61–13.6 × 10⁻⁴ min−1·(μU·ml−1)−1].
SI measurement.
Peripheral SI was measured by an insulin-modified frequently sampled intravenous glucose tolerance test using 11.4 g/m2 glucose and 0.04 U/kg insulin, followed by minimal model analysis (2, 3). Plasma insulin levels were measured using a chemiluminescent assay (Molecular Light Technology Research, Cardiff, Wales, UK), and plasma glucose was determined by a glucose oxidase assay.
Adipose tissue fractions and cells.
Adipocyte and stromal vascular fractions (SVF) were isolated from fresh adipose tissue biopsy specimens by centrifugation after collagenase digestion, as described previously (7).
RNA isolation and real-time RT-PCR.
Total RNA from human adipose tissue was isolated using an RNeasy Lipid Tissue Mini kit (Qiagen, Valencia, CA) and via cell culture using an Ultraspec RNA Isolation System kit (Biotex, Houston, TX). Real-time RT-PCR was performed as described previously (7), and the primer sequences of 18S, MCP-1, and CD68 were published previously (7). The other primer sequences are as follows: ACTCAGAGGGACACCAGACC (forward) and GAGCCTGGGATGAAGTCAAA (reverse) for collagen VI type α1, GGGAGAACCTGAAGACCCTCA (forward) and TGCTCTTGTTTTCACAGGGAAG (reverse) for IL-10, AACTTGCAGCTGAAGCCATT (forward) and AGGGTACTCCCAGCTGACCT (reverse) for IL-12, GGTGGAGAGAGCCAGATTCA (forward) and GCTCCTTTCCCAAGCAAGTT (reverse) for plasminogen activator inhibitor-1 (PAI-1), GCTTGGTGATGTCTGGTCCAT (forward) and CACCACTTGTTGCTCCATATCCT (reverse) for IL-1, and CCCGGACAGGGTCTACATC (forward) and GAGTTGTTCCAGCCCACATT (reverse) for migration inhibitory factor (MIF).
Histochemistry and immunohistochemistry.
Adipose tissue samples were placed in Bouin's fixative, embedded in paraffin, and subsequently cut into 5-μm-thick sections. Slides were prepared for histochemistry or immunohistochemistry by incubation through a xylene-alcohol series to dewax and hydrate the samples. For determination of total collagen, adipose tissue samples were stained with Masson's trichrome (Trichrome Stain Kit, catalog no. HT15; Sigma, St. Louis, MO). After the samples were stained, slides were dehydrated and mounted in Cytoseal (catalog no. 8312-4, Richard-Allan Scientific).
Macrophages were identified using a 1:40 dilution of anti-CD68 (clone KP1, Dako) on slides that had been treated with 10 mM citrate for heat-mediated antigen retrieval. After anti-CD68 antibody incubation, slides were developed with the anti-mouse ImmPress horseradish peroxidase kit (catalog no. MB-7402, Vector Laboratories) and ImmPact diaminobenzidine (catalog no. SK-4105, Vector Laboratories). Collagen VI was detected using a 2.5 μg/ml dilution of rabbit biotinylated anti-human collagen VI (catalog no. C7510-61Z, US Biological). Collagen VI staining was developed following incubation with a 1:400 dilution of streptavidin-conjugated alkaline phosphatase (catalog no. SA-5100, Vector Laboratories) and BCIP/NBT substrate incubation (catalog no. SK-5400, Vector Laboratories). Slides were then dehydrated and mounted in Cytoseal. Histochemistry was performed on 16 of the above-described 99 subjects; these 16 subjects included 8 obese insulin-resistant subjects and 8 leaner more insulin-sensitive subjects (see Table 2).
Table 2.
Characteristics of insulin-sensitive and -resistant subjects
| Lean, Insulin-Sensitive | Obese, Insulin-Resistant | |
|---|---|---|
| Age, yr | 40 ± 4 | 46 ± 3 |
| BMI | 22.6 ± 0.67 | 34.9 ± 1.2* |
| SI, =10−4 min−1·(μU·ml)−1 | 7.02 ± 1.39 | 2.24 ± 0.38* |
| Fibrosis, %area occupied by fibrosis | 14.0 ± 2.2 | 31.1 ± 4.7* |
| Collagen VI, %area occupied by collagen VI | 8.1 ± 2.2 | 23.0 ± 4.1* |
| Macs, no. CD68-positive cells/mm2 | 17 ± 2.2 | 34 ± 5.8* |
| CLS, no./mm2 | 1.341 ± 0.35 | 3.47 ± 0.55* |
| Macs, no. CD68-positive cells/mm2 | ||
| Within fibrosis | 14.42 ± 14.36 | 20.9 ± 2.3* |
| Outside fibrosis | 2.85 ± 5.01† | 12.2 ± 2.1*† |
| Adipocyte size, μm2 | ||
| Within fibrosis | 2,482 ± 348 | 4,424 ± 547* |
| Outside fibrosis | 8,040 ± 1,135† | 12,859 ± 1,342*† |
Values are means ± SE (n = 8). Macs, macrophages; CLS, crownlike structure.
P < 0.05 vs. lean;
P < 0.05 vs. within fibrosis.
Immunofluorescence.
Adipose tissue slides were prepared as described above, and endogenous peroxidase activity was quenched by incubation of slides in 1% H2O2 in 1× Tris-buffered saline (TBS) for 1 h at room temperature. Slides were blocked for 30 min in normal horse serum (catalog no. S-2000, Vector Laboratories) and incubated with 10 mM citrate (pH 6.0) for 1 h at 95°C. CD68 was detected by incubation with a 1:40 dilution of anti-CD68 antibody (clone KP1, Dako) for 1 h at room temperature. Sections were then rinsed three times in 1× TBS and incubated with anti-mouse horseradish peroxidase from the ImmPress kit (catalog no. MB-7402, Vector Laboratories), and fluorescent color was developed using the Alexa Fluor 350 tyramide signal amplification kit (Invitrogen, Grand Island, NY). The tissue sections were blocked after each staining procedure, then other antigens were detected. Macrophage mannose receptor, also known as CD206, was used to detect M2 macrophages (1, 18, 25). Goat anti-CD206 (catalog no. AF2534, R & D Systems) was used at 10 μg/ml. M1 macrophages were detected using anti-CD86 (catalog no. SC-28347, Santa Cruz Biotechnology) at a 1:50 dilution (18, 28). The M2c or deactivated macrophage phenotype was detected using 10 mg/ml anti-Slam (CD150; catalog no. 306302, Biolegend) (8, 18, 27). Autofluorescence was reduced by incubation of sections first in an acid solution and then in Sudan Black B. Sections were incubated in 0.2% phosphomolybdic acid, 1% picric acid, and 0.01 N HCl for 5 min, rinsed with 1× TBS and 70% ethanol, and placed in a 1% Sudan Black B (catalog no. SU121, Spectrum)-70% ethanol solution for 30 min. Slides were then washed once in 70% ethanol and three times in 1× TBS. Stained sections were immediately mounted in antifade reagent (catalog no. 17984-10, Electron Microscopy) and observed after the antifade reagent was allowed to cure overnight.
To determine the activation status of macrophages, fluorescently labeled slides were triple-stained for CD68, CD86, and CD206 and photographed at ×400 magnification on a Zeiss Axio Imager microscope. All images were captured with Zeiss AxioVision software using the automated multicapture routine to capture the three Alexa Fluor-labeled fluorescent channels and the bright-field image. Images were totaled by identification of CD68-positive macrophages followed by overlay of the CD86 or CD206 image for activation state quantification. CD40, also called TNF receptor superfamily member 5, was used as an alternate marker to confirm CD86 staining of M1-activated macrophages (1, 12), and anti-Slam (CD150) was used to identify a subtype of M2-activated macrophages, termed M2c or wound-healing macrophages (18).
Quantitation of images.
Bright-field images of adipose tissues, double-stained with CD68 and collagen VI, were obtained on a Nikon Eclipse TI microscope at ×40 magnification. Nikon NIS Elements stitching routine was used to create large-format images that covered the entire section of adipose tissue. Images were analyzed with National Institutes of Health ImageJ software. For each image, the individual staining pattern of CD68 and collagen VI was generated through the use of ImageJ's color deconvolution routines according to previously described methods (23). To calculate the percent collagen VI, automatic thresholding was used to identify collagen VI staining from the color-isolated image described above. The area of the collagen VI footprint was expressed as percentage of the total area measured. Total fibrosis was determined from the same large-format images by conversion to gray scale. The fibrotic footprint could easily be separated from the rest of the image by using consistent threshold setting within ImageJ. The amount of fibrosis in each subject was expressed as percentage of the threshold area to the total area of the section.
The average adipocyte size was determined by measurement of the cross-sectional area of adipocytes on ×100 bright-field images. The analysis was done with the measurement tool within the ImageJ analysis package. An adipocyte was considered to be in a fibrotic area if it was within two cell diameters of fibrosis. Otherwise, the cells were considered free of fibrosis and said to be nonfibrotic areas.
Analysis of CD68 cells in the large-format images was used to determine several parameters of CD68 characteristics, including the number of CLS. To measure the number of CD68-positive cells, a counting routine was developed with the particle analysis feature of ImageJ. The routine's accuracy was verified by hand-counting CD68-positive cells from random locations of the ×40 image on a ×100 image of the same subject. The total number of CD68-positive cells was expressed as the number of cells per square millimeter. To identify the location of CD68-positive cells, the number of cells near fibrotic structures was determined. A CD68-positive macrophage was considered near a fibrotic area if it was within two adipocyte cell diameters of a fibrotic area. Otherwise, cells were counted as being in nonfibrotic areas. CLS were identified as an adipocyte with one-half of its perimeter surrounded by CD68-positive cells.
Coculture experiments.
To better define the interactions between macrophages and adipocytes, we performed coculture experiments between THP-1 macrophages and adipocytes, with adipocytes on the inserts, THP-1 macrophages on the plate, and both cells sharing the same medium. Adipocytes were obtained by the induction of differentiation of adult-derived human adipocyte stem cells (ADHASC), as described previously (22). Briefly, preadipocytes were obtained by collagenase digestion and were plated on polyester membrane inserts with 0.4-μm pore size and pore density of 4 × 10⁶/cm2 for six-well culture dishes (Corning) and grown to confluence. Differentiation was induced 2 days after confluence using differentiation medium [1:1 (vol/vol) DMEM-Ham's F-10, 3% FBS (Invitrogen), 15 mM HEPES (pH 7.4; Invitrogen), 33 μM biotin (Sigma), 17 μM pantothenate (Sigma), 1 μM dexamethasone (Sigma), 0.25 mM IBMX (Sigma), 1 × 10⁻⁷ M insulin (Novo Nordisk, Clayton, NC), and 1 μM rosiglitazone (SmithKline Beecham, Philadelphia, PA)] for 3 days. The cells were adherent to the inserts and maintained in adipocyte medium for 10–14 days until they were ≥60% differentiated, as determined using Oil Red O staining.
THP-1 cells, a human myelomonocytic cell line (American Type Culture Collection, Manassas, VA), were maintained in RPMI medium (Invitrogen) with 10% FBS and 1% penicillin-streptomycin. The differentiation of THP-1 cells into M1, M2a, and M2c macrophages generally followed previous methods (17, 33), and the THP-1 monocytes were plated at 6 × 10⁶ cells per six-well plate. For M1 macrophage differentiation, cells were washed with PBS and grown in macrophage serum-free medium (Invitrogen) with 20 ng/ml LPS (Gentaur Molecular, Burlingame, CA) and 20 ng/ml IFN-γ (Gentaur) overnight. For M2a and M2c macrophage differentiation, cells were treated with 5 nM TPA (Sigma) in PBS for 5 min to induce differentiation and then seeded in macrophage serum-free medium with 1% penicillin-streptomycin and 20 ng/ml IL-4 (for M2a) or IL-10 (for M2c) overnight. All cells were adherent to the plastic.
The coculture was set up when ADHASC were ≥60% differentiated, and undifferentiated ADHASC were used as control. The adipocytes and THP-1 macrophages were separated by 0.9 mm (membrane to bottom of well) in the same well but free to exchange medium. The adipocytes and THP-1 macrophages were cocultured for 24 or 48 h in α-MEM (Invitrogen) containing 1× penicillin-streptomycin and 2% FBS. Coculture experiments were performed in duplicate, and the experiment was repeated twice. In some experiments, conditioned medium was obtained from M1, M2a, or M2c macrophages, as described above, and added to cultures of adipocytes in the presence or absence of the TGF-β receptor kinase inhibitors SB-431542 (9) and SB-505124 (6), and PAI-1 or Smad2/3 was measured.
After coculture, the inserts were separated from the wells, and RNA from the cells in the inserts and RNA from the wells were isolated separately with the addition of the RNA extraction medium RNAqueous (Ambion, Naugatuck, CT) directly to the cells followed by scraping. The quantity and quality of the isolated RNA were determined by Agilent 2100 bioanalyzer, and real-time RT-PCR was performed as described above, with all data expressed in relation to 18S RNA.
Western blots and ELISA.
For Western blotting, whole cell lysates from macrophages were isolated with RIPA buffer (Sigma), and 40 μg of cell lysate were heated at 90°C for 5 min and subjected to SDS-PAGE. After transfer, the membrane was incubated with antibodies against TGF-β1 antibody (Cell Signaling, Beverly, MA). Western blotting of p-Smad2/3 and total Smad2/3 was performed with specific antibodies (catalog nos. SC-11769 and SC-6033 respectively, Santa Cruz Biotechnology). For ELISA, coculture medium was collected and centrifuged to remove cell debris, and TGF-β1 was detected with a human TGF-β1 immunoassay kit (R & D Systems, Minneapolis, MN) according to the manufacturer's instructions.
Statistical analysis.
Student's two-sample t-tests were used to compare groups with respect to continuous variables. Paired t-tests were used to compare baseline with treatment measurements within a group. Pearson's correlation coefficients were used to describe the linear association between variables. SI was not normally distributed and was analyzed on a logarithmic scale. All data from samples are means ± SE.
RESULTS
Changes in gene expression with obesity and insulin resistance.
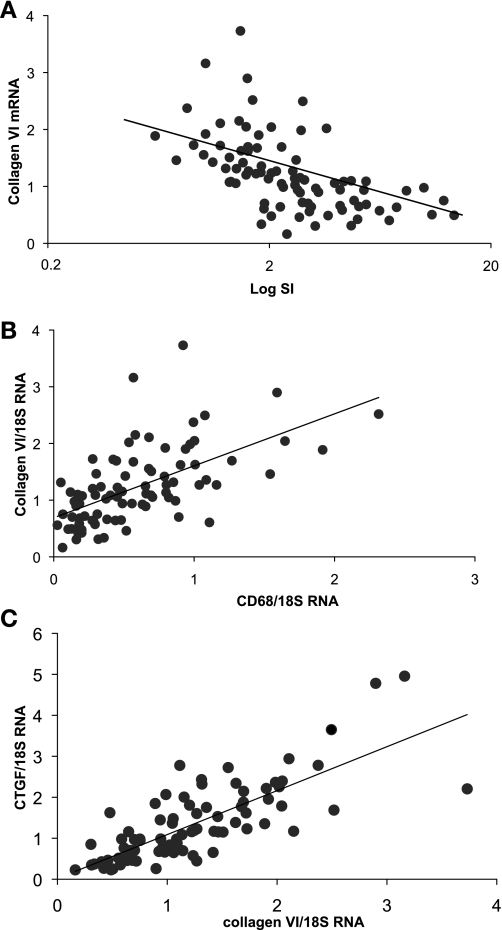
To examine the relationship between obesity, inflammation, and fibrosis, mRNA expression was measured in the adipose tissue of 86 lean and obese subjects. CD68 and collagen VI mRNAs were quantitated as markers of macrophage number and fibrosis, respectively. There were strong correlations between the gene expression of collagen VI and CD68, and both collagen VI and CD68 mRNA levels were associated with BMI and inversely with SI (Table 1, Fig. 1). In addition, the expression of other genes associated with fibrosis and inflammation were measured. Collagen VI and CD68 mRNA levels were highly correlated with the expression of connective tissue growth factor (CTGF) and TGF-β (Table 1, Fig. 1), both of which are associated with the development of fibrosis. SI was also inversely associated with CTGF (r = −0.42, P < 0.0001) and TGF-β (r = −0.49, P < 0.0001). Collagen VI and CD68 mRNA levels were significantly associated with MCP-1 and MIF, both of which are expressed by macrophages (Table 1).
Table 1.
Correlation coefficients between markers of fibrosis and inflammation in adipose tissue
| Collagen VI | CD68 | |
|---|---|---|
| BMI | 0.38* | 0.49† |
| SI | −0.56† | −0.51† |
| Collagen VI | 1.0 | 0.60† |
| CD68 | 0.60† | 1.0 |
| MIF | 0.50† | 0.51† |
| MCP-1 | 0.42† | 0.48† |
| CTGF/CCN2 | 0.77† | 0.48† |
| TGF-β | 0.50† | 0.60† |
BMI, body mass index; SI, insulin sensitivity; MIF, migration inhibitory factor; MCP-1, macrophage chemoattractant protein-1; CTGF, connective tissue growth factor; TGF, transforming growth factor. n = 86.
P < 0.005;
P < 0.0001
Fig. 1.
Changes in gene expression with insulin resistance and inflammation. Adipose tissue gene expression was assessed in 86 subjects covering a range of obesity and insulin sensitivity. A: relationship between collagen VI mRNA level and insulin sensitivity (SI; r = −0.56, n = 86, P < 0.000001). B: relationship between collagen VI mRNA level and CD68 mRNA level (r = 0.60, n = 86, P < 0.000001). C: relationship between collagen VI mRNA level and expression of connective tissue growth factor (CTGF; r = 0.77, n = 86, P < 0.000001).
Immunohistochemical characterization of adipose tissue: increased fibrosis and macrophages with obesity and insulin resistance.
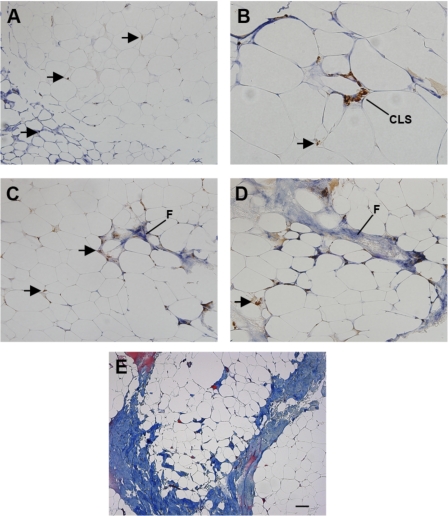
To examine the organization of macrophages in human adipose tissue and the relationship to ECM components, immunohistochemistry was performed in a representative segment of the above-described population. As shown in Fig. 2, human adipose tissue sections were immunoreacted with antibodies to CD68 (brown) and collagen VI (blue). In some areas of adipose tissue, collagen VI surrounded adipocytes, whereas other areas did not accumulate detectable collagen VI (Fig. 2A), and isolated macrophages were found throughout the adipose tissue (arrows). CLS were found (Fig. 2B) but were not abundant and were not necessarily found in areas of fibrosis. In many fields, tracks of collagen VI were found that contained abundant macrophages (Fig. 2, C and D). To confirm the collagen VI staining and to better demonstrate the tracts of fibrosis, adipose tissue was stained with Masson's trichrome, which demonstrated broad areas of collagen (blue) staining (Fig. 2E). These broad areas of fibrosis surrounded fields of adipocytes.
Fig. 2.
Characterization of collagen VI and macrophages in human adipose tissue. Human adipose tissue was double-stained with antibodies to CD68 (brown) and collagen VI (blue). A: adipocytes were surrounded by intense collagen staining in some areas (bottom left), but not others. Magnification ×200. Arrows, CD68-stained macrophages. B: a crownlike structure (CLS) in an area with intense collagen VI staining. Magnification ×400. C: area of fibrosis (F) in adipose tissue, with isolated interstitial macrophages (arrows). Magnification ×200. D: area of fibrosis (F) in adipose tissue with collagen staining extending into surrounding adipocytes, with isolated macrophages. Magnification ×200. E: Masson's trichrome stain of adipose tissue demonstrating layers of fibrosis (blue) surrounding adipocytes. Magnification ×100. Scale bar, 50 μm.
These observations were quantified to characterize the effects of obesity on the relationship of macrophages to other adipose tissue structures. Careful quantification of macrophage number, location, fibrotic area, and adipocyte size was performed in adipose tissue from eight lean insulin-sensitive and eight obese insulin-resistant subjects. As shown in Table 2, the lean and obese subjects were matched for age but differed in BMI and SI. Fibrotic area of the adipose tissue sections was measured (see methods), and a higher percentage of fibrosis was found in the adipose tissue from obese than lean subjects, and most of these fibrotic areas expressed collagen VI. Adipocytes surrounded by CLS were generally smaller than other adipocytes, and adipocytes near fibrotic areas were also smaller than adipocytes in nonfibrotic areas (Table 2). Adipose tissue from obese subjects contained more total macrophages and more CLS, although CLS were relatively rare, accounting for only a small fraction of the total CD68-positive cells. Macrophages were further classified as within areas of fibrosis (within 2 adipocyte diameters) or outside areas of fibrosis. Although only 14% of the adipose area was fibrotic in lean subjects, most of the macrophages in lean subjects were concentrated in this area. Macrophages in obese subjects, however, were found in fibrotic and nonfibrotic areas, and there were more overall macrophages in obese subjects (Table 2). The major differences between the two groups were the larger area of fibrosis, increased number of macrophages, and increased adipocyte size in obese compared with lean subjects. The increased macrophage number in obesity results primarily from the fourfold increase in the number of macrophages in the nonfibrotic areas.
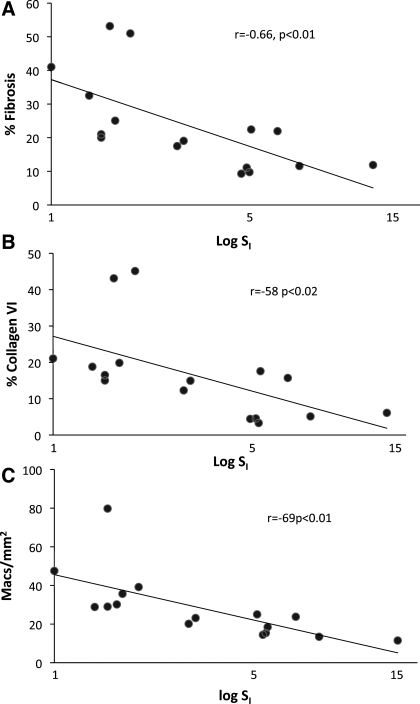
Fibrotic area, collagen VI area, and measurements of macrophage number were analyzed with respect to insulin resistance. The fibrotic area of the adipose tissue was correlated significantly and inversely with SI, as was the area covered by collagen VI (Fig. 3). In addition, the number of macrophages in the tissue was significantly associated with SI.
Fig. 3.
Relationship between fibrosis, macrophages, and insulin sensitivity. Areas covered by fibrosis and collagen VI and number of macrophages in adipose tissue sections were quantitated in 16 subjects and expressed in terms of SI. A: percent fibrosis in relation to SI. B: percent collagen VI staining in relation to SI. C: macrophage number (Macs) in relation to SI.
Alternatively activated macrophages are associated with fibrosis in adipose tissue during obesity.
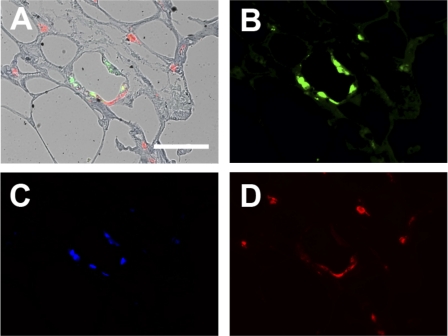
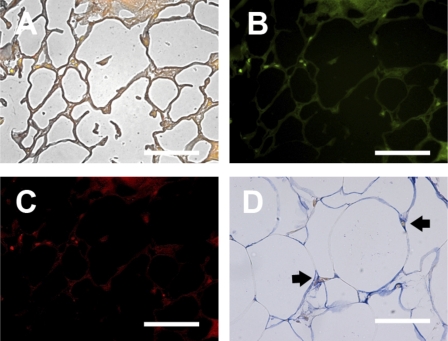
As described above, more macrophages were found in obese insulin-resistant subjects, and the macrophages were associated with fibrosis. To characterize the activation state of adipose tissue macrophages, triple-immunofluorescence was performed, first with a CD68 antibody to identify all macrophages and then with CD86 and CD206 antibodies to identify cells that were more characteristic of M1 and M2, respectively (Fig. 4). Figure 4A shows a representative image of a CLS composed of CD68-positive macrophages. Most of the macrophages in the CLS expressed CD86, an M1 marker (Fig. 4B), with CD206, an M2 marker, less apparent (Fig. 4C). The CD86-positive macrophages also stained with CD40, another marker of M1 macrophages (data not shown). Some macrophages immunoreacted positively for CD86 and CD206, suggesting that these cells were not “pure” M1 or M2. Overall, the macrophages not associated with the CLS, which included most of the macrophages in the adipose tissue, demonstrated relatively little CD86 staining but stained strongly for CD206, suggesting that the interstitial macrophages were predominantly M2. To better characterize these non-CLS interstitial macrophages, additional immunofluorescence was performed with an antibody to CD150 (also called Slam), which is characteristic of M2c macrophages, a specific subclass of M2 macrophage that is involved in wound healing and ECM production and expresses high levels of TGF-β (18). As shown in Fig. 5, the M2 macrophages found in interstitial areas expressed CD150. Figure 5, A–C, illustrates a representative fibrotic area of adipose tissue that contains CD68-positive macrophages and also expresses CD150. In Fig. 5D, a less fibrotic area of adipose tissue illustrates the colocalization of CD150-expressing macrophages with collagen VI.
Fig. 4.
Immunofluorescent analysis of macrophage phenotype. Adipose tissue samples were immunoreacted with antibodies to identify M1 and M2 macrophages. Photomicrographs are representative of a field that included a CLS, as well as interstitial macrophages. A: bright-field overlay showing triple-immunofluorescence reactivity to antibodies recognizing a pan-monocyte/macrophage marker (CD68, green), a marker preferentially expressed on M1 macrophages (CD86, blue), and a marker for M2 macrophages (CD206, red). B, C, and D: individual reactivity to CD68, CD86, and CD206, respectively. Scale bar, 50 μm.
Fig. 5.
Identification of CD150 in adipose tissue macrophages. A–C: photomicrographs representative of a fibrotic area with interstitial macrophages. A: bright-field overlay of CD68 (green) and CD150 (red) double-immunofluorescence with background Sudan Black B staining. B: CD68 immunofluorescence. C: CD150 immunofluorescence. D: immunohistochemical double-staining of a relatively nonfibrotic area of adipose tissue with CD150 (brown) and collagen VI (blue). All CD150-positive cells also stained positively with anti-CD206, indicating that they were M2 macrophages (data not shown). Arrows, CD150-positive macrophages. Scale bars, 50 μm.
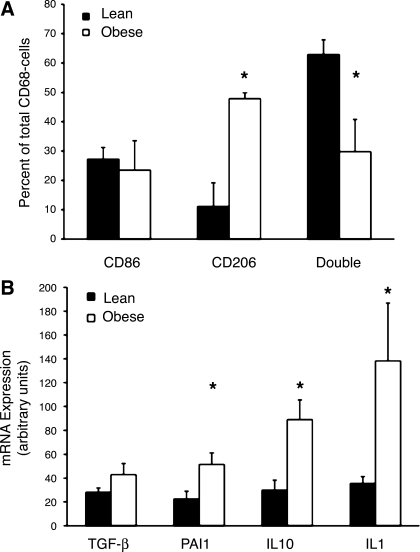
To quantify M1 and M2 interstitial macrophages, CD86- and CD206-positive cells that were not associated with a CLS were counted in adipose tissue from eight lean insulin-sensitive and eight obese insulin-resistant subjects. As shown in Fig. 6A, ∼60% of the non-CLS macrophages in the adipose tissue from lean subjects contained macrophages that expressed a mixed M1-M2 phenotype, expressing CD86 and CD206. In obese subjects, however, there was a shift to more CD206-positive macrophages, with characteristics more consistent with the M2 phenotype. Taken together, these results suggest that obesity is associated with increased numbers of M2 macrophages associated with increased areas of fibrosis.
Fig. 6.
Assessment of M1 and M2 macrophages in adipose tissue. A: adipose tissue from lean and obese subjects was stained for CD86 and CD206, and number of macrophages that stained positively for each antigen were counted and expressed as percentage of total macrophages (CD68-positive cells). For each macrophage, CD86-, CD206-, or CD86- and CD206- (double) positive staining was determined. B: mRNA levels of TGF-β, plasminogen activator inhibitor-1 (PAI-1), IL-10, and IL-1 from stromal vascular fraction of lean and obese subjects. Data were normalized to 18S RNA. *P < 0.05 vs. lean.
A shift in macrophages from a more mixed M1-M2 to a more M2 phenotype with obesity, as shown in Fig. 6A, should also be associated with a change in gene expression in the macrophages. To better define this shift in macrophage gene expression with obesity, adipose tissue from 16 lean and obese subjects was digested with collagenase, and the SVF, which contains macrophages as well as other cells, was prepared. RNA was isolated from the SVF, and the expression of several genes characteristic of M1 and M2 macrophages was measured (Fig. 6B). The expression of TGF-β mRNA was not significantly increased, although TGF-β undergoes much posttranscriptional regulation, and there was a significant increase in the expression of PAI-1, which is activated by TGF-β, in the SVF of obese subjects. In addition, there was an increase in the expression of IL-10, which is also a marker of M2 macrophages. IL-1 was also expressed at higher levels in SVF from obese than lean subjects.
Adipocytes change the phenotype of macrophages in vitro.
To better examine the interactions between macrophages and adipocytes, experiments were performed using primary human adipocytes and preadipocytes cocultured with THP-1 macrophages. The THP-1 macrophages were induced to take on different phenotypes to model the gene expression pattern of M1, M2a, and M2c macrophages, as described previously (33). To induce an M1 phenotype, THP-1 cells were treated with IFN-γ and LPS, whereas an M2a or M2c phenotype was induced by treatment with IL-4 or IL-10, respectively (see methods).
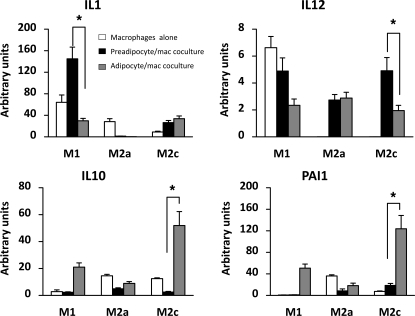
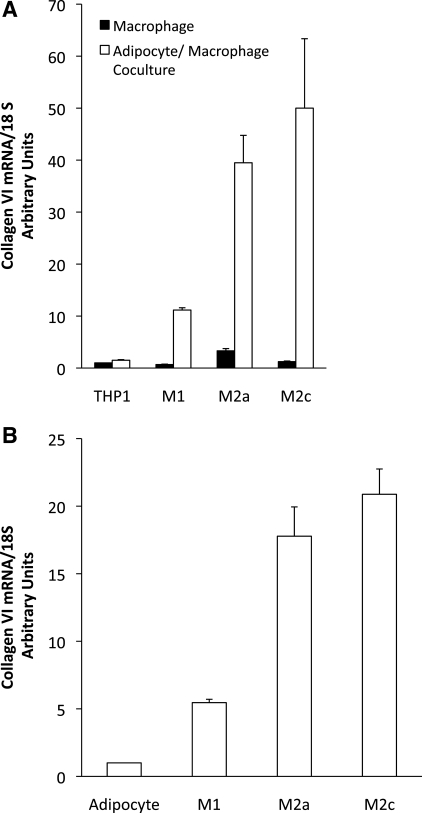
To determine whether the adipose environment may directly affect macrophage gene expression, M1, M2a, and M2c macrophages were cocultured with preadipocytes or mature differentiated adipocytes. The adipocytes and macrophages were differentiated prior to coculture, and the gene expression of the macrophages was determined after 48 h of coculture. Figure 7 shows the distinct expression patterns of a number of genes characteristic of the different phenotypes in THP-1 macrophages following treatment and changes in relative expression as a result of coculture. When cultured alone, the M1 macrophages expressed higher levels of the inflammatory cytokine genes IL-1 and IL-12 and low levels of IL-10 (Fig. 7). The THP-1 cells that were induced to an M2a and M2c phenotype, however, expressed lower levels of IL-1 mRNA and no detectable IL-12, along with higher levels of IL-10. PAI-1 gene expression was relatively low in the M1 macrophages compared with M2a and M2c macrophages. When M1 macrophages were cocultured with differentiated adipocytes, however, they expressed lower levels of IL-1 and IL-12 and higher levels of IL-10 and PAI-1 mRNA. Surprisingly, coculture with preadipocytes caused a preferential increase in IL-1 gene expression in M1 macrophages. With the exception of IL-12 gene expression, coculture of M2a macrophages with fat cells reduced expression of the genes analyzed. On the other hand, coculture of M2c macrophages with adipocytes led to increased expression of inflammatory (IL-1 and IL-12) and anti-inflammatory (IL-10) cytokine genes, with the largest effect on PAI-1 gene expression. Hence, coculture of macrophages with adipocytes led to an overall shift of M1 macrophage gene expression to lower expression of classical inflammatory cytokines, such as IL-1 and IL-12, and higher expression of the anti-inflammatory cytokine IL-10 and PAI-1. Adipocyte coculture augmented expression of all the above-mentioned genes in M2c macrophages, suggesting that adipocyte secretory products promote a mixed phenotype in M1 and M2c macrophages. In addition to the change in macrophage cytokine expression, there were also changes in collagen VI expression. As shown in Fig. 8A, THP-1 macrophages that are not differentiated express little collagen VI. When cocultured with adipocytes, however, there is a large increase in macrophage collagen VI expression, especially in M2a and M2c macrophages. Similar changes also occurred in adipocytes. Although adipocytes in culture expressed modest levels of collagen VI, the coculture of adipocytes with macrophages greatly increased collagen VI expression (Fig. 8B).
Fig. 7.
Coculture of macrophages and adipocytes: effects on gene expression. THP-1 gene expression. THP-1 cells were differentiated into M1, M2a, or M2c macrophages, and IL-1, IL-12, IL-10, and PAI-1 gene expression was assessed in these cells when cultured alone or when cocultured with preadipocytes or adipocytes. Gene expression for each condition was normalized to expression of THP-1 monocytes that were not induced to differentiate. *P < 0.05.
Fig. 8.
Effects of coculture on collagen VI expression. Macrophages were induced to differentiate and cultured alone or cocultured with adipocytes. After 72 h in culture, RNA was prepared from the cells, and collagen VI expression was measured. A: collagen VI expression in macrophages. THP-1, undifferentiated macrophages. B: collagen VI expression in adipocytes, cultured alone (adipocytes) or in the presence of differentiated macrophages for 72 h.
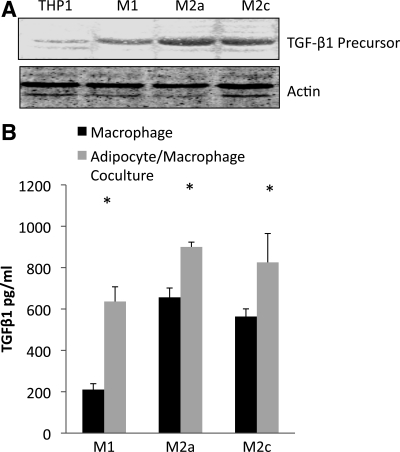
TGF-β from M2 macrophages.
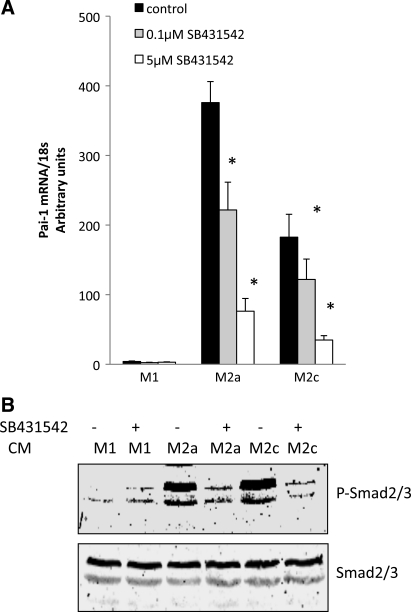
PAI-1 is a downstream marker of TGF-β, and the increased collagen, along with elevated PAI-1 expression by the M2c macrophages in culture with adipocytes, suggested that the M2c macrophages were expressing and secreting TGF-β. To examine TGF-β, the cell lysates from THP-1 macrophages were analyzed by Western blotting for TGF-β1 precursor. As shown in Fig. 9A, little TGF-β precursor was present in undifferentiated THP-1 cells; it increased, particularly in M2a and M2c macrophages. An ELISA was used to measure TGF-β1 precursor in the medium of cultured cells. When macrophages were cocultured with adipocytes, the medium contained more TGF-β precursor than the culture of macrophages alone (Fig. 9B). Because the active form of TGF-β is transient, we assessed TGF-β activity by measuring PAI-1 and p-Smad2/3. Conditioned medium from M1, M2a, and M2c macrophages was added to cultures of adipocytes in the presence or absence of SB-431542, a TGF-β receptor kinase inhibitor (9). As shown in Fig. 10A, addition of SB-431542 to the conditioned medium resulted in a dose-dependent decrease in adipocyte PAI-1 expression from M2a and M2c macrophages. In addition, the TGF-β receptor kinase inhibitor inhibited the phosphorylation of Smad2/3 (Fig. 10B) from adipocytes exposed to the medium from M2a and M2c macrophages. Similar data were obtained with SB-505124, a different TGF-β receptor inhibitor (6) (data not shown). M1 macrophage-conditioned medium had little ability to stimulate PAI-1 or Smad2/3 from adipocytes. Thus these data indicate high levels of TGF-β secretion by M2a and M2c macrophages in culture, which then activate traditional downstream targets, such as PAI-1 and Smad2/3.
Fig. 9.
Secretion of transforming growth factor (TGF)-β1 precursor. A: TGF-β1 precursor identified by Western blotting in THP-1 macrophages, without differentiation, or following differentiation to M1, M2a, or M2c macrophages. B: TGF-β1 precursor measurement in the medium by ELISA of macrophages alone or following 24 h of coculture with adipocytes. *P < 0.05 vs. macrophages alone.
Fig. 10.
TGF-β signaling in adipocytes. Conditioned medium (CM) from M1, M2a, or M2c macrophages was added to adipocytes for 24 h in the presence or absence of the TGF-β receptor kinase inhibitor SB-431542. PAI-1 mRNA and phosphorylated Smad2/3 (p-Smad2/3) were measured as markers of TGF-β activity. A: SB-431542 (0.1 and 5 μM) was added to cultures, and adipocyte PAI-1 mRNA levels were measured. Data are expressed relative to adipocytes that were not cultured with conditioned medium. B: adipocytes treated with conditioned medium with or without 5 μM SB-431542 were blotted for p-Smad2/3 and then for total Smad2/3.
DISCUSSION
Insulin resistance is the earliest event in the development of metabolic syndrome and type 2 diabetes. Research into the role of adipose tissue in the development of insulin resistance has moved rapidly, beginning with the first description of inflammatory cytokine expression by adipose tissue (11), the recognition of adipose tissue macrophages as the primary source of many cytokines (29, 31), and, more recently, an analysis of the ECM and the activation state of adipose tissue macrophages. Recent studies in the collagen VI KO mouse demonstrated less insulin resistance and less macrophage infiltration, despite continued obesity (14), suggesting a close relationship between the ECM composition and inflammation. These relationships were also recently extended to human adipose tissue: obese humans expressed higher levels of collagen VI, and subjects with high collagen VI had higher levels of macrophage markers (20). Nevertheless, many issues remain unresolved: the nature of the association between the ECM and inflammation, a more precise characterization of the macrophages found in adipose tissue, and more information on the association between the ECM, macrophages, and insulin resistance.
In the present study, we demonstrate increased ECM in obese subjects and also the presence of tracts of fibrosis in adipose tissue. Overall, fibrosis and collagen VI accumulation in human adipose tissue are strongly correlated with BMI and inversely correlated with insulin sensitivity. This relationship between fibrosis/collagen VI, macrophage number, and insulin resistance was demonstrated through immunohistochemistry and measurement of adipose tissue gene expression in a large number of subjects. These studies involved only subcutaneous adipose tissue, and it is not known whether the same findings apply to visceral or other adipose depots. These data indicate that adipose tissue is not homogeneous but, rather, contains areas of fibrosis and other areas where adipocytes are not surrounded by excessive ECM or fibrotic elements. The degree of fibrosis in the adipose tissue is itself associated with insulin resistance, and more macrophages are found in the fibrotic areas. As suggested by previous studies in collagen VI KO mice (14), an overabundant ECM may restrict adipocyte expansion, leading to ectopic lipid and adipocyte necrosis (the formation of CLS). In addition, an analysis of the transcriptomic signature of human adipose tissue of obese subjects revealed an increase in many ECM genes (10). Our studies are consistent with the above-described theory, since the adipocytes nearest fibrotic areas were smaller than those more distant from areas of collagen deposition. However, small adipocytes were rarely surrounded by a CLS, and indeed CLS were not common. Thus, collagen VI may constrain adipocyte expansion by restricting lipid storage (14), although a direct causal link to inflammation is not clear. Pasarica and colleagues (21) suggest that hypoxia and decreased capillary density as a result of excessive fibrosis may underlie macrophage chemotaxis and adipose inflammation.
Although many reports have noted increased adipose macrophages with obesity, the phenotype of the macrophages is less clear. Adipose tissue macrophages of lean mice express genes suggestive of an M2 phenotype, and high-fat feeding induced a shift from M2 to M1 macrophages (16), along with a considerable increase in CLS (24). A recent report in humans tended to support the mouse studies. Human adipose tissue macrophages were identified using immunohistochemistry, and obesity was associated with a shift in macrophages from M2 to M1 (1). Another recent study identified CLS-associated macrophages as having a mixed M1-M2 phenotype and non-CLS macrophages as M2 (30). On the other hand, an analysis of cell surface marker expression, such as the mannose receptor (CD206), scavenger receptor (CD163), and integrins, by cell sorting showed that human adipose tissue macrophages have an anti-inflammatory, alternatively activated, M2 phenotype, and more M2 macrophages are found in obese subjects (4, 33).
Immunohistochemical characterization of macrophages as M1 or M2 was complex. Because M1 and M2 markers can be expressed on other cell types, we counted only cells that coexpressed CD68, a pan-monocyte/macrophage marker. In lean and obese subjects, the macrophages in CLS expressed CD86 and CD40, both M1 markers, whereas the non-CLS macrophages were more M2-like, expressing CD206. However, some of the macrophages in the CLS also expressed CD206, and coexpression of CD86 and CD206 in non-CLS macrophages was common, suggesting that adipose tissue macrophages assume a complex phenotype, and a designation as M1 or M2 based on surface markers is imprecise (19). After quantitation of macrophage markers in lean and obese subjects, we found that adipose tissue from obese subjects contained more macrophages, along with a greater degree of fibrosis, and that a significantly higher proportion of the macrophages expressed only CD206, an M2 marker. The proportion of macrophages expressing CD86, the M1 marker, did not change, but since there was an overall increase in macrophages with obesity, adipose tissue from obese subjects contained more M1 macrophages.
Perhaps the most novel observation from this work is that the M2 macrophages in obese individuals coexpressed CD150, also called Slam, which is a marker of M2c. These “wound-healing macrophages” contribute to scar formation and ECM production through high expression of TGF-β (19). TGF-β activates PAI-1 and Smad2/3, and the high levels of PAI-1 and p-Smad2/3 induced by M2a and M2c macrophages were inhibited by TGF-β receptor-blocking drugs. In addition, we found a higher level PAI-1, as well as IL-10 and IL-1, expression in the SVF from adipose tissue of obese subjects. IL-10 is an anti-inflammatory cytokine typically found in M2 macrophages, and IL-1 is a proinflammatory cytokine that is produced by M1 macrophages. Our data also support flow cytometry studies, which suggested that adipose tissue macrophages tend to be M2-like but still express high levels of proinflammatory cytokines, such as IL-1 (33). Therefore, the measurement of gene expression in the SVF supported the immunohistochemical findings.
Results of macrophage-adipocyte coculture suggest a mechanism whereby macrophages can acquire proinflammatory and profibrotic characteristics in adipose tissue. THP-1 cells were induced to differentiate into cells that modeled M1, M2a, and M2c macrophages, and adipocytes were induced to differentiate from preadipocytes. In the coculture system, preadipocytes were used as a control for adipocytes. Although THP-1 macrophages are a cell line and are not primary macrophages, they can be differentiated to mimic tissue macrophages with different phenotypes. When M1 macrophages were cocultured with adipocytes, the macrophages took on a more M2-like phenotype, with lower expression of IL-1 and higher expression of IL-10 and PAI-1 genes. M2c macrophages responded to coculture with adipocytes by robustly increasing expression of both classes of cytokine genes, as well as PAI-1. Such a shift in gene expression by macrophages would lead to inflammation and tend to promote an increase in ECM production and fibrosis. To more directly demonstrate the profibrotic environment involving M2 macrophages and adipocytes, the coculture of adipocytes and macrophages resulted in an increase in TGF-β protein secretion from the M2 macrophages and an increase in collagen VI expression from macrophages and adipocytes, especially from cocultures involving M2a and M2c macrophages. Although the effects of preadipocytes in adipose tissue are unclear, preadipocytes in coculture promoted proinflammatory IL-1 expression by M1 macrophages and IL-12 expression by M2c macrophages. On the basis of this model and our in vivo analyses, the adipose tissue of obese humans is characterized by more M2 macrophages, which generate an inflamed environment and more fibrosis as a result of exposure to secretory products from adipocytes, in contrast to the M1-dominated proliferation of CLS that is described in many obese rodent models.
We hypothesize that the increased M2 macrophages in obesity, and especially the shift to an M2c phenotype, traditionally associated with wound healing (18), are a major source of TGF-β in adipose. This TGF-β signaling by M2 macrophages may be important in upregulating ECM gene expression in obesity-associated fibrosis. We showed previously that TSP-1, an activator of TGF-β, is an adipokine upregulated with obesity and insulin resistance and associated with PAI-1, a downstream target of TGF-β (26). Several ECM component genes, including collagens and CTGF, are also regulated by TGF-β, and these are correlated with obesity and insulin resistance. Interestingly, secretory factors from proinflammatory macrophages that were originally reported to impair preadipocyte differentiation and induce inflammation (15) were shown more recently to promote a profibrotic phenotype in human preadipocytes in vitro (13).
In summary, these studies carefully quantitated adipose macrophage phenotypes and adipose tissue fibrosis in lean and obese subjects. Obesity was associated with increased adipose fibrosis and an increase in alternatively activated, profibrotic macrophages. These data suggest that adipose tissue in obesity is less inflamed, in the classical sense, and better characterized as a tissue undergoing low-grade inflammation and fibrosis.
GRANTS
This work was supported by National Institutes of Health Grants DK-39176 and DK-80327 (P. A. Kern) and DK-71349 and AG-20941 (C. A. Peterson), General Clinical Research Center Grant M01 RR-14288, and a Merit Review Grant from the Veterans Administration (N. Rasouli).
DISCLOSURES
No conflicts of interest, financial or otherwise, are declared by the authors.
ACKNOWLEDGMENTS
We thank Regina Dennis and Stacy BeBout for assistance with subject recruitment, and we thank the staff of the General Clinical Research Centers at the University of Arkansas and University of Kentucky.
REFERENCES
- 1.Aron-Wisnewsky J, Tordjman J, Poitou C, Darakhshan F, Hugol D, Basdevant A, Aissat A, Guerre-Millo M, Clement K. Human adipose tissue macrophages: m1 and m2 cell surface markers in subcutaneous and omental depots and after weight loss. J Clin Endocrinol Metab 94: 4619–4623, 2009 [DOI] [PubMed] [Google Scholar]
- 2.Bergman RN, Finegood DT, Ader M. Assessment of insulin sensitivity in vivo. Endocr Rev 6: 45–86, 1985 [DOI] [PubMed] [Google Scholar]
- 3.Boston RC, Stefanovski D, Moate PJ, Sumner AE, Watanabe RM, Bergman RN. MINMOD Millennium: a computer program to calculate glucose effectiveness and insulin sensitivity from the frequently sampled intravenous glucose tolerance test. Diabetes Technol Ther 5: 1003–1015, 2003 [DOI] [PubMed] [Google Scholar]
- 4.Bourlier V, Zakaroff-Girard A, Miranville A, De BS, Maumus M, Sengenes C, Galitzky J, Lafontan M, Karpe F, Frayn KN, Bouloumie A. Remodeling phenotype of human subcutaneous adipose tissue macrophages. Circulation 117: 806–815, 2008 [DOI] [PubMed] [Google Scholar]
- 5.Cinti S, Mitchell G, Barbatelli G, Murano I, Ceresi E, Faloia E, Wang S, Greenberg AS, Obin MS. Adipocyte death defines macrophage localization and function in adipose tissue of obese mice and humans. J Lipid Res 46: 2347–2355, 2005 [DOI] [PubMed] [Google Scholar]
- 6.DaCosta BS, Major C, Laping NJ, Roberts AB. SB-505124 is a selective inhibitor of transforming growth factor-β type I receptors ALK4, ALK5, and ALK7. Mol Pharmacol 65: 744–752, 2004 [DOI] [PubMed] [Google Scholar]
- 7.Di Gregorio GB, Yao-Borengasser A, Rasouli N, Varma V, Lu T, Miles LM, Ranganathan G, Peterson CA, McGehee RE, Kern PA. Expression of CD68 and macrophage chemoattractant protein-1 genes in human adipose and muscle tissues: association with cytokine expression, insulin resistance, and reduction by pioglitazone. Diabetes 54: 2305–2313, 2005 [DOI] [PubMed] [Google Scholar]
- 8.Farina C, Theil D, Semlinger B, Hohlfeld R, Meinl E. Distinct responses of monocytes to Toll-like receptor ligands and inflammatory cytokines. Int Immunol 16: 799–809, 2004 [DOI] [PubMed] [Google Scholar]
- 9.Halder SK, Beauchamp RD, Datta PK. A specific inhibitor of TGF-β receptor kinase, SB-431542, as a potent antitumor agent for human cancers. Neoplasia 7: 509–521, 2005 [DOI] [PMC free article] [PubMed] [Google Scholar]
- 10.Henegar C, Tordjman J, Achard V, Lacasa D, Cremer I, Guerre-Millo M, Poitou C, Basdevant A, Stich V, Viguerie N, Langin D, Bedossa P, Zucker JD, Clement K. Adipose tissue transcriptomic signature highlights the pathological relevance of extracellular matrix in human obesity. Genome Biol 9: R14, 2008 [DOI] [PMC free article] [PubMed] [Google Scholar]
- 11.Hotamisligil GS, Shargill NS, Spiegelman BM. Adipose expression of tumor necrosis factor-α: direct role in obesity-linked insulin resistance. Science 259: 87–91, 1993 [DOI] [PubMed] [Google Scholar]
- 12.Imaizumi K, Kawabe T, Ichiyama S, Kikutani H, Yagita H, Shimokata K, Hasegawa Y. Enhancement of tumoricidal activity of alveolar macrophages via CD40-CD40 ligand interaction. Am J Physiol Lung Cell Mol Physiol 277: L49–L57, 1999 [DOI] [PubMed] [Google Scholar]
- 13.Keophiphath M, Achard V, Henegar C, Rouault C, Clement K, Lacasa D. Macrophage-secreted factors promote a profibrotic phenotype in human preadipocytes. Mol Endocrinol 23: 11–24, 2009 [DOI] [PMC free article] [PubMed] [Google Scholar]
- 14.Khan T, Muise ES, Iyengar P, Wang ZV, Chandalia M, Abate N, Zhang BB, Bonaldo P, Chua S, Scherer PE. Metabolic dysregulation and adipose tissue fibrosis: role of collagen VI. Mol Cell Biol 29: 1575–1591, 2009 [DOI] [PMC free article] [PubMed] [Google Scholar]
- 15.Lacasa D, Taleb S, Keophiphath M, Miranville A, Clement K. Macrophage-secreted factors impair human adipogenesis: involvement of proinflammatory state in preadipocytes. Endocrinology 148: 868–877, 2007 [DOI] [PubMed] [Google Scholar]
- 16.Lumeng CN, Bodzin JL, Saltiel AR. Obesity induces a phenotypic switch in adipose tissue macrophage polarization. J Clin Invest 117: 175–184, 2007 [DOI] [PMC free article] [PubMed] [Google Scholar]
- 17.Mantovani A, Sica A, Locati M. New vistas on macrophage differentiation and activation. Eur J Immunol 37: 14–16, 2007 [DOI] [PubMed] [Google Scholar]
- 18.Mantovani A, Sica A, Sozzani S, Allavena P, Vecchi A, Locati M. The chemokine system in diverse forms of macrophage activation and polarization. Trends Immunol 25: 677–686, 2004 [DOI] [PubMed] [Google Scholar]
- 19.Mosser DM, Edwards JP. Exploring the full spectrum of macrophage activation. Nat Rev Immunol 8: 958–969, 2008 [DOI] [PMC free article] [PubMed] [Google Scholar]
- 20.Pasarica M, Gowronska-Kozak B, Burk D, Remedios I, Hymel D, Gimble J, Ravussin E, Bray GA, Smith SR. Adipose tissue collagen VI in obesity. J Clin Endocrinol Metab 94: 5155–5162, 2009 [DOI] [PMC free article] [PubMed] [Google Scholar]
- 21.Pasarica M, Sereda OR, Redman LM, Albarado DC, Hymel DT, Roan LE, Rood JC, Burk DH, Smith SR. Reduced adipose tissue oxygenation in human obesity: evidence for rarefaction, macrophage chemotaxis, and inflammation without an angiogenic response. Diabetes 58: 718–725, 2009 [DOI] [PMC free article] [PubMed] [Google Scholar]
- 22.Rasouli N, Yao-Borengasser A, Varma V, Spencer HJ, McGehee RE, Jr, Peterson CA, Mehta JL, Kern PA. Association of scavenger receptors in adipose tissue with insulin resistance in nondiabetic humans. Arterioscler Thromb Vasc Biol 29: 1328–1335, 2009 [DOI] [PMC free article] [PubMed] [Google Scholar]
- 23.Ruifrok AC, Johnston DA. Quantification of histochemical staining by color deconvolution. Anal Quant Cytol Histol 23: 291–299, 2001 [PubMed] [Google Scholar]
- 24.Strissel KJ, Stancheva Z, Miyoshi H, Perfield JW, DeFuria J, Jick Z, Greenberg AS, Obin MS. Adipocyte death, adipose tissue remodeling, and obesity complications. Diabetes 56: 2910–2918, 2007 [DOI] [PubMed] [Google Scholar]
- 25.Umemura N, Saio M, Suwa T, Kitoh Y, Bai J, Nonaka K, Ouyang GF, Okada M, Balazs M, Adany R, Shibata T, Takami T. Tumor-infiltrating myeloid-derived suppressor cells are pleiotropic-inflamed monocytes/macrophages that bear M1- and M2-type characteristics. J Leukoc Biol 83: 1136–1144, 2008 [DOI] [PubMed] [Google Scholar]
- 26.Varma V, Yao-Borengasser A, Bodles AM, Rasouli N, Phanavanh B, Nolen GT, Kern EM, Nagarajan R, Spencer HJ, 3rd, Lee MJ, Fried SK, McGehee RE, Jr, Peterson CA, Kern PA. Thrombospondin-1 is an adipokine associated with obesity, adipose inflammation, and insulin resistance. Diabetes 57: 432–439, 2008 [DOI] [PMC free article] [PubMed] [Google Scholar]
- 27.Wang N, Satoskar A, Faubion W, Howie D, Okamoto S, Feske S, Gullo C, Clarke K, Sosa MR, Sharpe AH, Terhorst C. The cell surface receptor SLAM controls T cell and macrophage functions. J Exp Med 199: 1255–1264, 2004 [DOI] [PMC free article] [PubMed] [Google Scholar]
- 28.Wang W, Wang J, Dong SF, Liu CH, Italiani P, Sun SH, Xu J, Boraschi D, Ma SP, Qu D. Immunomodulatory activity of andrographolide on macrophage activation and specific antibody response. Acta Pharmacol Sin 31: 191–201, 2010 [DOI] [PMC free article] [PubMed] [Google Scholar]
- 29.Weisberg SP, McCann D, Desai M, Rosenbaum M, Leibel RL, Ferrante AW., Jr Obesity is associated with macrophage accumulation in adipose tissue. J Clin Invest 112: 1796–1808, 2003 [DOI] [PMC free article] [PubMed] [Google Scholar]
- 30.Wentworth JM, Naselli G, Brown WA, Doyle L, Phipson B, Smyth GK, Wabitsch M, O'brien PE, Harrison LC. Pro-inflammatory CD11c+CD206+ adipose tissue macrophages are associated with insulin resistance in human obesity. Diabetes 59: 1648–1656, 2010 [DOI] [PMC free article] [PubMed] [Google Scholar]
- 31.Xu H, Barnes GT, Yang Q, Tan G, Yang D, Chou CJ, Sole J, Nichols A, Ross JS, Tartaglia LA, Chen H. Chronic inflammation in fat plays a crucial role in the development of obesity-related insulin resistance. J Clin Invest 112: 1821–1830, 2003 [DOI] [PMC free article] [PubMed] [Google Scholar]
- 32.Ye J, Gao Z, Yin J, He Q. Hypoxia is a potential risk factor for chronic inflammation and adiponectin reduction in adipose tissue of ob/ob and dietary obese mice. Am J Physiol Endocrinol Metab 293: E1118–E1128, 2007 [DOI] [PubMed] [Google Scholar]
- 33.Zeyda M, Farmer D, Todoric J, Aszmann O, Speiser M, Gyori G, Zlabinger GJ, Stulnig TM. Human adipose tissue macrophages are of an anti-inflammatory phenotype but capable of excessive pro-inflammatory mediator production. Int J Obes (Lond) 31: 1420–1428, 2007 [DOI] [PubMed] [Google Scholar]


