Abstract
The 5/6th nephrectomy or ablation/infarction (A/I) preparation has been used as a classic model of chronic kidney disease (CKD). We observed increased kidney oxygen consumption (QO2) and altered renal hemodynamics in the A/I kidney that were normalized after combined angiotensin II (ANG II) blockade. Studies suggest hypoxia inducible factor as a protective influence in A/I. We induced hypoxia-inducible factor (HIF) and HIF target proteins by two different methods, cobalt chloride (CoCl2) and dimethyloxalyglycine (DMOG), for the first week after creation of A/I and compared the metabolic and renal hemodynamic outcomes to combined ANG II blockade. We also examined the HIF target proteins expressed by using Western blots and real-time PCR. Treatment with DMOG, CoCl2, and ANG II blockade normalized kidney oxygen consumption factored by Na reabsorption and increased both renal blood flow and glomerular filtration rate. At 1 wk, CoCl2 and DMOG increased kidney expression of HIF by Western blot. In the untreated A/I kidney, VEGF, heme oxygenase-1, and GLUT1 were all modestly increased. Both ANG II blockade and CoCl2 therapy increased VEGF and GLUT1 but the cobalt markedly so. ANG II blockade decreased heme oxygenase-1 expression while CoCl2 increased it. By real-time PCR, erythropoietin and GLUT1 were only increased by CoCl2 therapy. Cell proliferation was modestly increased by ANG II blockade but markedly after cobalt therapy. Metabolic and hemodynamic abnormalities were corrected equally by ANG II blockade and HIF therapies. However, the molecular patterns differed significantly between ANG II blockade and cobalt therapy. HIF induction may prove to be protective in this model of CKD.
Keywords: vascular endothelial growth factor, subtotal nephrectomy, heme oxygenase-1, kidney oxygen consumption
chronic kidney disease (CKD) is characterized by significant alterations in physiology, structure, and metabolism. These alterations are of mechanistic importance to the progressive deterioration of kidney function. For instance, oxygen consumption (QO2) factored by NaCl reabsorption (QO2/TNa) is increased after 5/6 kidney, ablation/infarction (A/I) model (10, 17, 32), an animal model widely used to investigate the underlying mechanisms of CKD. Such marked increases in oxygen consumption by renal tissue should lead to local hypoxia.
Hypoxia poses a significant challenge to cellular and organ function and plays a critical role in the progression of CKD to end stage renal failure (22, 31). Hypoxia induces the expression of a large number of genes that ultimately mediate the cell's adaptations and maladaptations. Indeed, several hypoxia-induced proteins, vascular endothelial growth factor (VEGF; Refs. 7, 39, 44), heme oxygenase-1 (HO-1; Refs. 7, 39, 44), erythropoietin (Epo; Refs. 28, 36), and glucose transporter 1 (GLUT1), have attracted considerable research interests for their protective effects in CKD. These results suggest a potential role for hypoxia-inducible factor (16) in halting CKD progression.
We have previously shown that early application of combined angiotensin II (ANG II) blockade with losartan and captopril improves renal hemodynamics and normalizes QO2/TNa (10). In this study, we tested the hypothesis that induction of HIF, as demonstrated in kidney tissue by Western blot and indexed by the expression of VEGF, HO-1, Epo, and GLUT1 mediates the beneficial effects of ANG II blockade in CKD. We utilized two different mechanisms of HIF induction, administration of cobalt chloride (CoCl2) and dimethyloxalyglycine (DMOG). This hypothesis seems less likely given the prior observations from this laboratory in this model that combined ANG II blockade normalized kidney oxygen consumption factored by Na reabsorption, thereby eliminating the proximate cause of hypoxia, a presumed stimulus to generation of HIF-1 and related proteins, but stimulation by growth factors have also been postulated to increase HIF (10). In this study, we investigated the effects of HIF induction on renal metabolism and hemodynamics to compare with those observed with ANG II blockade in A/I and examined the expression of HIF-induced proteins with both treatments to explain the observed effects. We utilized both cobalt and DMOG therapy to induce HIF and produced similar metabolic and hemodynamic outcomes. Our unexpected results suggest that both ANG II blockade and persistent activation of the HIF pathway are highly effective and improve renal metabolic and hemodynamic functions but by mechanisms that are similar in some respects but differ significantly in other important molecular expressions.
MATERIALS AND METHODS
Animals.
Animal use and care were approved by the VASDHS Institutional Animal Care and Use Committee and conducted in accordance with National Institutes of Health guidelines. Male Wistar rats with initial body weight of 225 to 250 g (Harlan, Indianapolis, IN) were randomized into four study groups: 1) control group; 2) 1-wk A/I group; 3) 1-wk A/I + ANG II blockade group; 4) 1-wk A/I + cobalt chloride group; and 5) 1-wk A/I + DMOG group. Renal A/I was performed as previously described (10). Cobalt chloride (10 mg·kg−1·day−1) and DMOG (5 mg/kg, twice a day) were given by subcutaneous injection for 8 days. Dual ANG II blockade was accomplished by administration of captopril (20 mg·kg−1·day−1) and losartan (20 mg·kg−1·day−1) by daily gavage for 8 days. Both cobalt chloride and dimethyloxalyglycine (DMOG) were used as HIF-1α stabilizers (30, 34), captopril is an angiotensin converting enzyme inhibitor (ACEI), and losartan acts as a ANG II type 1 receptor (AT1R) blocker.
Renal function measurement and oxygen consumption calculation.
In vivo renal function and renal oxygen consumption were measured as previously described (8–10). Briefly, rats were anesthetized with Inactin (100 mg/kg ip) and placed on a temperature-controlled table at 37°C. After cannulation of trachea, left jugular vein, left femoral artery, and urinary bladder, the left renal blood flow (RBF, ml/min) was monitored with a perivascular ultrasonic transit time flow probe (Transonics T420; Ithaca, NY). Systemic blood pressure and RBF were recorded after the animals were allowed 60 min for stabilization with the flow probe in place.
Glomerular filtration rate (GFR) was measured by clearance of [3H]inulin in Ringer solution (111.23 mM NaCl, 4.69 mM KCl, and 29.76 mM NaHCO3) at 12 μCi/1.5 ml/h.
Blood samples were taken from the femoral artery and renal vein for measurements of total arterial blood hemoglobin (tHb), O2Hb, Po2, Pco2, pH, [Na+], [K+], and [HCO3−HCO3−] with a color spectrophotometer, 682 CO-Oximeter (Instrumentation Laboratory, Lexington, MA). O2 content (O2ct) was calculated by the formula:
The total left kidney oxygen consumption (QO2) was calculated as RBF times arterial minus renal venous O2ct. Sodium transported (TNa) (16) equals total sodium filtered (GFR × PNa) subtraction of excreted sodium from urine (GFR × PNa − UNaV).
Murine cortical tubular cell culture.
Murine cortical tubular cells (19) were grown in DMEM with low glucose (Invitrogen, Carlsbad, CA) supplemented with 100 U/ml penicillin, 100 μg/ml streptomycin, and 10% heat-inactivated FCS (GIBCO) at 37°C in 5% CO2. To activate HIF-1, cobalt chloride (200 μM) was added to the culture 12 h before harvesting.
Cells were lysed in lysis buffer containing 10 mM Tris pH 8.0, 1 mM EDTA, 150 mM NaCl, 1 mM PMSF, and 0.5% NP-40 in the presence of complete protease inhibitor (Roche) on ice for 10 min after being washed with cold PBS. The lysate was centrifuged at 3,000 rpm for 5 min at 4°C, and the resulting supernatant was used for Western blotting. The pellet was extracted with nuclear extraction buffer (20 mM HEPES pH 7.9, 400 mM NaCl, 1 mM EDTA, 1 mM DTT, 1 mM PMSF, and 10 μM MG132) for 15 min at 4°C. After centrifugation at 13,000 rpm for 15 min at 4°C, the nuclear extract was collected and used for Western blotting.
Immunoprecipitation of HIF-1α.
Lysates (500 μg cortical proteins) were precleared by incubation with protein A/G beads (Pierce) in RIPA buffer (50 mM Tris·HCl pH 7.4, 150 mM NaCl, 0.1% SDS, 0.5% sodium deoxycholate, and 1% NP-40) in the presence of protein inhibitor cocktail (Roche) and then incubated for 1 h at 4°C with anti-HIF-1α (Novous). The resulting immune complexes were precipitated with protein A/G beads (Pierce), washed with RIPA buffer, and subjected to Western blot.
Immunoblotting analysis.
The renal cortex were homogenized in buffer (20 mM Tris, pH 7.5, 150 mM NaCl, 0.5% NP-40, and 100 U/ml aprotinin) containing complete protease inhibitor cocktail (Roche). The homogenates were centrifuged at 13,000 g for 25 min at 4°C. Protein concentrations were determined by Bradford method with Bio-Rad protein assay reagents (cat. no. 500–0006; Bio-Rad, Hercules, CA). The proteins were separated by 10% Bis-Tris gel (cat. no. WG 1202 Box; Invitrogen) and transferred onto polyvinylidene difluoride membrane (cat. no. 162–0174; Bio-Rad). After incubation in blocking buffer (5% milk, 20 mM Tris·HCl pH 7.4, 150 mM NaCl, and 0.1% Tween 20), the membranes were incubated with antibodies to HIF-1α (mouse monoclonal, NB100–105; Novous), diluted 1:1000; HO-1 (rabbit polyclonal, SPA-895; Stressgen), diluted 1:2,500; VEGF (mouse monoclonal, sc-7269; Santa Cruz Biotechnology), diluted 1:200; GLUT1 (rabbit polyclonal, sc-7903; Santa Cruz Biotechnology), diluted 1:200; and proliferating cell nuclear antigen (PCNA; mouse monoclonal, sc-56; Santa Cruz Biotechnology), diluted 1:1,000 with blocking buffer overnight 4°C. The membranes were washed and incubated with horseradish peroxidase-labeled goat anti-rabbit immunoglobulin G, diluted 1:10,000 (sc-2004; Santa Cruz Biotechnology), or goat anti-mouse immunoglobulin G, diluted 1:5,000 in blocking buffer for 1 h at room temperature. The reaction was visualized using an enhanced ECL plus Western blotting detection system (GE Healthcare). Quantification of protein expression was performed using Gel-ProAnalyzer (Media Cybernetics, Silver Spring, MD).
Quantitative RT-PCR.
Total RNA was extracted from rat renal cortex using RNA STAT-60 (Tel-Test, Friendswood, TX), treated with RNase-free DNase to eliminate genomic DNA contamination, and purified with RNeasy Mini kit (Qiagen, Valencia, CA). cDNA was synthesized from 2.5 μg total RNA by reverse transcription reaction using SuperScript VILO cDNA synthesis kit (Invitrogen). The primer pairs used for quantitative RT-PCR analysis of Epo and GLUT1 were as previously reported (20). Quantitative real-time PCR was conducted on a Mx3000P QPCR system (Stratagene, La Jolla, CA) using iQ SYBR Green supermix (Bio-Rad) under the following conditions: 5 min at 98°C, 40 cycles of 30 s at 95°C, 30 s at 55°C, and 30 s at 72°C. RNA equivalents were normalized to simultaneously determined GAPDH mRNA levels in each sample. Relative RNA in renal cortex from treated rats was compared with that from the controls. Specificity of each RT-PCR reaction was checked by its dissociation curve. Single product amplification and correct product size were confirmed by agarose gel electrophoresis. The purpose of these studies was limited to examination of mRNAs for two HIF-induced molecules, GLUT1 and Epo, as evidence for active stimulation of hypoxia response element proteins by HIF at the time of evaluation, 7 days after creation of the A/I model.
Cell proliferation by 5-bromodeoxyuridine incorporation.
Rats were given 5- bromodeoxyuridine (BrdU) daily (50 mg/kg ip; Sigma, St. Louis, MO) for the last 5 days. Kidneys were perfused with cold PBS, fixed with 4% paraformaldehyde in situ by cannulation of the abdominal aorta, and then suspended in 4% formaldehyde in PBS for 24 h. Five-micrometer slices were cut from paraffin-embedded tissue. The sections were stained with biotinylated mouse anti-BrdU antibody, and related reagents were provided from a commercial kit (Zymed Laboratories, cat. no. 93–3944; Invitrogen) according to the manufacturer's instructions. BrdU-positive cells were counted in whole cortex regions of each section. Twenty ×10 fields that show higher BrdU-positive cell numbers in each slide were used to calculate means for comparison.
Statistical analysis.
Data are expressed as means ± SE. Software SPSS was used for statistical analysis. Comparisons were done by ANOVA. P < 0.05 was considered statistically significant.
RESULTS
Improvement of renal hemodynamics by cobalt treatment and ANG II blockade.
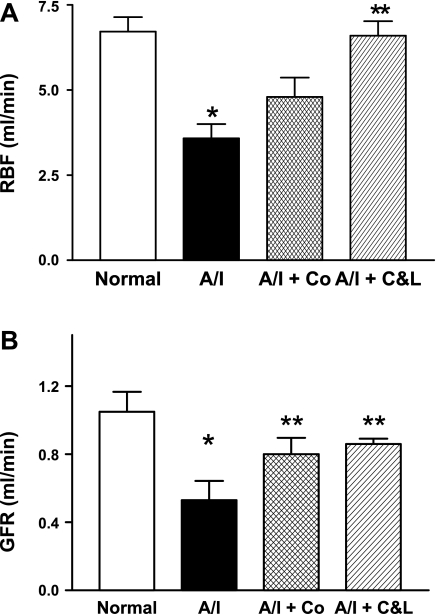
The untreated A/I kidneys exhibited significant decreases in both RBF and GFR (Fig. 1). This reduction in GFR and RBF was not simply due to the reduction in renal mass in A/I kidney, since both GFR and RBF were increased significantly by ANG II blockade as well as by cobalt.
Fig. 1.
Changes in renal hemodynamics in rats one week after renal ablation and infarction (A/I) under different treatments. A: 1-wk after renal A/I the untreated kidney demonstrated a markedly decreased renal blood flow (RBF). This reduction of RBF was significantly prevented by both dual ANG II blockade with captopril and losartan (C&L) and cobalt chloride (Co). B: untreated 1-wk A/I kidney incurred a significant reduction in glomerular filtration rate (GFR). This decreased GFR was significantly corrected not only by dual ANG II inhibition (C&L) but also by cobalt chloride. Data are means ± SE. *P < 0.05 vs. normal; **P < 0.05 vs. A/I.
Correction of renal metabolic inefficiency by cobalt, DMOG, and ANG II blockade.
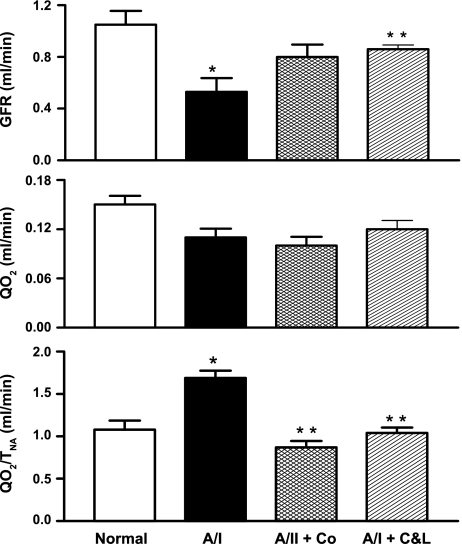
When compared with the normal kidney and despite a reduction of GFR (decreased filtered load and TNa), total renal oxygen consumption (QO2) was unchanged in the untreated A/I kidney. The resultant elevation of QO2/TNa designates decreased renal metabolic efficiency (Table 1 and Fig. 2). This renal metabolic inefficiency was caused by an increased demand for oxygen in the untreated A/I kidney, as dual ANG II blockade and cobalt treatment significantly increased GFR to normal levels while QO2 remained unchanged (Table 1 and Fig. 2), correcting QO2/TNa to normal values. We conclude that all these renal effects produced by cobalt treatment are due to the activation of the HIF pathway, since cobalt has been widely used as an inducer of HIF-1α both in vivo and in vitro studies (3, 12, 13, 34, 46). To confirm this conclusion, another HIF-1α inducer, DMOG was used in A/I rats. DMOG treatment produced similar renal protective effects, as indexed by improvement of renal function and decreased renal oxygen consumption (Table 1).
Table 1.
Changes in GFR, RBF, QO2, QO2/TNa, mean systemic BP, and HCT in four groups
| Groups | GFR, ml/min | RBF, ml/min | QO2, ml/min | QO2/TNa, ml/mol | BP, mmHg | HCT |
|---|---|---|---|---|---|---|
| Normal (n = 6) | 1.05 ± 0.11 | 6.72 ± 0.47 | 0.15 ± 0.01 | 1.08 ± 0.11 | 98 ± 4 | 45.5 ± 0.3 |
| A/I (n = 9) | 0.53 ± 0.04 | 3.58 ± 0.42 | 0.11 ± 0.01 | 1.69 ± 0.08 | 122 ± 3 | 46 ± 1.6 |
| P | <0.01 vs. normal | <0.01 vs. normal | <0.01 vs. normal | <0.02 vs. normal | ||
| A/I + C&L (n = 12) | 0.87 ± 0.03 | 6.53 ± 0.20 | 0.12 ± 0.01 | 1.03 ± 0.06 | 81 ± 3 | 44 ± 0.7 |
| P | <0.05 vs. A/I | <0.01 vs. A/I | <0.01 vs. A/I | <0.01 vs. A/I | ||
| A/I + Co (n = 6) | 0.80 ± 0.09 | 4.80 ± 0.46 | 0.10 ± 0.01 | 0.87 ± 0.07 | 103 ± 10 | 52 ± 0.8 |
| P | <0.05 vs. A/I | <0.05 vs. normal, A/I + C&L | <0.01 vs. A/I | <0.05 vs. AI + C&L | <0.05 vs. normal, A/I | |
| <0.01 vs. A/I + C&L | ||||||
| A/I + DMOG (n = 7) | 1.48 ± 0.19 | 7.20 ± 0.55 | 0.19 ± 0.03 | 1.16 ± 0.05 | 143 ± 3 | 56 ± 2 |
| P | <0.05 vs. normal | <0.01 vs. A/I, A/I + Co | <0.05 vs. A/I, A/I + C&L, A/I + Co | <0.01 vs. A/I | <0.05 vs. A/I | <0.01 vs. normal, A/I, A/I + C&L |
| A/I, A/I + C&L, A/I + Co | <0.01 vs. normal, A/I + C&L A/I + Co |
Data are means ± SE. GFR, glomerular filtration rate; RBF, renal blood flow; QO2, renal oxygen consumptionl; QO2/TNa, sodium transport efficiency; BP, mean systemic blood pressure; HCT, hematocrit; A/I, 1-wk renal ablation and infarction; A/I + C&L, A/I treated with captopril and losartan; A/I+Co, A/I treated with cobalt chloride; A/I + DMOG, A/I treated with dimethyloxalyglycine rats.
Fig. 2.
Changes in renal metabolic efficiency in rats 1-wk postrenal A/I under different conditions. Despite significant reduction in GFR, total oxygen consumption (QO2) was not significantly reduced in untreated A/I. Therefore, QO2 when factored with total amount of sodium reabsorbed (QO2 /TNa) was significantly elevated, indicating decreased renal metabolic efficiency. Both cobalt chloride and ANG II inhibition with captopril and losartan increased GFR to normal levels without a parallel increase in QO2, resulting in a normal values of QO2/TNa. Data are means ± SE. *P < 0.05 vs. normal; **P < 0.05 vs. A/I.
Fig. 3.
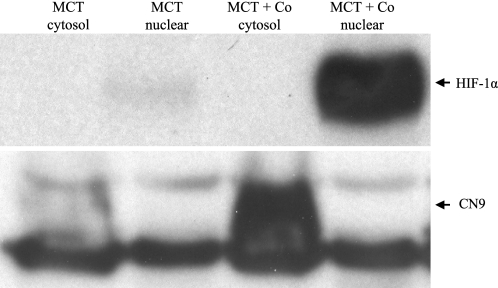
Western blot analysis of activation of hypoxia inducible factor (HIF)-1 by cobalt chloride in murine cortical proximal tubular (MCT) cells. MCT cells were cultured in DMEM with low glucose and supplemented with 10% FCS. To activate HIF, cobalt chloride was added to the confluent culture at 200 μM for 12 h. Proteins (70 ug) from cytosol and nuclei were electrophorertically separated on 7% glycine-Tris gel, transferred to PVDF membrane, and detected with ECL plus. Both HIF-1α (nuclear extraction) and its prototypical target protein, carbonic anhydrase IX (CN9, cytosol extraction), were clearly detected in MCT cells treated with cobalt chloride.
Hydroxylation of proline residues on HIF-α by prolyl hydroxylases initiates degradation of HIF-α, and hydroxylation of an asparagine residue in the C-terminal transactivation domain of HIF-α by asparaginyl hydroxlase directly prevents its interaction with its coactivator p300, leading to the HIF transactivation. Both HIF-α prolyl and asparaginyl hydroxylases are dioxygenases that are iron dependent and require O2 and 2-oxoglutarate (α-ketoglutarate, the tricarboxylic-acid-cycle intermediate) as substrates for the hydroxylation reaction (21, 29) in which one oxygen atom is inserted into a proline residue and the other is used to convert 2-oxoglutarate into succinate (35). It has been proposed that cobalt inactivates the hydroxylases by occupying the iron-binding center of the enzyme (12). DMOG, an analog of 2-oxoglutarate, inhibits the hydroxylases via binding to the 2-oxoglutarate binding site of the enzymes.
HIF activation by HIF-1α inducers in vitro and in vivo.
With the use of murine cortical proximal tubular cells in culture, administration of CoCl2 at 200 μM for 12 h induced not only HIF-1α protein expression but also carbonic anhydrase 9 (CN9), a prototype HIF-1 target protein, as demonstrated by Western blot (Fig. 3), indicating HIF pathway activation by cobalt in cultured renal proximal tubular cells occurred as early as at 8 h after cobalt stimulation. HIF-1α was undetectable in renal tissue in any groups at any time windows by the Western blot applied for the detection of HIF-1α in cell culture. Induction of HIF-1α in renal tissue by both cobalt and DMOG at day 7 after A/I was visualized by Western blot only after immunoprecipitation of 500 μg of cortical proteins with anti-HIF-1α (Fig. 4). Induction of CN9 in renal cortex was also detectable in A/I kidney treated with cobalt as early as at 18 h after cobalt treatment, suggesting an early HIF activation (Fig. 5).
Fig. 4.
Immunoprecipitation and Western blot analysis of induction of HIF-1α by both HIFα stabilizers, cobalt chloride and dimethyloxalyglycine (DMOG), in renal cortex from rats 1 wk after renal A/I HIF-1α is detectable by Western blot in renal cortex after immunoprecipitation of 500 μg of proteins with anti-HIF-1α. When compared with either normal (lane 1) or untreated 1-wk A/I (lane 2), ANG II blockade (lane 3) significantly reduced HIF-1α expression and both cobalt (lane 4) and DMOG (lane 5) increased HIF-1α protein expression. Immunoblot represents 4 repeated detections.
Fig. 5.
Western blot analysis of induction of carbonic anhydrase IX (CN9) by cobalt chloride in renal cortex from rats at early renal A/I. Expression of carbonic anhydrase IX (CN9), a HIF-1 protoypical target, can been seen in 18-h A/I kidneys treated with cobalt, suggesting an early HIF pathway activation in vivo by cobalt chloride.
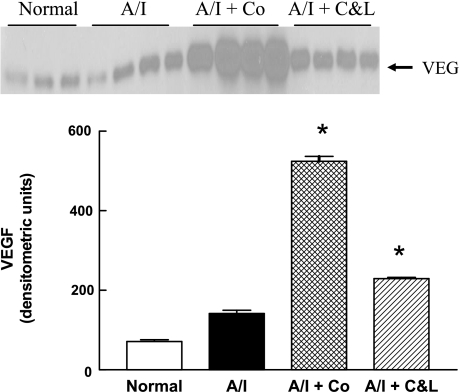
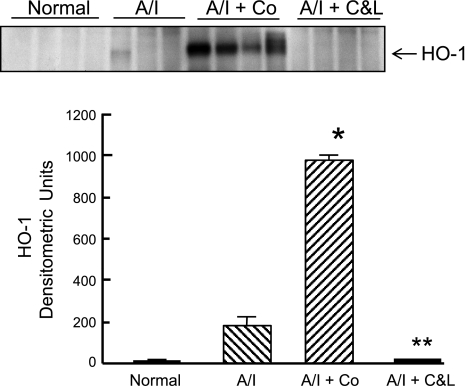
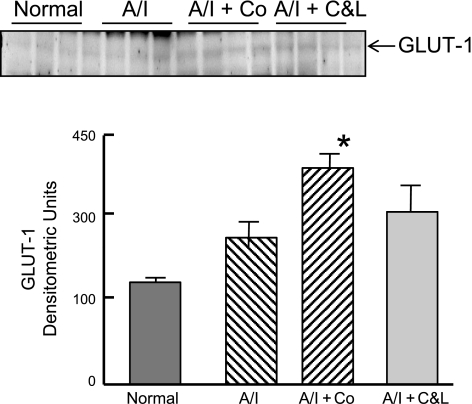
The expression of other HIF-induced targets was also investigated at either protein level by Western blot or mRNA level for certain molecules by real-time PCR. As shown in Fig. 6, VEGF protein was constitutively expressed in normal kidney, tended to increase in untreated A/I kidneys, further increased in ANG II-blocked kidneys and demonstrated maximal expression in A/I kidneys treated with cobalt. HO-1 protein (Fig. 7) was undetectable in normal kidneys, induced in the untreated group, suppressed in the ANG II-inhibited group, and greatly induced in the cobalt-treated group. When GLUT1 was examined, the pattern was similar to that observed with VEGF, whereby it was modestly elevated in A/I kidneys and further increased in the cobalt and ANG II blockade kidneys (Fig. 8).
Fig. 6.
Western blot analysis of VEGF in proteins extracted from renal cortex of normal rats and untreated, cobalt chloride-treated, and captopril and losartan-treated rats 1-wk postrenal A/I. VEGF was constitutively expressed in normal renal cortex and tended to increase (2-fold) in untreated A/I but did not reach statistical significance. VEGF protein was significantly increased (3-fold) by ANG II inhibition with captopril and losartan and substantially increased (>7 fold) by cobalt chloride. Data are means ± SE. *P < 0.01 vs. normal.
Fig. 7.
Western blot analysis of heme oxygenase-1 (HO-1) induction in renal cortex of normal rats and untreated, cobalt chloride-treated, and captopril and losartan-treated rats 1-wk postrenal A/I. Untreated 1-wk A/I kidney cortex showed signs of HO-1 induction but was not statistically significant from the normal. HO-1 was not induced in the renal cortex from A/I rats receiving captopril and losartan. However, HO-1 was dramatically upregulated (54-fold) in the A/I kidney treated with cobalt chloride. Data are means ± SE. *P < 0.01 vs. normal; **P < 0.05 vs. A/I.
Fig. 8.
Western blot analysis of GLUT1. Induction of GLUT1 expression in renal cortex of normal rats and untreated, cobalt-treated, and captopril and losartan-treated rats 1-wk postrenal A/I. GLUT1 in A/I + Co was significantly different from A/I but not from A/I + C&L. A/I + C&L was not significantly different from A/I. Data are means ± SE. *P < 0.05 vs. A/I.
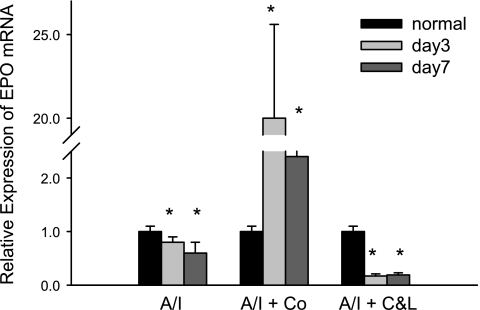
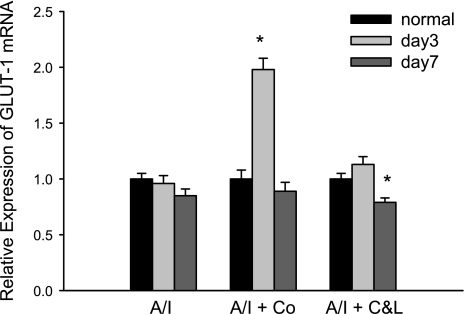
Cobalt-treated kidneys were associated with increased Epo mRNA by >20 fold at day 3, while untreated kidneys demonstrated a 30% reduction of Epo, and ANG II blocked A/I kidney exhibited an 80% reduction of Epo mRNA (Fig. 9). Epo mRNA returned to lower levels of expression by day 7. Likewise, expression of GLUT1 mRNA peaked at 3 days of cobalt treatment in A/I animals (Fig. 10) but was relatively unaffected by combined ANG II blockade. Both of these HIF target genes maximally increased in expression in A/I kidneys treated with cobalt, and combined ANG II blockade either decreased mRNA expression or remained unchanged.
Fig. 9.
Real-time PCR analysis of erythropoietin (Epo) gene expression in renal cortex from normal, untreated, cobalt chloride-treated, and captopril and losartan-treated rats 1-wk postrenal A/I. Real-time reactions were performed in triplicate for both the target gene and GAPDH as a housekeeping control. Relative expression was calculated using delta ΔCT method. Numbers show the fold changes relative to the normal mRNA expression levels normalized to GAPDH. Data are means ± SE (n = 8 for each group). *P < 0.01 vs. normal. In untreated A/I kidney, Epo mRNA was slightly but significantly decreases at day 3 and day 7. Cobalt chloride greatly increases Epo mRNA by 20-fold at day 3 and >2-fold at day 7. ANG II blockade (C&L) dramatically reduced Epo mRNA levels when compared with the normal.
Fig. 10.
Real-time PCR analysis of GLUT1 gene expression in renal cortex from normal, untreated, cobalt chloride-treated, and captopril and losartan-treated rats 1-wk postrenal A/I. Quantification of PCR was done using the comparative CT method and reported as fold difference relative to the calibrator cDNA (GAPDH). Data are means ± SE (n = 8 for each group). GLUT1 mRNA was unchanged at either day 3 or day 7 in untreated A/I kidney cortex. Cobalt chloride significantly increased GLUT1 mRNA by 2-fold at day 3 and returned to normal levels at day 7. ANG II inhibition (C&L) significantly decreased GLUT1 mRNA at day 7. *P < 0.01 vs. normal.
Renal cell proliferation.
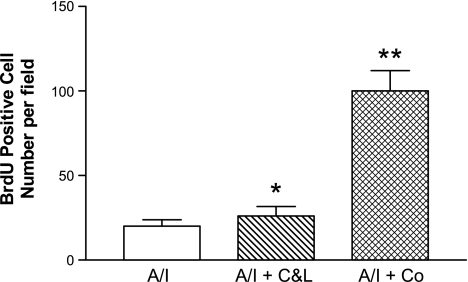
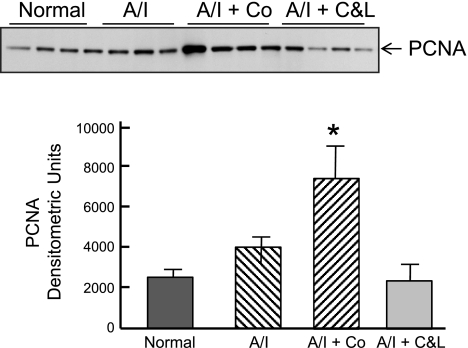
We compared renal cortical cell proliferation among four groups by quantification of BrdU incorporation. We counted BrdU-positive cells in whole cortex of each section. The estimation of the mean for BrdU-positive cells was based on 20 of 10 ×0.25 fields that showed higher BrdU-positive cell numbers in each group, not including scar areas. As shown in Fig. 11, in normal kidney cortex BrdU-positive cells are negligible. There was cortical cell proliferation in untreated A/I kidney cortex. Cortical cell proliferation was slightly but significantly increased by dual ANG blockade (BrdU-positive cells 26 ± 1.9 vs. 20 ± 1.9/per field). Cobalt treatment markedly increased the number of cortical BrdU-positive cells by fivefold, when compared with untreated A/I kidney. Cellular proliferation occurred in glomerular, tubular, and interstitial cells. When examined by PCNA, the results differed somewhat from those by BrdU. PCNA was increased in untreated A/I kidneys and those treated with cobalt to approximately the same degree (Fig. 12). ANG II blockade resulted in normal levels of PCNA. The differences between PCNA and BrdU results may relate to the fact that PCNA was detected on day 7 and BrdU results represent cell proliferation integrated over the last 5 days.
Fig. 11.
Renal cortical cell proliferation shown by bromodeoxyuridine (BrdU) incorporation. Rats received BrdU (50 mg/kg ip daily) for the last 5 days. BrdU was stained using a Zamed kit. Means of BrdU-positive cells were calculated using twenty ×10 fields of higher counting number from each group. Data are means ± SE. *P < 0.05 vs. A/I; **P < 0.01 vs. A/I and A/I + C&L.
Fig. 12.
Western blot analysis of proliferating cell nuclear antigen (PCNA) in renal cortex from normal, untreated 1-wk renal A/I, A/I treated with cobalt chloride, and A/I treated with captopril and losartan. PCNA protein expression tended to increase at 1 wk in A/I kidney cortex relative to normal kidney but was not significant. A/I + C&L levels were not different than normal kidneys. PCNA expression in the A/I + Co group was significantly different from A/I and A/I + C&L. Data are means ± SE. *P < 0.01.
DISCUSSION
The major finding of this study is that activation of the HIF pathway and ANG II blockade improved renal hemodynamics and corrected renal metabolic efficiency by different molecular mechanisms. HIF activation in A/I kidney treated with either cobalt or DMOG was demonstrated by dramatic increases in the expression of HIF-1α protein and increases in the expressions of the HIF targets CN9, VEGF, HO-1, GLUT1, and Epo. In contrast, the HIF pathway was in a deactivated status shown by significant decreases in the expressions of HIF-1α protein and Epo mRNA.
The purpose of these studies was to identify proteins linked to HIF that serve as indicators as to whether the beneficial effects of combined ANG II blockade also result from expression of these proteins. It is recognized that hundreds of mammalian genes are regulated by HIF, and dozens of these have been established as direct targets by identification of critical hypoxia response element binding sites (11, 40). Several of these target genes act to inhibit oxidative metabolism, e.g., effects on pyruvate dehydrogenase kinase, as well as promote glycolysis, activation of GLUT1, and effects on lactate dehydrogenase (2, 40). The proteins examined in this study may be important to the improvements in metabolic and hemodynamic functions. Clearly, the patterns of protein expression between HIF activation and combined ANG II blockade are not identical, yet the final physiologic and metabolic outcomes are remarkably similar. Similar responses were noted for VEGF and GLUT1 protein expression, but the HO-1 responses differed markedly. Cobalt increased HO-1 and ANG II blockade markedly decreased HO-1. Gene expression of Epo and GLUT1 by quantitative RT-PCR differed markedly between the two regimens at two time periods.
Our current results suggest that, at 1 wk, VEGF increases in the untreated remnant kidney. Treatments with either cobalt or captopril and losartan further magnified the expression of VEGF, the magnitude of increase being considerably greater with induction of HIF. These effects correlated with normalization of oxygen consumption and improvement in both GFR and RBF. Two different treatments produced similar effects with different mechanisms of VEGF induction. Induction of VEGF in cobalt-treated A/I kidney is HIF dependent, whereas increased VEGF in ANG II blocked A/I kidney is the consequence of the inhibition of ANG II type I receptor. The main VEGF effects on vasculature are angiogenesis and vasodilation (38). VEGF is produced in the normal kidney at modest levels, with VEGF receptors expressed on endothelial cells of the kidney. Via interaction with its receptors, VEGF promotes endothelial cell proliferation, migration, survival, and new vessel formation. Increased VEGF levels may have contributed to the increase in cell proliferation as indexed by increased BrdU incorporation and increased PCNA after cobalt induction of HIF. A vasodilatory effect of VEGF results from upregulation of the production of nitric oxide (NO). This VEGF-induced increase in NO production also exerts an effect on the regulation of mitochondrial oxygen consumption (6, 26). A reduction in VEGF protein expression has been observed 2 wk after surgery in the remnant kidney model (25), and this observation may be the result of the progressive glomerulosclerosis and tubulointerstitial fibrosis. (38). VEGF administration results in increases in renal endothelial cell proliferation, activation of endothelial nitric oxide synthases, improvement of renal function, and reduction of renal fibrosis (24). However, we do not suggest that these physiologic and metabolic corrections have been proven solely the result of increases in VEGF, as other proteins are likely involved. HO-1, the inducible form of hemeoxygenase, catalyzes heme to produce iron, carbon monoxide (CO), and biliverdin, which is further converted to bilirubin. Bilirubin is an important antioxidant. CO is thought to be essential to regulating vascular relaxation and mitochondrial oxygen consumption in a manner similar to NO. Increased HO-1 may also exert effects by limiting or decreasing the supply of porphyrins. We demonstrate herein that HO-1 was substantially increased with cobalt treatment. Increased production of CO and bilirubin due to upregulation of HO-1 could contribute several effects, including enhanced renal vasodilation, reduced oxygen consumption, and reductions in inflammation. Combined ANG II blockade completely prevented any rise in HO-1 by eliminating the normally stimulatory effects of ANG II on HO-1 (1, 18). Taken in the aggregate, it seems unlikely that the beneficial effects of cobalt treatment and HIF activation were mediated principally by induction of HO-1, since ANG II blockade also corrected the metabolic and hemodynamic effects in the absence of significant influences on HO-1. The levels of HO-1 during cobalt treatment were quite clearly increased and different from both the untreated and combined ANG II blockade animals. The changes in GLUT1 protein expression were similar with both treatments and are part of a variety of metabolic alterations that occur with HIF-induced activation of target proteins. The kidney is the primary organ for the production of Epo, and regulation of Epo expression is mainly at the transcriptional level. It is well documented that Epo mRNA is upregulated by HIF in response to hypoxia (4, 41, 42). Recent studies (23, 27) have shown that hypoxic induction of Epo is suppressed by inflammatory cytokines via activation of other inhibitory transcription factors. Therefore, in the diseased kidney, Epo gene expression is determined by the balance between positive and negative transcription factors. It is no surprise that a characteristic of cobalt-treated A/I kidney is a striking increase in Epo mRNA, while the untreated group demonstrates a significant early decrease in Epo mRNA. The latter is likely due to the inflammatory cytokines generated after A/I. The negative influence from the inflammatory cytokines might overcome the positive influence from HIF, resulting in a reduction of Epo in A/I kidney at early stages. Combined ANG II blockade was associated with a further reduction in Epo mRNA, which is an unexpected finding but is consistent with the observations that ACEI is linked to worsening anemia in patients with CKD on dialysis (33) and to lowering serum Epo levels in renal transplant recipients (15). Our finding provides a mechanism that transcriptional regulation of Epo gene is ANG II dependent and probably requires the participation of AT1R (14). In addition to erythropoiesis, Epo exerts a mitogenic effect on nonerythroid tissues via interaction with its receptors that are widely expressed in a variety of tissues, including kidneys (47).
In the cobalt-treated A/I kidney, we observed that there was a profound proliferation of glomerular, tubular, vascular, and interstitial cells (Deng A, Blantz R, unpublished observations), while the untreated kidney exhibited modest tubular cell proliferation, which was not influenced by combined ANG II inhibition. BrdU expression indicates cell division or proliferation. Studies examining PCNA showed similar findings except that combined ANG II blockade was associated with reductions in PCNA. PCNA does not necessarily indicate cell division. We assume that this extensive renal parenchymal cell proliferation may be associated with the mitogenic effectsof Epo. Somehow these events were associated with normalization of both metabolic activity and renal hemodynamics.
The current results suggest that induction of HIF, as identified by increased HIF-1α protein expression and by downstream HIF-1 products, VEGF, HO-1, GLUT1, and Epo, acts to improve renal hemodynamics and renal function and corrects renal metabolic efficiency. Results suggest that HIF induction also promotes renal cell growth, stimulates angiogenesis, and reduces inflammation. We have shown that in early experimental CKD major activation of HIF pathway is renal protective. This is in accord with recent data from Bernhardt et al. (5), where HIF-1α induction provided protective effects and prolonged survival in a model of kidney transplantation and ischemia, and from Tanaka et al. (45) and by Song et al. (43) in this model at a later stage. Thus, in addition to ANG II blockade, HIF induction may present a major mechanism for kidney protection and to ameliorate disease progression of CKD. Since the patterns of protein expression differ between induction of HIF and combined ANG II blockade, it is intriguing to speculate that some form of combined therapy might be highly beneficial, either additive or synergistic to progression of CKD. The mechanisms of protection of combined ANG II blockade and HIF-1 appear to differ. Further studies are required to define the specific HIF-1-induced proteins and mechanisms related to ANG II blockade that produce major physiologic and metabolic benefits in this experimental model of CKD.
GRANTS
This work was supported by the National Institute of Diabetes and Digestive and Kidney Disease Grants RO1-DK-28602 and P30-DK-079337 and includes the Department of Veterans Affairs Research Service. Prabhleen Singh was supported by grants through the National Kidney Foundation and now is funded by a K08 award from the National Institutes of Health (K08-DK-084305). T. Tang was supported by Grant-in-Aid from the American Heart Association Western States Affiliate.
DISCLOSURES
No conflicts of interest, financial or otherwise, are declared by the author(s).
ACKNOWLEDGMENTS
We thank Dr. Nissi M. Varki's Histology and Immunohistochemistry Shared Resource Group at the University of California San Diego Moores Cancer Center for excellent technical BrdU stain services.
REFERENCES
- 1.Aizawa T, Ishizaka N, Taguchi J, Nagai R, Mori I, Tang SS, Ingelfinger JR, Ohno M. Heme oxygenase-1 is upregulated in the kidney of angiotensin II-induced hypertensive rats: possible role in renoprotection. Hypertension 35: 800– 806, 2000 [DOI] [PubMed] [Google Scholar]
- 2.Archer SL, Gomberg-Maitland M, Maitland ML, Rich S, Garcia JG, Weir EK. Mitochondrial metabolism, redox signaling, and fusion: a mitochondria-ROS-HIF-1alpha-Kv1.5 O2-sensing pathway at the intersection of pulmonary hypertension and cancer. Am J Physiol Heart Circ Physiol 294: H570– H578, 2008 [DOI] [PubMed] [Google Scholar]
- 3.Badr GA, Zhang JZ, Tang J, Kern TS, Ismail-Beigi F. Glut1 and glut3 expression, but not capillary density, is increased by cobalt chloride in rat cerebrum and retina. Brain Res Mol Brain Res 64: 24– 33, 1999 [DOI] [PubMed] [Google Scholar]
- 4.Beck I, Weinmann R, Caro J. Characterization of hypoxia-responsive enhancer in the human erythropoietin gene shows presence of hypoxia-inducible 120-Kd nuclear DNA-binding protein in erythropoietin-producing and nonproducing cells. Blood 82: 704– 711, 1993 [PubMed] [Google Scholar]
- 5.Bernhardt WM, Gottmann U, Doyon F, Buchholz B, Campean V, Schodel J, Reisenbuechler A, Klaus S, Arend M, Flippin L, Willam C, Wiesener MS, Yard B, Warnecke C, Eckardt KU. Donor treatment with a PHD-inhibitor activating HIFs prevents graft injury and prolongs survival in an allogenic kidney transplant model. Proc Natl Acad Sci USA 106: 21276– 21281, 2009 [DOI] [PMC free article] [PubMed] [Google Scholar]
- 6.Brown GC, Borutaite V. Nitric oxide inhibition of mitochondrial respiration and its role in cell death. Free Radic Biol Med 33: 1440– 1450, 2002 [DOI] [PubMed] [Google Scholar]
- 7.Castilla MA, Caramelo C, Gazapo RM, Martin O, Gonzalez-Pacheco FR, Tejedor A, Bragado R, Arroyo MV. Role of vascular endothelial growth factor (VEGF) in endothelial cell protection against cytotoxic agents. Life Sci 67: 1003– 1013, 2000 [DOI] [PubMed] [Google Scholar]
- 8.Deng A, Miracle CM, Lortie M, Satriano J, Gabbai FB, Munger KA, Thomson SC, Blantz RC. Kidney oxygen consumption, carbonic anhydrase, and proton secretion. Am J Physiol Renal Physiol 290: F1009– F1015, 2006 [DOI] [PubMed] [Google Scholar]
- 9.Deng A, Miracle CM, Suarez JM, Lortie M, Satriano J, Thomson SC, Munger KA, Blantz RC. Oxygen consumption in the kidney: effects of nitric oxide synthase isoforms and angiotensin II. Kidney Int 68: 723– 730, 2005 [DOI] [PubMed] [Google Scholar]
- 10.Deng A, Tang T, Singh P, Wang C, Satriano J, Thomson SC, Blantz RC. Regulation of oxygen utilization by angiotensin II in chronic kidney disease. Kidney Int 75: 197– 204, 2009 [DOI] [PMC free article] [PubMed] [Google Scholar]
- 11.Elvidge GP, Glenny L, Appelhoff RJ, Ratcliffe PJ, Ragoussis J, Gleadle JM. Concordant regulation of gene expression by hypoxia and 2-oxoglutarate-dependent dioxygenase inhibition: the role of HIF-1alpha, HIF-2alpha, and other pathways. J Biol Chem 281: 15215– 15226, 2006 [DOI] [PubMed] [Google Scholar]
- 12.Epstein AC, Gleadle JM, McNeill LA, Hewitson KS, O'Rourke J, Mole DR, Mukherji M, Metzen E, Wilson MI, Dhanda A, Tian YM, Masson N, Hamilton DL, Jaakkola P, Barstead R, Hodgkin J, Maxwell PH, Pugh CW, Schofield CJ, Ratcliffe PJ. C. elegans EGL-9 and mammalian homologs define a family of dioxygenases that regulate HIF by prolyl hydroxylation. Cell 107: 43– 54, 2001 [DOI] [PubMed] [Google Scholar]
- 13.Goldberg MA, Dunning SP, Bunn HF. Regulation of the erythropoietin gene: evidence that the oxygen sensor is a heme protein. Science 242: 1412– 1415, 1988 [DOI] [PubMed] [Google Scholar]
- 14.Gossmann J, Burkhardt R, Harder S, Lenz T, Sedlmeyer A, Klinkhardt U, Geiger H, Scheuermann EH. Angiotensin II infusion increases plasma erythropoietin levels via an angiotensin II type 1 receptor-dependent pathway. Kidney Int 60: 83– 86, 2001 [DOI] [PubMed] [Google Scholar]
- 15.Gossmann J, Thurmann P, Bachmann T, Weller S, Kachel HG, Schoeppe W, Scheuermann EH. Mechanism of angiotensin converting enzyme inhibitor-related anemia in renal transplant recipients. Kidney Int 50: 973– 978, 1996 [DOI] [PubMed] [Google Scholar]
- 16.Gunaratnam L, Bonventre JV. HIF in kidney disease and development. J Am Soc Nephrol 20: 1877– 1887, 2009 [DOI] [PubMed] [Google Scholar]
- 17.Harris DC, Chan L, Schrier RW. Remnant kidney hypermetabolism and progression of chronic renal failure. Am J Physiol Renal Fluid Electrolyte Physiol 254: F267– F276, 1988 [DOI] [PubMed] [Google Scholar]
- 18.Haugen EN, Croatt AJ, Nath KA. Angiotensin II induces renal oxidant stress in vivo and heme oxygenase-1 in vivo and in vitro. Kidney Int 58: 144– 152, 2000 [DOI] [PubMed] [Google Scholar]
- 19.Haverty TP, Kelly CJ, Hines WH, Amenta PS, Watanabe M, Harper RA, Kefalides NA, Neilson EG. Characterization of a renal tubular epithelial cell line which secretes the autologous target antigen of autoimmune experimental interstitial nephritis. J Cell Biol 107: 1359– 1368, 1988 [DOI] [PMC free article] [PubMed] [Google Scholar]
- 20.Heidbreder M, Frohlich F, Johren O, Dendorfer A, Qadri F, Dominiak P. Hypoxia rapidly activates HIF-3alpha mRNA expression. FASEB J 17: 1541– 1543, 2003 [DOI] [PubMed] [Google Scholar]
- 21.Hewitson KS, McNeill LA, Elkins JM, Schofield CJ. The role of iron and 2-oxoglutarate oxygenases in signalling. Biochem Soc Trans 31: 510– 515, 2003 [DOI] [PubMed] [Google Scholar]
- 22.Heyman SN, Khamaisi M, Rosen S, Rosenberger C. Renal parenchymal hypoxia, hypoxia response and the progression of chronic kidney disease. Am J Nephrol 28: 998– 1006, 2008 [DOI] [PubMed] [Google Scholar]
- 23.Imagawa S, Nakano Y, Obara N, Suzuki N, Doi T, Kodama T, Nagasawa T, Yamamoto M. A GATA-specific inhibitor (K-7174) rescues anemia induced by IL-1beta, TNF-alpha, or l-NMMA. FASEB J 17: 1742– 1744, 2003 [DOI] [PubMed] [Google Scholar]
- 24.Kang DH, Hughes J, Mazzali M, Schreiner GF, Johnson RJ. Impaired angiogenesis in the remnant kidney model: II. Vascular endothelial growth factor administration reduces renal fibrosis and stabilizes renal function. J Am Soc Nephrol 12: 1448– 1457, 2001 [DOI] [PubMed] [Google Scholar]
- 25.Kang DH, Joly AH, Oh SW, Hugo C, Kerjaschki D, Gordon KL, Mazzali M, Jefferson JA, Hughes J, Madsen KM, Schreiner GF, Johnson RJ. Impaired angiogenesis in the remnant kidney model: I. Potential role of vascular endothelial growth factor and thrombospondin-1. J Am Soc Nephrol 12: 1434– 1447, 2001 [DOI] [PubMed] [Google Scholar]
- 26.Koivisto A, Pittner J, Froelich M, Persson AE. Oxygen-dependent inhibition of respiration in isolated renal tubules by nitric oxide. Kidney Int 55: 2368– 2375, 1999 [DOI] [PubMed] [Google Scholar]
- 27.La Ferla K, Reimann C, Jelkmann W, Hellwig-Burgel T. Inhibition of erythropoietin gene expression signaling involves the transcription factors GATA-2 and NF-kappaB. FASEB J 16: 1811– 1813, 2002 [DOI] [PubMed] [Google Scholar]
- 28.Maiese K, Li F, Chong ZZ. New avenues of exploration for erythropoietin. JAMA 293: 90– 95, 2005 [DOI] [PMC free article] [PubMed] [Google Scholar]
- 29.Mole DR, Schlemminger I, McNeill LA, Hewitson KS, Pugh CW, Ratcliffe PJ, Schofield CJ. 2-Oxoglutarate analogue inhibitors of HIF prolyl hydroxylase. Bioorg Med Chem Lett 13: 2677– 2680, 2003 [DOI] [PubMed] [Google Scholar]
- 30.Nagel S, Papadakis M, Chen R, Hoyte LC, Brooks KJ, Gallichan D, Sibson NR, Pugh C, Buchan AM. Neuroprotection by dimethyloxalylglycine following permanent and transient focal cerebral ischemia in rats. J Cereb Blood Flow Metab 2010April21 [Epub ahead of print] [DOI] [PMC free article] [PubMed] [Google Scholar]
- 31.Nangaku M. Chronic hypoxia and tubulointerstitial injury: a final common pathway to end-stage renal failure. J Am Soc Nephrol 17: 17– 25, 2006 [DOI] [PubMed] [Google Scholar]
- 32.Nath KA, Croatt AJ, Hostetter TH. Oxygen consumption and oxidant stress in surviving nephrons. Am J Physiol Renal Fluid Electrolyte Physiol 258: F1354– F1362, 1990 [DOI] [PubMed] [Google Scholar]
- 33.Onoyama K, Sanai T, Motomura K, Fujishima M. Worsening of anemia by angiotensin converting enzyme inhibitors and its prevention by antiestrogenic steroid in chronic hemodialysis patients. J Cardiovasc Pharmacol 13, Suppl 3: S27– 30, 1989 [DOI] [PubMed] [Google Scholar]
- 34.Piret JP, Mottet D, Raes M, Michiels C. CoCl2, a chemical inducer of hypoxia-inducible factor-1, and hypoxia reduce apoptotic cell death in hepatoma cell line HepG2. Ann NY Acad Sci 973: 443– 447, 2002 [DOI] [PubMed] [Google Scholar]
- 35.Prescott AG, Lloyd MD. The iron(II) and 2-oxoacid-dependent dioxygenases and their role in metabolism. Nat Prod Rep 17: 367– 383, 2000 [DOI] [PubMed] [Google Scholar]
- 36.Sarnak MJ, Levey AS, Schoolwerth AC, Coresh J, Culleton B, Hamm LL, McCullough PA, Kasiske BL, Kelepouris E, Klag MJ, Parfrey P, Pfeffer M, Raij L, Spinosa DJ, Wilson PW. Kidney disease as a risk factor for development of cardiovascular disease: a statement from the American Heart Association Councils on Kidney in Cardiovascular Disease, High Blood Pressure Research, Clinical Cardiology, and Epidemiology and Prevention. Circulation 108: 2154– 2169, 2003 [DOI] [PubMed] [Google Scholar]
- 37.Schiffer M, Park JK, Tossidou I, Bartels J, Shushakova N, Menne J, Fliser D. Erythropoietin prevents diabetes-induced podocyte damage. Kidney Blood Press Res 31: 411– 415, 2008 [DOI] [PubMed] [Google Scholar]
- 38.Schrijvers BF, Flyvbjerg A, De Vriese AS. The role of vascular endothelial growth factor (VEGF) in renal pathophysiology. Kidney Int 65: 2003– 2017, 2004 [DOI] [PubMed] [Google Scholar]
- 39.Schweda F, Blumberg FC, Schweda A, Nabel C, Holmer SR, Riegger GA, Pfeifer M, Kramer BK. Effects of chronic hypoxia on renal PDGF-A, PDGF-B, and VEGF gene expression in rats. Nephron 86: 161– 166, 2000 [DOI] [PubMed] [Google Scholar]
- 40.Semenza GL. Oxygen-dependent regulation of mitochondrial respiration by hypoxia-inducible factor 1. Biochem J 405: 1– 9, 2007 [DOI] [PubMed] [Google Scholar]
- 41.Semenza GL, Nejfelt MK, Chi SM, Antonarakis SE. Hypoxia-inducible nuclear factors bind to an enhancer element located 3′ to the human erythropoietin gene. Proc Natl Acad Sci USA 88: 5680– 5684, 1991 [DOI] [PMC free article] [PubMed] [Google Scholar]
- 42.Semenza GL, Wang GL. A nuclear factor induced by hypoxia via de novo protein synthesis binds to the human erythropoietin gene enhancer at a site required for transcriptional activation. Mol Cell Biol 12: 5447– 5454, 1992 [DOI] [PMC free article] [PubMed] [Google Scholar]
- 43.Song YR, You SJ, Lee YM, Chin HJ, Chae DW, Oh YK, Joo KW, Han JS, Na KY. Activation of hypoxia-inducible factor attenuates renal injury in rat remnant kidney. Nephrol Dial Transplant 25: 77– 85 [DOI] [PubMed] [Google Scholar]
- 44.Suga S, Kim YG, Joly A, Puchacz E, Kang DH, Jefferson JA, Abraham JA, Hughes J, Johnson RJ, Schreiner GF. Vascular endothelial growth factor (VEGF121) protects rats from renal infarction in thrombotic microangiopathy. Kidney Int 60: 1297–1308, 2001 [DOI] [PubMed] [Google Scholar]
- 45.Tanaka T, Kojima I, Ohse T, Ingelfinger JR, Adler S, Fujita T, Nangaku M. Cobalt promotes angiogenesis via hypoxia-inducible factor and protects tubulointerstitium in the remnant kidney model. Lab Invest 85: 1292– 1307, 2005 [DOI] [PubMed] [Google Scholar]
- 46.Wang GL, Semenza GL. Desferrioxamine induces erythropoietin gene expression and hypoxia-inducible factor 1 DNA-binding activity: implications for models of hypoxia signal transduction. Blood 82: 3610– 3615, 1993 [PubMed] [Google Scholar]
- 47.Westenfelder C, Biddle DL, Baranowski RL. Human, rat, and mouse kidney cells express functional erythropoietin receptors. Kidney Int 55: 808– 820, 1999 [DOI] [PubMed] [Google Scholar]


