

Abstract
5′-Methylthioadenosine/S-adenosylhomocysteine (MTA/SAH) nucleosidase (MTAN) plays a key role in the methionine-recycling pathway of bacteria and plants. Despite extensive structural and biochemical studies, the molecular mechanism of substrate specificity for MTAN remains an outstanding question. Bacterial MTANs show comparable efficiency in hydrolyzing MTA and SAH, while the plant enzymes select preferentially for MTA, with either no or significantly reduced activity towards SAH. Bacterial and plant MTANs show significant conservation in the overall structure, and the adenine- and ribose-binding sites. The observation of a more constricted 5′-alkylthio binding site in Arabidopsis thaliana AtM-TAN1 and AtMTAN2, two plant MTAN homologues, led to the hypothesis that steric hindrance may play a role in substrate selection in plant MTANs. We show using isothermal titration calorimetry that SAH binds to both Escherichia coli MTAN (EcMTAN) and AtMTAN1 with comparable micromolar affinity. To understand why AtMTAN1 can bind but not hydrolyze SAH, we determined the structure of the protein–SAH complex at 2.2 Å resolution. The lack of catalytic activity appears to be related to the enzyme’s inability to bind the substrate in a catalytically competent manner. The role of dynamics in substrate selection was also examined by probing the amide proton exchange rates of EcMTAN and AtMTAN1 via deuterium–hydrogen exchange coupled mass spectrometry. These results correlate with the B factors of available structures and the thermodynamic parameters associated with substrate binding, and suggest a higher level of conformational flexibility in the active site of EcMTAN. Our results implicate dynamics as an important factor in substrate selection in MTAN.
Keywords: 5′-Methylthioadenosine/S-adenosylhomocysteine nucleosidase, Dynamics, Substrate specificity, Deuterium–hydrogen exchange coupled, mass spectrometry, Isothermal titration calorimetry
1. Introduction
5′-Methylthioadenosine/S-adenosylhomocysteine nucleosidase (MTAN) plays an essential role in multiple metabolic pathways in bacteria and plants. In bacteria, MTAN is dual-substrate specific and is responsible for the hydrolysis of 5′-methylthioadenosine (MTA) and S-adenosylhomocysteine (SAH) to adenine and their corresponding thioriboses (Fig. 1) (Cornell et al., 1996; Singh et al., 2006; Della Ragione et al., 1985). Hydrolysis of MTA is a key step in the recycling pathway of methionine, an essential amino acid that is energetically expensive to synthesize (Sufrin et al., 1995; Riscoe et al., 1989). Accumulation of MTA also leads to negative feedback inhibition of polyamine biosynthesis (Pajula and Raina, 1979; Raina et al., 1982) and biological methylation (Borchardt et al., 1986). Efficient functioning of MTAN is also important for quorum sensing because the metabolic product of SAH hydrolysis, S-ribosylhomocysteine, serves as a substrate for the production of autoinducer-2, which has been implicated in intra- and interspecies communication (Schauder et al., 2001; Chen et al., 2002).
Fig. 1.
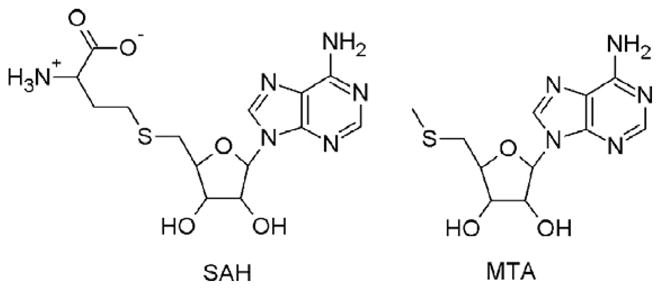
Structures of S-adenosylhomocysteine (SAH) and 5′-methylthioadenosine (MTA).
In plants, the methionine-recycling pathway is conjugated to the synthesis of ethylene, nicotianamine and phytosiderophores, which release MTA as a byproduct of the reactions (Burstenbinder et al., 2007; Baur and Yang, 1972; Roje, 2006). Plant MTANs play a dual role of preventing the accumulation of inhibitory MTA and ensuring efficient salvage of the nucleoside to methionine so that high levels of S-adenosylmethionine are available for ethylene synthesis (Guranowski et al., 1981). In plant species that produce high levels of ethylene, such as those that are submerged for prolonged periods or that have seasonal fruit ripening, MTAN is thought to be important in seed germination and fruit ripening. Nicotianamine shows high affinity for iron and other transition metals and is important in binding and trafficking these minerals in plants. In graminaceous plants, nicotianamine also serves as a substrate to produce phytosiderophores, which play a key role in iron absorption and transportation (Roje, 2006).
Unlike bacterial MTANs, the plant enzymes appear to be highly specific for MTA. Many plant MTAN homologues are unable to metabolize SAH and those that do show 84–87% reduction in activity relative to the hydrolysis of MTA (Guranowski et al., 1981; Rzewuski et al., 2007; Baxter and Coscia, 1973). Kinetic characterization of the two MTAN homologues found in the thale cress plant, Arabidopsis thaliana, showed that AtMTAN1 is completely inactive towards SAH while AtMTAN2 has 14% activity towards this substrate (Siu et al., 2008a). Structural comparison of AtMTAN1 with the bacterial MTAN homologue from Escherichia coli (EcM-TAN) showed significant conservation in the overall structure (Siu et al., 2008a). Close examination of the active sites suggested that the active site of EcMTAN may be more disordered than that of AtMTAN1 (Siu et al., 2008a). This observation was based on the absence of electron density for four active site residues and higher overall B factors for all active site residues of EcMTAN. Also, when structures that represent the apo ‘open’ conformation of EcMTAN (PDB code: 1JYS) and AtMTAN1 (PDB code: 2QSU) were superimposed with the structures representing the ‘closed’ ligand-bound form (PDB codes: 1NC1 for EcMTAN; 2QTG for AtM-TAN1), more dramatic structural changes were identified in the bacterial enzyme (Siu et al., 2008a). These findings led to the hypothesis that reduced conformational plasticity in the plant MTAN active site may contribute to its inability to bind SAH (Siu et al., 2008a; Park et al., 2009). To better understand the role that conformational flexibility may play in determining the substrate specificity of plant MTANs, we have examined the conformational dynamics of EcMTAN and AtMTAN1 using deuterium–hydrogen exchange coupled mass spectrometry (DXMS) and isothermal titration calorimetry (ITC). Our results represent the first direct study of dynamics in MTAN and rectify the previous misconception that some plant MTANs are inactive towards SAH because they are unable to bind the substrate. The crystal structure of AtMTAN1 in complex with SAH was determined to 2.2 Å resolution. Comparison of this structure with the available substrate-analogue bound form of AtMTAN1 (PDB: 2QTG) provides new insight into the lack of SAH activity in this enzyme.
2. Materials and methods
2.1. Preparation of EcMTAN and AtMTAN1
EcMTAN and AtMTAN1 were overexpressed in BL21 (DE3) and BL21 Codon + cells, respectively, lysed using the BugBuster Protein Extraction Reagent (Novagen), and purified by Ni–NTA affinity purification and size exclusion chromatography, as described previously (Siu et al., 2008a; Lee et al., 2001). The following modifications were made to the documented protocols: For the DXMS experiments, 10 mM sodium-HEPES, pH 7.2, 50 mM sodium chloride was used as the final protein elution buffer. For the kinetics, ITC and crystallization experiments, 50 mM sodium-HEPES, pH 7.5 was used as the final protein elution buffer.
2.2. Deuterium–hydrogen exchange coupled mass spectrometry
Prior to conducting the deuterium–hydrogen exchange experiments, the conditions for protein fragmentation under quench conditions were optimized for EcMTAN and AtMTAN1 as follows: 50 μg of enzyme was diluted into 20 μL of 10 mM sodium-HEPES, pH 7.2, 50 mM sodium chloride. Next, 30 μL of quench buffer consisting of 0.8% (v/v) formic acid, pH 2.3, 16.7% (v/v) glycerol and varying concentrations of guanidine hydrochloride (GuHCl) from 0 to 6.4 M was added. The sample was then digested over a pepsin-conjugated column and peptic fragments were separated by hydrophobicity over a C18 column (C18 300A; Grace Vydac, Hesperia, CA) with a linear acetonitrile gradient from 6.4–38.4%. Eluate was electrosprayed directly into a Thermo Finnigan LCQ Classic ion-trap mass spectrometer (San Jose, CA) for data acquisition. Sequest (Thermo Finnigan Inc.) was used to analyze the MS/MS data. For both EcMTAN and AtMTAN1, the quench condition that produced the most complete fragment map was 3.2 M GuHCl, 0.8% (v/v) formic acid, pH 2.3, 16.7% (v/v) glycerol.
Deuteration was initiated by diluting 0.7 mg of enzyme into 280 μL of H/D exchange buffer, 10 mM sodium-HEPES, pHread 7.2, 50 mM sodium chloride, final D2O 75% (v/v) at 4 °C. At 10, 30, 100, 300, 1000 or 3000 s, 20 μL of the reaction cocktail was pipetted into 30 μL of quench buffer (3.2 M GuHCl, 0.8% (v/v) formic acid, pH 2.3, 16.7% (v/v) glycerol). The final protein concentration of the quenched sample was 1 mg/mL. Negative controls were prepared the same way, but with non-deuterated buffers. Equilibrium-exchange samples were prepared by diluting 50 μg of enzyme into 20 μL of 0.5% (v/v) formic acid, 10 mM sodium-HEPES, 50 mM sodium chloride, 75% (v/v) D2O, and incubating for 16 h at 22 °C. The hydrogen exchange reaction was stopped by adding 30 μL of quench buffer at 0 °C. All quenched reactions were rapidly frozen on dry ice and stored at −80 °C until analyzed.
Deuteration levels were analyzed by electrospray ionization mass spectrometry. All steps were performed at 0 °C. Samples were fragmented, separated and analyzed by ion trap MS/MS as described above. The DXMS software from Sierra Analytics was used to calculate the deuterium levels of peptide fragments from the time-course deuteration experiments, as described previously (Burns-Hamuro et al., 2005; Englander et al., 2003; Hamuro et al., 2002a,b, 2003; Zawadzki et al., 2003). In brief, the number of deuterons incorporated was calculated by (mp − mn)/(mf − mn) × MaxD, where mp, mn and mf refer to the mass centroid values for partially deuterated, non-deuterated and equilibrium deuterated samples, respectively. MaxD refers to the maximum number of deuterons that can be incorporated and is equal to the number of residues in the fragment subtracted by the number of prolines in the fragment and the first two residues. The first two amino acids of each fragment were omitted from analysis because these amino acids undergo relatively fast H/D exchange and any deuterons incorporated may therefore be lost in the fragmentation and separation steps. The percent deuteration was calculated by (number of deuterons incorporated)/MaxD × 100%.
2.3. Generation and kinetic characterization of the AtMTAN1-Glu202Gln mutant
The AtMTAN1-Glu202Gln mutant was generated using the Quikchange site-directed mutagenesis kit (Stratagene) and the following forward and reverse primers: 5′GATGCGATTTCCTGTACG TCCCACGACGGCACCGC3′ and 5′GCGGTGCCGTCGTGGGACGTACAG GAAATCGCATC3′. The mutant was expressed and purified as described for the wild-type enzyme (Siu et al., 2008a). The integrity and melting temperature of the mutant were determined by circular dichroism. The activity of AtMTAN1-Glu202Gln was tested using a xanthine oxidase-coupled spectrophotometric assay (Dunn and Bryant, 1994), which measures the amount of the adenine product produced during the reaction. For each molecule of adenine oxidized, two molecules of 2-(4-iodophenyl)-3-(4-nitrophenyl)-5-phenyltetrazolium chloride (INT) are reduced to formazan, a coloured product that absorbs at 470 nm (de Groot et al., 1985). The reactions were performed in 50 mM sodium-HEPES, pH 7.5, using 0.50 μg of AtMTAN1-Glu202Gln, 0.28 units of xanthine oxidase (Sigma–Aldrich Chemicals) and 0.94 mM of INT (Sigma–Aldrich Chemicals) in a final volume of 800 μl. The concentration of MTA (Sigma–Aldrich Chemicals) or SAH (Sigma–Aldrich Chemicals) was varied from 12.5 μM to 2 mM. As a positive control, wild-type AtMTAN1 was tested. The reactions were monitored on a Biochrome Ultraspec 2100 UV/Vis spectrophotometer outfitted with the SWIFT II enzyme kinetics software (Amersham Pharmacia Biotech). Changes in absorption at 470 nm were converted to the amount of formazan released using the molar absorption coefficient of 15,400 M−1 cm−1.
2.4. Isothermal titration calorimetry
For the ITC studies, SAH and MTA were dissolved in the HEPES buffer used in the final elution step of protein purification. The protein, substrates and buffers were degassed by gentle stirring under a thermo-vacuum chamber for ten minutes at 24 °C. All experiments were performed in 50 mM sodium-HEPES, pH 7.5, at 25 °C using a VP-ITC microcalorimeter (MicroCal Inc., Northhampton, MA). To determine the thermodynamics of substrate binding, the following concentrations were used: 3 mM SAH was titrated against 0.1 mM (monomer) AtMTAN1; 3.5 mM ADE was titrated against 0.1 mM (monomer) AtMTAN1; 4 mM MTA was titrated against 0.1 mM (monomer) AtMTAN1-Glu202Gln; 5 mM SAH was titrated against 0.6 mM (monomer) AtMTAN1-Glu202Gln; 4 mM MTA was titrated against 0.09 mM (monomer) EcMTAN-Glu174Gln; and 3 mM SAH was titrated against 0.13 mM (monomer) EcMTAN-Glu174Gln. The titration experiment of SAH against AtMTAN1-Glu202Gln consisted of one 2 μL injection, followed by twelve 20 μL injections, with a 240 s interval between injections. All other titration experiments consisted of one 2 μL injection, followed by twenty-eight 10 μL injections, with a 240 s interval between injections. The injection speed was 0.5 μL s−1 and the stirring speed was 310 rpm. To account for the heat of dilution, reference data where the ligand was titrated into buffer alone were subtracted from the sample data prior to curve fitting. The negative control of buffer titrated into protein solution was also completed to validate the absence of interaction between the enzymes and the buffer, but this was not subtracted from the test data. The ITC data were analyzed using the Origin v7.0 software (MicroCal Inc., Northhampton, MA) and the single-binding site model was used for fitting.
2.5. Crystallization of AtMTAN1 in complex with SAH
Prior to crystallization, AtMTAN1 was concentrated to 10 mg/mL using a Millipore BioMax 10 K Ultrafree-0.5 mL centrifugal concentrator. Crystals of AtMTAN1 were grown at 25 °C using the hanging drop vapour diffusion technique by mixing 4 μL of AtM-TAN1 with 2 μL of 0.2 M NH4Cl, 18% (w/v) PEG3350, 15% (v/v) ethylene glycol. Crystals of approximately 0.2 × 0.3 × 0.05 mm appeared after nine days. For data collection at −180 °C, the crystals were first soaked in 0.3 mM SAH, 0.2 M NH4Cl, 18% (w/v) PEG3350, 15% (v/v) ethylene glycol for ten minutes and vitrified in a stream of liquid nitrogen gas. Diffraction data were collected on our in-house X-ray equipment (Rigaku RUH3R rotating anode generator with Osmic optics and a Rigaku R-AXIS IV++ image plate) at The Hospital for Sick Children.
2.6. Structural determination and analysis
The diffraction data were reduced using d*TREK (Pflugrath, 1999) and the DREAR program package (Blessing, 1987) was used to apply Bayesian statistics to the data and eliminate negative intensities (Table 2). The structure was solved by molecular replacement using PHASER (McCoy et al., 2007). AtMTAN1 complexed with the substrate-analogue, 5′-methylthiotubercidin (MTT) (PDB code: 2QTG), was used as a search model after deleting all ligand and water molecules. Non-crystallographic symmetry (NCS) restraints were used throughout refinement on the central α helices and β-sheet of each of the four monomers. The structure of AtMTAN1-SAH was initially refined by rigid body refinement and restrained refinement in REFMAC (Murshudov et al., 1997), followed by iterative rounds of manual rebuilding in COOT (Guranowski et al., 1981) alternated with restrained refinement using REFMAC (Murshudov et al., 1997). Once R and Rfree decreased to below 0.3, water molecules were added to peaks greater than 2σ in the Fo − Fc map using REFMAC (Murshudov et al., 1997) and by manual inspection. The coordinates of SAH were obtained from the RCSB Ligand Expo (Feng et al., 2004). SAH was fitted into electron density using ARP/wARP (Zwart et al., 2004), and the coordinates were refined in subsequent rounds of restrained refinement. The refinement statistics are reported in Table 2. Structural alignments were performed using the PROFIT program written by Smith. The secondary structure propensities of the EcMTAN-ADE and AtMTAN1 crystal structures were analyzed using values established by Shortle (2002).
Table 2.
Data collection and refinement statistics.
| AtMTAN1-SAH | |
|---|---|
| Diffraction statistics | |
| Space group | P21 |
| Unit cell dimensions (Å) | |
| a | 45.9 |
| b | 126.4 |
| c | 83.8 |
| β (°) | 101.7 |
| No. observed reflections | 173,922 |
| No. unique reflections | 46,037 |
| Resolution range (Å) | 23.12–2.20 |
| Rmerge(%)a | 8.4 (28.9) |
| Redundancy | 3.8 |
| Completeness (%) | 97.2 (95.2) |
| Average (I/σI) | 7.4 (3.0) |
| Refinement statistics | |
| No. of protein atoms | 7524 |
| No. of ligand atoms | 68 |
| No. of water molecules | 519 |
| Resolution range (Å) | 23.12–2.20 |
| No. reflections in test set | 4627 |
| Test set size (%) | 10 |
| Rcryst(%)b | 20.8 |
| Rfree(%)c | 26.2 |
| Overall B factor (Å2) | 22.6 |
| Ligands | 20.0 |
| Water | 23.1 |
| R.m.s. deviation | |
| Bonds (Å) | 0.012 |
| Angles (°) | 1.4 |
| Dihedral angles (°) | 24.5 |
| Improper angles (°) | 3.0 |
| Molprobity output scores (%)e | |
| Ramachandran favored | 98.1 |
| Ramachandran outliers | 0.0 |
| Cruickshank’s DPI based on Rfreed | 0.26 |
Values given in parentheses refer to reflections in the outer resolution shell: (2.28–2.20 Å).
Rmerge = ΣΣ| I(k) − 〈I〉|/ΣI(k), where I(k) and 〈I〉 represent the diffraction intensity values of the individual measurements and the corresponding mean values. The summation is over all unique measurements.
, where Fobs and Fcalc are the observed and calculated structure factors, respectively.
Rfree is the sum extended over a subset of reflections (10%) excluded from all stages of the refinement.
Cruickshank’s diffraction component precision index (DPI) as an estimate of coordinate error (Cruickshank, 1999).
As calculated using Molprobity (Lovell et al., 2003).
3. Results
3.1. Conformational flexibility of AtMTAN1 and EcMTAN as probed by deuterium–hydrogen exchange coupled mass spectrometry
To compare the collective motions and solvent accessibility of EcMTAN and AtMTAN1, DXMS experiments were conducted. Pepsin digestion conditions were optimized and the overlapping fragments generated cover the entire length of the protein sequence. Only non-overlapping peptides were selected for analysis to prevent ambiguity. The data among peptide fragments of different lengths were normalized by expressing deuteration levels as a percentage of deuteration rather than in absolute values to allow direct comparison of equivalent peptides from EcMTAN and AtMTAN1. As shown in Fig. 2, the peptide fragments exhibit a broad range of deuterium exchange rates. When the peptide exchange rates are mapped onto the structures of EcMTAN and AtM-TAN1, all fragments that exhibit over 50% deuteration after 300 s of exchange are solvent-exposed (data not shown).
Fig. 2.

Time-course percent deuteration of AtMTAN1 and EcMTAN. Deuteration levels are mapped onto the sequence and structural alignment. The structural topologies at the top and bottom of the alignment correspond to AtMTAN1 and EcMTAN, respectively. Residues that are strictly conserved are displayed in white in a red box, while residues that are conservatively substituted are displayed in red. Residues that are similar are framed in blue. Residues involved in ligand binding are marked with green asterisks. The alignment was generated using ESPript (Gouet et al., 1999). Time-course experiments of 10, 30, 100, 300, 1000 and 3000 s of deuteron exchange are shown from top to bottom. The residue numbers for each peptide are indicated on top and below the AtMTAN1 and EcMTAN peptides, respectively.
Overall, the hydrogen exchange rates are comparable for the bacterial and plant enzymes (Fig. 2), with significant solvent protection in the core β strands (Fig. 3). The N-terminus of AtMTAN1 shows significantly higher deuteration levels compared to EcM-TAN, with 100% deuteron incorporation after 100 s of exchange (Fig. 2). In EcMTAN, the N-terminus shows less than 30% deuteration after 3000 s of exchange (Fig. 2). The difference in exchange rates is consistent with the structures of the enzymes. In all of the available crystal structures of AtMTAN1, no electron density is observed for the first 19–22 residues. This result implies that the N-terminus is highly mobile, a finding that is supported by secondary structure prediction, which suggests that residues 1–13 and 18–26 likely form random coils (Raghava, 2000). The first 26 residues of AtMTAN1 are not present in bacterial MTAN sequences. Instead, the N-terminus of EcMTAN is buried in the central β-sheet, where amide protons are solvent-protected by inter-strand hydrogen bonds.
Fig. 3.

Hydrogen exchange profiles of AtMTAN1 and EcMTAN. Hydrogen exchange profiles mapped onto the crystal structures of (a) AtMTAN1 and (b) EcMTAN. Regions that show ≥50% deuteration after 10, 300, 1000 and 3000 s of exchange are coloured in red, yellow, green and cyan, respectively. Regions that demonstrate <50% deuteration after 3000 s of exchange are illustrated in purple. Residues shown in gray are not covered in the fragmentation maps. Residues 1–22 and 1–21 are not modeled in the top and bottom subunits, respectively, of the AtMTAN1 structure. MTT is modeled in sticks format to depict the active sites. The figure was prepared by PYMOL (DeLano, 2002). (For interpretation of the references to colour in this figure legend, the reader is referred to the web version of this article.)
At the quaternary interface, 10–60% higher deuteration levels are observed in the peptide fragments of AtMTAN1 (residues 52–74 and 77–82) compared to EcMTAN (Fig. 2). The increased exchange rates of these fragments in AtMTAN1 are not surprising because residues 51–62 and 79–91 form long loops in AtMTAN1, but are replaced by much shorter loops comprised of only four and six residues, respectively, in EcMTAN (Fig. 2). Residues 88–97 of AtMTAN1 and residues 50–62 of EcMTAN form part of helix α2 and are deeply buried at the quaternary interface. Less than 10% deuteration is observed for this region in EcMTAN and AtMTAN1 after 3000 s of deuteron exchange.
Residues 153–158 of helix α4 in EcMTAN (residues 185–190 in AtMTAN1) are the only part of the quaternary interface that exhibits higher deuteration levels in the bacterial enzyme compared to the plant enzyme (Fig. 2). This region is part of the active site and flanks residues that directly interact with the ligand (e.g. Phe151 in EcMTAN and its equivalent residue Leu181 in AtMTAN1). In EcMTAN, this region shows >80% deuteron incorporation at all time points (Fig. 2). In AtMTAN1, the corresponding peptide fragment shows >30% deuteron incorporation after 10 s of solvent exchange, with an increase to >80% only after 3000 s (Fig. 2). Like EcMTAN, residues 185–190 of helix α4 in AtMTAN1 undergo significant hydrogen–deuteron exchange.
Two additional solvent-exposed regions contribute to the active site. These are the β10–α6 and 310-β7 loops in EcMTAN, which correspond to the β10–α6 loop and a2b helix in AtMTAN1. The peptide fragment that represents the β10–α6 region of EcMTAN (residues 197–207) exhibits >60% deuteration after 30 s of exchange and becomes fully deuterated after 3000 s of exchange (Fig. 2). The 310-β7 region (residues 107–119) exhibits >20% deuteration after 10 s of solvent exchange and >30% after 3000 s of exchange. At all time points, the β10–α6 and 310-β7 loops of EcMTAN show at least 20% higher deuteron incorporation compared to the corresponding regions in AtMTAN1 (Fig. 4), indicating higher levels of conformational flexibility in the active site of the bacterial enzyme.
Fig. 4.

Stereodiagram of differences in solvent-accessibility between AtMTAN1 and EcMTAN. At all time points, the deuteration levels of peptides in AtMTAN1 were subtracted by the deuteration levels found in equivalent peptides in EcMTAN. The average differences are represented as follows: Blue and green indicate a decrease in deuteration of ≥20% and 10–20%, respectively; yellow indicates a difference in deuteration of less than 10%; orange and red indicate an increase in deuteration of 10–20% and ≥20%, respectively; gray indicates regions where deuteration data are not available for both enzymes. The stereodiagram was prepared using PYMOL (DeLano, 2002). (For interpretation of the references to colour in this figure legend, the reader is referred to the web version of this article.)
3.2. Crystallographic B factor comparison
One method to cross-validate the results from the mass spectrometry experiments is to compare the rates of deuteron–hydrogen exchange with the B factors from available crystal structures. Crystallographic temperature factors are affected by both crystal packing and conformational disorder, and elevated B factors in certain regions of the molecule suggest increased conformational dynamics (Ringe and Petsko, 1985, 1986). The temperature factors of the crystal structures that represent the open and closed states of each enzyme were scaled such that the average B factors of all protein atoms in all structures are equal to that of the closed state of AtMTAN1. The scaled B factors were then plotted as a function of residue number (Fig. 5). Because an apo structure of EcMTAN is not available, the adenine-bound structure (PDB: 1JYS), which is thought to be equivalent to the unbound state, was used to represent the open conformation of EcMTAN. The apo structure of AtM-TAN1 (PDB: 2QSU) was chosen to represent the open conformation of the plant enzyme. Substrate-analogue bound structures of EcM-TAN and AtMTAN1 are available (PDB: 1NC1 and 2QTG) to represent the closed conformation of the two enzymes.
Fig. 5.

B factor comparison of AtMTAN1 and EcMTAN. The differences in B factors between the open and closed states of (a) AtMTAN1 and (b) EcMTAN. The B factors of all structures were standardized to the average B factor of all protein atoms in AtMTAN1-MTT (PDB: 2QTG). B factors of the open and closed states are plotted in red and blue, respectively. Regions highlighted in grey indicate residues that are involved in substrate binding. The differences in B factors between the open and closed states are presented in the bar graph, where orange and black indicate an increase and decrease in B factors upon the binding of a ligand, respectively. The topologies of the enzymes are illustrated above the residue numbers. Please note that B factor information is not available for residues 202–205 in EcMTAN-ADE (PDB: 1JYS). (For interpretation of the references to colour in this figure legend, the reader is referred to the web version of this article.)
The B factors of residues in the central β strands (β4, β5, β6, β8 and β10) of the open and closed forms of AtMTAN1 and EcMTAN are on average 17% lower than the rest of the protein. The data correlate well with the DXMS results presented, which demonstrate solvent protection in the core β strands. More importantly, the scaled average B factors of the core β strands in the four crystal structures are within 6% of each other. This gives confidence that the B factors were scaled properly to account for the differences in lattice disorder, because two crystal structures that have comparable lattice disorder are expected to have roughly equal values for the smallest coordinate displacements, which are represented by the lowest B factors (Ringe and Petsko, 1985). In AtMTAN1, the greatest change in B factor is observed in the β10–α6 region (residues 220–237). It should be noted that B factors for part of the β10–α6 region (residues 202–205) in the open state of EcMTAN are not available, as the quality of the electron density in this region prevents these residues from being modeled (Lee et al., 2001). It is therefore expected that the change in B factor will be greater in the equivalent residues in EcMTAN (residues 193–210). Previous crystallographic studies have suggested that the β10–α6 loop of EcMTAN undergoes a loop-to-helix transition to form a cap over the active site when a ligand binds (Lee et al., 2003). This change in secondary structure has not been observed in AtMTAN1. For all other active site residues that directly interact with the ligand, the binding of a ligand results in an average decrease in B factor by 26% in EcMTAN (Fig. 5a). In AtMTAN1, the B factors of the equivalent residues in the closed state are only on average 3% lower than those of the open state (Fig. 5b). The greater difference in B factors between the open and closed conformations of the EcMTAN active site compared to AtMTAN1 correlates well with the observation of higher deuteration levels in the EcMTAN active site in the DXMS experiments.
3.3. Substrate binding induces a favourable entropic change in AtMTAN1 but unfavourable entropic change in EcMTAN
To gain further understanding into the thermodynamics of substrate binding in EcMTAN and AtMTAN1, ITC experiments were conducted (Fig. 6 and Table 1). First, SAH was titrated against AtM-TAN1 to determine if this substrate could bind to the enzyme. When SAH was titrated against AtMTAN1, the binding isotherms (Fig. 6a) clearly revealed that AtMTAN1 binds but does not hydrolyze SAH. The binding of SAH to AtMTAN1 results in favourable changes in entropy and enthalpy. The dissociation constant was calculated to be in the micromolar range (Table 1, Fig. 6a), approximately 20-fold higher than the Km of EcMTAN for SAH (1.3 ± 0.2 μM). To explore the enthalpic and entropic energy changes associated with MTA binding to AtMTAN1, an enzymatically inactive AtMTAN1-Glu202Gln mutant was generated. Characterization of this mutant by circular dichroism showed that the mutant is properly folded with a melting temperature of 68 °C, which is comparable to the melting temperature observed for wild-type AtMTAN1 (74 °C). The binding of MTA to AtMTAN1-Glu202Gln leads to a favourable change in entropy and unfavourable change in enthalpy (Table 1, Fig. 6d). Titration of SAH into AtMTAN1-Glu202Gln results in insignificant changes in heat that are less than 0.3 μcal/s (Table 1, Fig. 6c). This indicates that the Kd of SAH for the mutant enzyme is greater than 0.6 mM, the detection limit of the experiment. The catalytic reaction product, adenine, is found to bind AtMTAN1 with comparable affinity as MTA (Km of 1.5 ± 0.2 μM) and approximately 15-fold more tightly than SAH (Table 1, Fig. 6b).
Fig. 6.

Binding of SAH, MTA and ADE to AtMTAN1 and EcMTAN. The binding isotherms for the titrations of (a) AtMTAN1 with SAH, (b) AtMTAN1 with ADE, (c) AtMTAN1-E202Q with SAH, (d) AtMTAN1-E202Q with MTA, (e) EcMTAN-E174Q with SAH and (f) EcMTAN-E174Q with MTA. No interaction is detected between AtMTAN1-Glu202Gln and SAH. The top panel shows the changes in heat over time as the ligand is titrated into the protein solution. The bottom panel shows the normalized change in heat after subtracting reference data of ligand injections into buffer. The single-binding site model was used to fit the binding isotherms and the fit is shown in red on the bottom panel.
Table 1.
Thermodynamics for ligand binding to AtMTAN1 and EcMTAN.
| Enzyme Ligand | AtMTAN1 SAH | AtMTAN1 ADE | AtMTAN1-E202Q SAH | AtMTAN1-E202Q MTA | EcMTAN-E174Q SAH | EcMTAN-E174Q MTA |
|---|---|---|---|---|---|---|
| Kd(μM) | 24.8 ± 2.6 | 1.7 ± 0.1 | Not detected | 94.8 ± 4.0 | 9.3 ± 0.4 | 4.8 ± 0.4 |
| ΔH (kcal/mol) | −4.4 ± 0.2 | −10.3 ± 0.5 | 5.6 ± 0.3 | −7.9 ± 0.1 | −9.6 ± 0.1 | |
| −TΔS (kcal/mol) | −1.9 | 2.4 | −11.1 | 1.0 | 2.4 | |
| N | 0.99 ± 0.03 | 0.99 ± 0.003 | 0.97 ± 0.04 | 0.94 ± 0.01 | 0.94 ± 0.01 |
To characterize the binding of substrates to EcMTAN, the mutant equivalent to AtMTAN1-Glu202Gln in EcMTAN, EcMTAN-Glu174Gln, was overexpressed and purified as previously described (Lee et al., 2005). Titration of SAH or MTA into EcM-TAN-Glu174Gln leads to favourable enthalpic and unfavourable entropic changes (Table 1, Fig. 6e and f).
3.4. Crystal structure of AtMTAN1 in complex with SAH
As previous modeling had suggested that SAH could not be accommodated in the confined active site of the plant enzyme (Siu et al., 2008a) but our ITC results demonstrate unequivocally that AtMTAN1 can bind SAH, the crystal structure of AtMTAN1 in complex with SAH was determined (Table 2). Analysis by Molprobity shows that 98% of residues are in the favored regions and no residues fall in the disallowed regions (Lovell et al., 2003). The coordinates and structure factors for AtMTAN1-SAH have been deposited in the PDB, accession code 3LGS and RCSB057259, respectively. The asymmetric unit contains two AtMTAN1 dimers. The overall structures of all four monomers are nearly identical, with an average root mean squared (rms) deviation of 0.27 ± 0.09 Å between all main chain atoms. The tertiary structure compares well to previously solved AtMTAN1 structures (PDB: 2QTG, 2QSU, 2QTT), with rms deviations of less than 0.6 Å between all Cα atoms.
With the exception of Glu202, the active site residues are highly superimposable in all four monomers. In monomers B and D, Glu202 assumes a single conformation not previously observed in any of the available MTAN structures (Singh et al., 2006; Siu et al., 2008a,b; Park et al., 2009, 2006; Lee et al., 2001, 2003, 2005). In monomers A and C, an additional conformation is observed at 40% occupancy (Fig. 7a). In these active sites, this second conformation of Glu202 is similar to the orientation of Glu202 observed in all previously determined MTAN structures. In all four monomers, the 3Fo−2Fc map shows strong electron density for the adenine base of SAH (Fig. 7b). At 0.8 sigma, electron density is observed for the glycosidic bond and ribose moiety, but not the 5′-homocysteinyl tail (Fig. 7b). Given the density, we modeled both adenine and SAH in the active site at 50% occupancy. As no electron density was observed for the 5′-substituent of SAH, it was not modeled into the structure. In all four monomers, two water molecules located near the O2′ and O3′ atoms of SAH are present at 50% occupancy (Fig. 7). In monomers A, B and D, an additional water molecule is present near the S5′ atom of SAH at 50% occupancy. The catalytic water molecule, which is present at full occupancy (WAT451, 295, 430 and 227 in monomers A, B, C and D, respectively), is located 4.3 Å from the anomeric carbon and 3.5 Å from O3′.
Fig. 7.
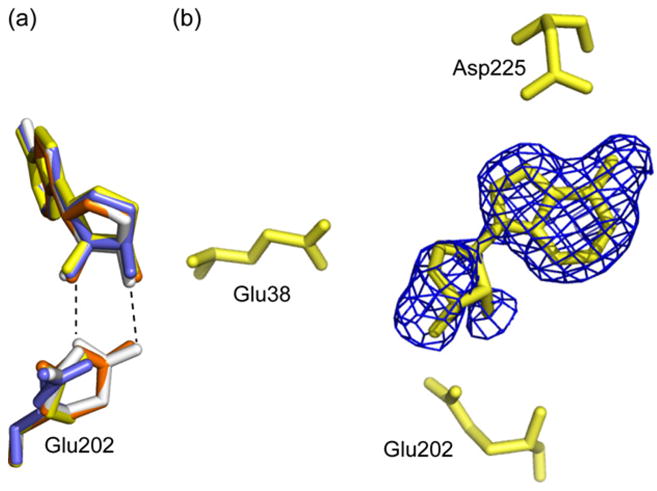
The AtMTAN1-SAH active site. (a) The catalytic residue, Glu202, is found in two conformations in the crystal structure of AtMTAN1 in complex with SAH. In monomers A and C, Glu202 is observed in the catalytic position at 40% occupancy. This orientation allows direct hydrogen-bond interactions with the substrate, which are essential for catalysis. The dominant conformation of Glu202 in all four monomers is too far for direct interaction with the ligand. Monomers A, B, C and D are illustrated in orange, yellow, white and blue, respectively. Hydrogen bonds are represented by dotted lines. (b) The experimental σA-weighted 3Fo − 2Fc electron density map, contoured at 0.8σ, superimposed over SAH in the refined structure. Adenine and SAH are each refined to 50% occupancy. The 5′-homocysteinyl substituent of SAH has not been modeled because no clear electron density was observed for this region. (For interpretation of the references to colour in this figure legend, the reader is referred to the web version of this article.)
4. Discussion
Peptide amide deuterium–hydrogen exchange mass spectrometry (DXMS) is based on the principle that labile hydrogens in proteins are in continuous flux with hydrogens in the solvent. The rate of exchange is affected by both protein dynamics and structure, as stable intra- or intermolecular hydrogen-bond interactions protect amide protons from solvent exchange. Increased levels of protein dynamics and conformational flexibility are correlated with higher hydrogen–deuteron exchange rates because transient breakage of hydrogen bonds between residues exposes amide protons to the bulk solvent. By monitoring the increase in mass of purified protein incubated in deuterated solvent, the rate and level of exchange can be determined and this serves as an important source of structural and dynamic information (Burke et al., 2008; Joh et al., 2008; Hsu et al., 2008; Li et al., 2008; Black et al., 2004, 2007; Brock et al., 2007; Yan et al., 2004; Brudler et al., 2006; Golynskiy et al., 2007; Englander, 2006; Carter et al., 2005).
Previous studies have shown that both EcMTAN and AtMTAN1 exist as stable homodimers in solution. This is reflected in the solvent protection observed for residues 88–97 of AtMTAN1 and residues 50–62 of EcMTAN, which are buried at the quaternary interface. Less than 10% deuteration is observed for this region in EcMTAN and AtMTAN1 after 3000 s of deuteron exchange. In general, higher solvent accessibility was expected at the quaternary interface of AtMTAN1 because this interface contains more polar residues and a greater percentage of the residues are in loop structures. Based on the crystal structure of AtMTAN1 (PDB code: 2QSU), the Swiss PDB viewer program calculates 44% solvent accessibility to this enzyme’s quaternary interface (Guex and Peitsch, 1997). The two monomers of AtMTAN1 associate via a hydrogen bond network involving twelve residues, as well as hydrophobic interactions contributed by eight non-polar residues and π–π stacking interactions between Trp62 and Phe100. In contrast, the Swiss PDB view program estimates that only 39% of the EcMTAN quaternary interface (PDB: 1JYS) is solvent-accessible. In EcMTAN, the residues involved in quaternary interactions are predominantly hydrophobic; sixteen non-polar residues interact via hydrophobic interactions and only four polar residues contribute to hydrogen-bond interactions. The current DXMS results are consistent with the structural findings. Helix α4 is located near the intersubunit interface and is part of the active site. Given that helix α4 of EcMTAN contains only one residue with amide protons in the side chain (Asn153), the observed 80% deuteron incorporation in the corresponding peptide suggests that this helix undergoes partial unfolding to expose backbone amide protons to the solvent. The crystal structures of EcMTAN and AtMTAN1 show that helix α4 of the plant enzyme is partially buried at the quaternary interface while that of the bacterial enzyme is completely solvent-exposed. This explains the observed partial protection from solvent in helix α4 of AtMTAN1 and near-complete deuteration in EcMTAN.
Previous structural studies suggest that in EcMTAN, the binding of a ligand induces a loop-to-helix transition in the β10–α6 loop, which forms a cap over the active site and allows residues in this region to directly interact with the bound ligand (Lee et al., 2003). Also, the 310-β7 loop has been proposed to migrate approximately 3 Å towards the neighbouring subunit on ligand binding to form a cap over the substrate (Lee et al., 2003). In AtMTAN1, the binding of a ligand induces small Cα displacements of less than 1.5 Å in the β10–α6 loop and α2b helix (Siu et al., 2008a). Our current analysis of the B factors and our DXMS results confirm that these regions are likely more disordered in EcMTAN than in AtM-TAN1. The difference in B factors in the active site residues between the open and closed conformations is significantly greater in EcMTAN than in AtMTAN1, suggesting a greater change in conformational disorder between the open and closed states of the bacterial enzyme. Comparison of the secondary structure propensities reveals that residues in the α6 helix of AtMTAN1 have higher propensity to form α helical structure compared to the corresponding region in EcMTAN (data not shown). The DXMS results clearly demonstrate that a higher relative population of EcMTAN than AtMTAN1 adopts conformations that allow the active site residues to undergo solvent exchange. At all time points, at least 20% higher deuteron incorporation was observed in the β10–α6 and 310-β7 regions of EcMTAN compared to AtMTAN1. While the experiments do not probe dynamics at catalytic timescales, it is reasonable to postulate that higher collective motions exist in the active site of the bacterial enzyme and this premise is substantiated by our ITC studies.
ITC allows direct measurement of heat evolved or absorbed as a result of an interaction event. If the stoichiometry and initial concentrations of the interacting species are known, the dissociation constant (Kd), in addition to the changes in enthalpy (ΔH) and entropy (ΔS), can be determined. The binding of MTA or SAH to EcMTAN-Glu174Gln leads to favourable changes in enthalpy. Likewise, the binding of SAH or ADE to AtMTAN1 is enthalpically favourable, but the binding of MTA to AtMTAN1-Glu202Gln leads to a ΔH of 5.6 ± 0.3 kcal/mol (Table 1, Fig. 6d). An unfavourable binding enthalpy typically indicates that interactions between the enzyme and ligand are not strong enough to compensate for the unfavourable enthalpy associated with desolvation (Freire, 2008). Mutating Glu202 to Gln results in the loss of two favourable hydrogen-bond interactions with the hydroxyl groups of MTA and unfavourable interactions are potentially introduced. These changes in hydrogen-bond interactions are sufficient to account for the observed difference in enthalpy changes associated with the binding of a ligand to wild-type versus mutant AtMTAN1. Binding of SAH to the AtMTAN1-Glu202Gln mutant was not detected. As depicted in our current crystal structure of AtMTAN1 in complex with SAH, interactions between the wild-type enzyme and SAH are made via the adenine- and ribose-groups, and no stable interactions with the 5′-homocysteiny tail are observed (Fig. 8a and b). Mutating Glu202 to Gln perturbs the hydrogen-bond interactions with the ribose moiety, and thereby diminishes the mutant’s ability to bind SAH. Mutating the equivalent residue in EcMTAN, Glu174, to Gln likely also negatively impacts ligand interactions. However, compared to AtMTAN1, EcMTAN makes more and stronger direct hydrogen-bond interactions to the adenine- and ribose-groups of the bound ligand (Siu et al., 2008a), so despite the Glu-to-Gln mutation, favourable enzyme–ligand interactions outweigh the enthalpic penalty of desolvation.
Fig. 8.

Schematic representation of the ligand-bound AtMTAN1 active sites. Ligand interactions in (a) monomers B and D, and the dominant state of monomers A and C of AtMTAN1-SAH, (b) the minor conformation of monomers A and C of AtMTAN1-SAH, and (c) the structure of AtMTAN1 in complex with the substrate-analogue, MTT (PDB: 2QTG). Hydrogen bonds are represented by dotted lines. Distances are expressed in angstroms and correspond to the average distances observed in all monomers. The distance between WAT3 and SAH exceeds our definition of 2.2–3.2 Å for a hydrogen bond, and is represented in purple. Water molecules are represented by red circles. Water molecules that are present at half occupancy are coloured in orange. Panel (c) was adapted from Siu et al. (2008a).
The interaction of both MTA and SAH with EcMTAN is entropically unfavourable. Entropic penalties account for changes in solvent order, hydrophobic interactions and dynamics of both the bound ligand and protein, with the predominant contribution coming from changes in protein dynamics. Previous crystallographic studies have shown that the binding of a ligand displaces all except for the catalytic water molecule from the active site of EcMTAN (Lee et al., 2003). As water molecules are released into the bulk solvent, they gain freedom of movement and this causes a favourable change in entropy. The observed entropic penalty upon ligand binding in EcMTAN indicates that the burial of fluidic surface residues at the ligand–enzyme interface results in a decrease in conformational disorder that exceeds the favourable entropic change from solvent release. Unlike EcMTAN, the binding of a substrate to AtMTAN1 is an entropically favourable event. Available crystal structures show that the active site of AtMTAN1 remains partially hydrated in ligand-bound state. This means the binding of a substrate to AtMTAN1 leads to only small changes in conformational disorder that do not exceed the gain in entropy from solvent release. The binding of the catalytic reaction product, adenine, to AtMTAN1 is entropically unfavourable. This is reasonable because crystal structures (PDB: 2H8G, 2QSU) have shown that the binding of a substrate-analogue to AtMTAN1 displaces five water molecules from the active site while adenine displaces only two. The binding of adenine rigidifies the active site and causes a loss of entropy that is not sufficiently compensated by solvent release.
Our ITC experiments clearly show that SAH is able to bind AtMTAN1 with a dissociation constant of 24.8 ± 2.6 μM. This result was unexpected because when SAH was modeled into the crystal structures of AtMTAN1, it appeared that residues in the 5′-alkylthio binding site would sterically clash with the homocysteinyl tail of SAH and no favourable electrostatic interactions could be established (Siu et al., 2008a; Park et al., 2006). To understand how SAH binds and why AtMTAN1 cannot hydrolyze the substrate, the crystal structure of AtMTAN1 in complex with SAH was determined. The 2.2-Å crystal structure of AtM-TAN1-SAH shows that adenine and SAH are both present in the active site at 50% occupancy. Since adenine is ubiquitous in the cytoplasm of E. coli and AtMTAN1 binds adenine with a dissociation constant of 1.7 μM (Table 1, Fig. 6d), the nucleobase may have been salvaged from the cytosol during purification and co-crystallized with the enzyme. Previous crystallographic studies of MTANs have found adenine bound in the active site even though the nucleobase was not added to the crystallization condition (Park et al., 2009, 2006; Lee et al., 2001). Although the AtMTAN1 crystals were soaked in high concentrations of SAH, adenine has a 15-fold higher affinity for AtMTAN1 than SAH, so it is possible that SAH molecules displaced adenine from only approximately half of the protein molecules and the rest remained bound by adenine. Another possibility is that some SAH molecules were hydrolyzed during the short soak of 10 min prior to crystal vitrification and data collection. This second scenario is less likely given that both our kinetics and ITC studies, which were conducted over 10- and 30-min durations, respectively, did not detect catalytic activity in AtMTAN1 towards SAH. None of the active site residues are involved in crystallographic contacts, so it is unlikely that the enzyme is forced into a conformation that allows hydrolysis or affects binding of SAH.
Catalysis by MTAN involves three key residues. In AtMTAN1, Asp225 is the proposed catalytic acid and donates a proton to the N7 atom of the substrate. The adenine ring draws electrons from the ribosyl group, which causes the glycosidic bond to elongate and substantial positive charge to build up on the ribosyl group. This partial positive charge is stabilized by the catalytic water molecule (WAT3) and Glu202, which polarizes the O3′ to create a partial negative charge. The catalytic water molecule then becomes activated by Glu38 and attacks the anomeric carbon of the oxacarbenium-like intermediate to form the catalytic products (Lee et al., 2005). The importance of these residues to catalysis has been demonstrated in mutagenesis studies, which show that mutating Asp225, Glu38 or Glu202 in AtMTAN1 to alanine completely abolishes catalytic activity in AtMTAN1 (data not shown). Similarly, mutating the equivalent residues in EcMTAN renders the enzyme inactive (Lee et al., 2005). In the structure of AtMTAN1-SAH, Glu202 assumes a single conformation in monomers B and D (Fig. 7a). This will be referred to as the dominant orientation of Glu202 and is different from that observed in all previously determined MTAN structures. While two conformations are observed in subunits A and C, the second alternate conformation is only present at 40% occupancy. This second alternate conformation is similar to that observed previously, and may reflect the presence of adenine rather than SAH in some active sites. In the dominant conformation, Glu202 does not interact with the bound ligand directly (Fig. 7). Instead, it only makes a water-mediated hydrogen bond with the 3′-hydroxyl group (Fig. 8a). In previously determined crystal structures of AtMTAN1 in complex with substrate and transition-state-analogues (PDB codes: 2QTG and 2QTT), WAT3 makes a 2.8 Å (2.4–2.9 Å in EcMTAN structures) hydrogen bond with the 3′-OH of the ligand and has been suggested to play a role in stabilizing the oxacarbenium intermediate (Fig. 8c) (Siu et al., 2008a). In the current SAH-complexed structure, at 3.5 Å away, WAT3 is located beyond hydrogen bonding distance from the 3′-OH of SAH. Since withdrawal of electrons from the adenine group and optimal stabilization of the oxacarbenium anion intermediate cannot be achieved, it is unlikely that catalysis can take place. The lack of electron density for the 5′-substituent of SAH indicates that this region is completely disordered. The residues in the 5′-binding pocket of AtMTAN1 are hydrophobic so favourable electrostatic interactions with the carboxyl group of the 5′-homocysteinyl tail cannot be established. Despite suboptimal binding in the 5′-alkylthio region and the loss of one hydrogen bond to Glu202, SAH shows significant affinity for AtMTAN1 because all other interactions in the adenine- and ribose-binding subsites are maintained (Fig. 8). The loss of hydrogen bond interaction with Glu202 may be compensated by a new hydrogen bond interaction that is formed between Thr116 and the ribosyl O4′ (Fig. 7).
The importance of subtle residue motion to catalytic activity has been demonstrated in other systems such as DNA polymerases. Experimental and theoretical studies on DNA polymerase β have shown that the binding of a substrate-analogue with a mismatched base hinders the changes in protein conformation that are necessary for the subsequent chemical step, and that subtle conformational changes in individual residues are critical to substrate discrimination and polymerase fidelity (Radhakrishnan et al., 2006). Our current results offer an alternative to the previous hypothesis that AtMTAN1 selects against SAH primarily based on the size of the 5′-substituent (Siu et al., 2008a; Park et al., 2009). We have shown via DXMS and ITC studies that the active site of AtMTAN1 is less accessible to solvent than that of EcMTAN, but this does not hamper the binding of SAH to the plant enzyme. Also, previous kinetics studies have shown that AtMTAN1 can hydrolyze substrates with extended 5′-substituents, such as 5′-isobutylthioadenosine, 5′-butylthioadenosine and 5′-iodoadenosine (Siu et al., 2008a). This lends support to our argument that the enlarged 5′-alkylthio binding cavity of AtMTAN2 may not be the main discriminating factor for activity towards SAH. Instead, subtle differences in the way the enzyme binds SAH may be responsible for substrate specificity. The structure of AtMTAN1 in complex with SAH suggests that binding of SAH changes the positions of the catalytic water molecule, WAT3, and Glu202. If so, Glu202 and the catalytic water molecule cannot perform their catalytic functions of polarizing and stabilizing the transition state intermediate, thus rendering hydrolysis impossible. Dynamics may play a role in substrate specificity because higher conformational flexibility in the active site of EcMTAN may allow displacement of unfavourable interactions and binding of SAH in the active conformation. Bacterial MTANs likely have relatively high levels of conformational flexibility in the active site, while the plant enzymes may have intermediate to low levels of conformational flexibility corresponding to the level of catalytic activity towards SAH.
Acknowledgments
The authors would like to thank G. David Smith, Yura Lobsanov and Dante Neculai for helpful discussions on the structure determination, and Frank Sicheri for access to the isothermal titration calorimeter and software for data analysis. This work is supported by research grants from the Canadian Institutes of Health Research (CIHR) to P.L.H. (#43998), and by grants from the Innovative Technologies for the Molecular Analysis of Cancer (IMAT) program (CA099835, and CA118595) and NIH Grant (AI076961, AI081982, AI2008031, GM020501, GM066170, and RR029388) to V.L.W. P.L.H. is the recipient of a Canada Research Chair; K.K.W.S. has been supported, fully or in part, by a Master’s research award from the Natural Sciences and Engineering Research Council of Canada (NSERC), a studentship from the Ontario Student Opportunities Trust Fund and The Hospital for Sick Children Foundation Student Scholarship Program, and a Canada Graduate scholarship from CIHR.
Abbreviations
- MTA
5′-methylthioadenosine
- SAH
S-adenosylhomocysteine
- AtMTAN1
Arabidopsis thaliana 5′-methylthioadenosine/S-adenosylhomocysteine nucleosidase 1
- AtMTAN2
Arabidopsis thaliana 5′-methylthioadenosine/S-adenosylhomocysteine nucleosidase 2
- EcMTAN
Escherichia coli 5′-methylthioadenosine/S-adenosylhomocysteine nucleosidase
- DXMS
deuterium–hydrogen exchange coupled mass spectrometry
- ITC
isothermal titration calorimetry
- PDB
Protein Data Bank
- RCSB
Research Collaboratory for Structural Bioinformatics
- LB
Luria–Bertani broth
- IPTG
isopropyl thiogalactoside
- PMSF
phenylmethylsuphonyl fluoride
- HEPES
4-(2-hydroxyethyl)-1-piperazineethanesulfonic acid
- INT
2-(4-iodophenyl)-3-(4-nitrophenyl)-5-phenyltetrazolium chloride
- GuHCl
guanidine hydrochloride
- MTT
5′-methylthiotubercidin
- NCS
non-crystallographic symmetry
References
- Baur AH, Yang SF. Methionine metabolism in apple tissue in relation to ethylene biosynthesis. Phytochemistry. 1972;11:3207–3214. [Google Scholar]
- Baxter C, Coscia CJ. In vitro synthesis of spermidine in the higher plant, Vinca rosea. Biochem Biophys Res Commun. 1973;54:147–154. doi: 10.1016/0006-291x(73)90901-7. [DOI] [PubMed] [Google Scholar]
- Black BE, Foltz DR, Chakravarthy S, Luger K, Woods VL, Jr, Cleveland DW. Structural determinants for generating centromeric chromatin. Nature. 2004;430:578–582. doi: 10.1038/nature02766. [DOI] [PubMed] [Google Scholar]
- Black BE, Brock MA, Bedard S, Woods VL, Jr, Cleveland DW. An epigenetic mark generated by the incorporation of CENP-A into centromeric nucleosomes. Proc Natl Acad Sci USA. 2007;104:5008–5013. doi: 10.1073/pnas.0700390104. [DOI] [PMC free article] [PubMed] [Google Scholar]
- Blessing R. Data reduction and error analysis for accurate single crystal diffraction intensities. Crystallog Rev. 1987:3–58. [Google Scholar]
- Borchardt R, Creveling C, Ueland P. Biological Methylation and Drugdesign Experimental and Clinical Roles of S-adenosylmethionine. Humana Press; Clifton, NJ: 1986. [Google Scholar]
- Brock M, Fan F, Mei FC, Li S, Gessner C, Woods VL, Jr, Cheng X. Conformational analysis of Epac activation using amide hydrogen/deuterium exchange mass spectrometry. J Biol Chem. 2007;282:32256–32263. doi: 10.1074/jbc.M706231200. [DOI] [PubMed] [Google Scholar]
- Brudler R, Gessner CR, Li S, Tyndall S, Getzoff ED, Woods VL., Jr PAS domain allostery and light-induced conformational changes in photoactive yellow protein upon I2 intermediate formation. Probed with enhanced hydrogen/deuterium exchange mass spectrometry. J Mol Biol. 2006;363:148–160. doi: 10.1016/j.jmb.2006.07.078. [DOI] [PMC free article] [PubMed] [Google Scholar]
- Burke JE, Karbarz MJ, Deems RA, Li S, Woods VL, Jr, Dennis EA. Interaction of group IA phospholipase A2 with metal ions and phospholipid vesicles probed with deuterium exchange mass spectrometry. Biochemistry. 2008;47:6451–6459. doi: 10.1021/bi8000962. [DOI] [PMC free article] [PubMed] [Google Scholar]
- Burns-Hamuro LL, Hamuro Y, Kim JS, Sigala P, Fayos R, Stranz DD, Jennings PA, Taylor SS, Woods VL., Jr Distinct interaction modes of an AKAP bound to two regulatory subunit isoforms of protein kinase A revealed by amide hydrogen/deuterium exchange. Protein Sci. 2005;14:2982–2992. doi: 10.1110/ps.051687305. [DOI] [PMC free article] [PubMed] [Google Scholar]
- Burstenbinder K, Rzewuski G, Wirtz M, Hell R, Sauter M. The role of methionine recycling for ethylene synthesis in Arabidopsis. Plant J. 2007;49:238–249. doi: 10.1111/j.1365-313X.2006.02942.x. [DOI] [PubMed] [Google Scholar]
- Carter JM, Gurevich VV, Prossnitz ER, Engen JR. Conformational differences between arrestin2 and pre-activated mutants as revealed by hydrogen exchange mass spectrometry. J Mol Biol. 2005;351:865–878. doi: 10.1016/j.jmb.2005.06.048. [DOI] [PubMed] [Google Scholar]
- Chen X, Schauder S, Potier N, Van Dorsselaer A, Pelczer I, Bassler BL, Hughson FM. Structural identification of a bacterial quorum-sensing signal containing boron. Nature. 2002;415:545–549. doi: 10.1038/415545a. [DOI] [PubMed] [Google Scholar]
- Cornell KA, Swarts WE, Barry RD, Riscoe MK. Characterization of recombinant Eschericha coli 5′-methylthioadenosine/S-adenosylhomocysteine nucleosidase: analysis of enzymatic activity and substrate specificity. Biochem Biophys Res Commun. 1996;228:724–732. doi: 10.1006/bbrc.1996.1723. [DOI] [PubMed] [Google Scholar]
- Cruickshank DW. Remarks about protein structure precision. Acta Crystallogr D Biol Crystallogr. 1999;55:583–601. doi: 10.1107/s0907444998012645. [DOI] [PubMed] [Google Scholar]
- de Groot H, de Groot H, Noll T. Enzymic determination of inorganic phosphates, organic phosphates and phosphate-liberating enzymes by use of nucleoside phosphorylase-xanthine oxidase (dehydrogenase)-coupled reactions. Biochem J. 1985;230:255–260. doi: 10.1042/bj2300255. [DOI] [PMC free article] [PubMed] [Google Scholar]
- DeLano WL. The PyMOL Molecular Graphics System. v.0.97. DeLano Scientific; San Carlos, CA, USA: 2002. [Google Scholar]
- Della Ragione F, Porcelli M, Carteni-Farina M, Zappia V, Pegg AE. Escherichia coli S-adenosylhomocysteine/5′-methylthioadenosine nucleosidase. Purification, substrate specificity and mechanism of action. Biochem J. 1985;232:335–341. doi: 10.1042/bj2320335. [DOI] [PMC free article] [PubMed] [Google Scholar]
- Dunn S, Bryant J. A simple spectrophotometric assay for plant 5′-deoxy-5′-methylthioadenosine nucleosidase using xanthine oxidase as a coupling enzyme. Phytochem Anal. 1994;5:286–293. [Google Scholar]
- Englander SW. Hydrogen exchange and mass spectrometry: a historical perspective. J Am Soc Mass Spectrom. 2006;17:1481–1489. doi: 10.1016/j.jasms.2006.06.006. [DOI] [PMC free article] [PubMed] [Google Scholar]
- Englander JJ, Del Mar C, Li W, Englander SW, Kim JS, Stranz DD, Hamuro Y, Woods VL., Jr Protein structure change studied by hydrogen-deuterium exchange, functional labeling, and mass spectrometry. Proc Natl Acad Sci USA. 2003;100:7057–7062. doi: 10.1073/pnas.1232301100. [DOI] [PMC free article] [PubMed] [Google Scholar]
- Feng Z, Chen L, Maddula H, Akcan O, Oughtred R, Berman HM, Westbrook J. Ligand Depot: a data warehouse for ligands bound to macromolecules. Bioinformatics. 2004;20:2153–2155. doi: 10.1093/bioinformatics/bth214. [DOI] [PubMed] [Google Scholar]
- Freire E. Do enthalpy and entropy distinguish first in class from best in class? Drug Discov Today. 2008;13:869–874. doi: 10.1016/j.drudis2008.07.005. [DOI] [PMC free article] [PubMed] [Google Scholar]
- Golynskiy M, Li S, Woods VL, Jr, Cohen SM. Conformational studies of the manganese transport regulator (MntR) from Bacillus subtilis using deuterium exchange mass spectrometry. J Biol Inorg Chem. 2007;12:699–709. doi: 10.1007/s00775-007-0216-z. [DOI] [PubMed] [Google Scholar]
- Gouet P, Courcelle E, Stuart DI, Metoz F. ESPript: analysis of multiple sequence alignments in PostScript. Bioinformatics. 1999;15:305–308. doi: 10.1093/bioinformatics/15.4.305. [DOI] [PubMed] [Google Scholar]
- Guex N, Peitsch MC. SWISS-MODEL and the Swiss-PdbViewer: an environment for comparative protein modeling. Electrophoresis. 1997;18:2714–2723. doi: 10.1002/elps.1150181505. [DOI] [PubMed] [Google Scholar]
- Guranowski AB, Chiang PK, Cantoni GL. 5′-Methylthioadenosine nucleosidase. Purification and characterization of the enzyme from Lupinus luteus seeds. Eur J Biochem. 1981;114:293–299. doi: 10.1111/j.1432-1033.1981.tb05148.x. [DOI] [PubMed] [Google Scholar]
- Hamuro Y, Burns L, Canaves J, Hoffman R, Taylor S, Woods V. Domain organization of D-AKAP2 revealed by enhanced deuterium exchange-mass spectrometry (DXMS) J Mol Biol. 2002a;321:703–714. doi: 10.1016/s0022-2836(02)00419-9. [DOI] [PubMed] [Google Scholar]
- Hamuro Y, Wong L, Shaffer J, Kim JS, Stranz DD, Jennings PA, Woods VL, Jr, Adams JA. Phosphorylation driven motions in the COOH-terminal Src kinase, CSK, revealed through enhanced hydrogen-deuterium exchange and mass spectrometry (DXMS) J Mol Biol. 2002b;323:871–881. doi: 10.1016/s0022-2836(02)01003-3. [DOI] [PubMed] [Google Scholar]
- Hamuro Y, Zawadzki KM, Kim JS, Stranz DD, Taylor SS, Woods VL., Jr Dynamics of cAPK type IIbeta activation revealed by enhanced amide H/2H exchange mass spectrometry (DXMS) J Mol Biol. 2003;327:1065–1076. doi: 10.1016/s0022-2836(03)00234-1. [DOI] [PubMed] [Google Scholar]
- Hsu YH, Burke JE, Stephens DL, Deems RA, Li S, Asmus KM, Woods VL, Jr, Dennis EA. Calcium binding rigidifies the C2 domain and the intradomain interaction of GIVA phospholipase A2 as revealed by hydrogen/deuterium exchange mass spectrometry. J Biol Chem. 2008;283:9820–9827. doi: 10.1074/jbc.M708143200. [DOI] [PMC free article] [PubMed] [Google Scholar]
- Joh NH, Min A, Faham S, Whitelegge JP, Yang D, Woods VL, Bowie JU. Modest stabilization by most hydrogen-bonded side-chain interactions in membrane proteins. Nature. 2008 doi: 10.1038/nature06977. [DOI] [PMC free article] [PubMed] [Google Scholar]
- Lee JE, Cornell KA, Riscoe MK, Howell PL. Expression, purification, crystallization and preliminary X-ray analysis of Escherichia coli 5′-methylthioadenosine/S-adenosylhomocysteine nucleosidase. Acta Crystallogr D Biol Crystallogr. 2001;57:150–152. doi: 10.1107/s0907444900014669. [DOI] [PubMed] [Google Scholar]
- Lee JE, Cornell KA, Riscoe MK, Howell PL. Structure of E. coli 5′-methylthioadenosine/S-adenosylhomocysteine nucleosidase reveals similarity to the purine nucleoside phosphorylases. Structure. 2001;9:941–953. doi: 10.1016/s0969-2126(01)00656-6. [DOI] [PubMed] [Google Scholar]
- Lee JE, Cornell KA, Riscoe MK, Howell PL. Structure of Escherichia coli 5′-methylthioadenosine/S-adenosylhomocysteine nucleosidase inhibitor complexes provide insight into the conformational changes required for substrate binding and catalysis. J Biol Chem. 2003;278:8761–8770. doi: 10.1074/jbc.M210836200. [DOI] [PubMed] [Google Scholar]
- Lee JE, Luong W, Huang DJ, Cornell KA, Riscoe MK, Howell PL. Mutational analysis of a nucleosidase involved in quorum-sensing autoinducer-2 biosynthesis. Biochemistry. 2005;44:11049–11057. doi: 10.1021/bi050493q. [DOI] [PubMed] [Google Scholar]
- Lee JE, Smith GD, Horvatin C, Huang DJ, Cornell KA, Riscoe MK, Howell PL. Structural snapshots of MTA/AdoHcy nucleosidase along the reaction coordinate provide insights into enzyme and nucleoside flexibility during catalysis. J Mol Biol. 2005;352:559–574. doi: 10.1016/j.jmb.2005.07.027. [DOI] [PubMed] [Google Scholar]
- Li J, Lim MS, Li S, Brock M, Pique ME, Woods VL, Jr, Craig L. Vibrio cholerae toxin-coregulated pilus structure analyzed by hydrogen/deuterium exchange mass spectrometry. Structure. 2008;16:137–148. doi: 10.1016/j.str.2007.10.027. [DOI] [PMC free article] [PubMed] [Google Scholar]
- Lovell SC, Davis IW, Arendall WB, 3rd, de Bakker PI, Word JM, Prisant MG, Richardson JS, Richardson DC. Structure validation by Calpha geometry: phi, psi and Cbeta deviation. Proteins. 2003;50:437–450. doi: 10.1002/prot.10286. [DOI] [PubMed] [Google Scholar]
- McCoy AJ, Grosse-Kunstleve RW, Adams PD, Winn MD, Storoni LC, Read RJ. Phaser crystallographic software. J Appl Crystallogr. 2007;40:658–674. doi: 10.1107/S0021889807021206. [DOI] [PMC free article] [PubMed] [Google Scholar]
- Murshudov GN, Vagin AA, Dodson EJ. Refinement of macromolecular structures by the maximum-likelihood method. Acta Crystallogr D Biol Crystallogr. 1997;53:240–255. doi: 10.1107/S0907444996012255. [DOI] [PubMed] [Google Scholar]
- Pajula RL, Raina A. Methylthioadenosine, a potent inhibitor of spermine synthase from bovine brain. FEBS Lett. 1979;99:343–345. doi: 10.1016/0014-5793(79)80988-6. [DOI] [PubMed] [Google Scholar]
- Park EY, Oh S, Nam MJ, Shin JS, Kim K, Song HK. Crystal structure of 5′-Methylthioadenosine Nucleosidase from Arabidopsis thaliana at 1.5-A Resolution. Proteins: Structure, Function and Bioinformatics. 2006:65. doi: 10.1002/prot.21120. [DOI] [PubMed] [Google Scholar]
- Park EY, Choi WS, Oh SI, Kim KN, Shin JS, Song HK. Biochemical and structural characterization of 5′-methylthioadenosine nucleosidases from Arabidopsis thaliana. Biochem Biophys Res Commun. 2009;381:619–624. doi: 10.1016/j.bbrc.2009.02.106. [DOI] [PubMed] [Google Scholar]
- Pflugrath JW. The finer things in X-ray diffraction data collection. Acta Crystallogr D Biol Crystallogr. 1999;55:1718–1725. doi: 10.1107/s090744499900935x. [DOI] [PubMed] [Google Scholar]
- Radhakrishnan R, Arora K, Wang Y, Beard WA, Wilson SH, Schlick T. Regulation of DNA repair fidelity by molecular checkpoints: “gates” in DNA polymerase beta’s substrate selection. Biochemistry. 2006;45:15142–15156. doi: 10.1021/bi061353z. [DOI] [PMC free article] [PubMed] [Google Scholar]
- Raghava GPS. Protein secondary structure prediction using nearest neighbour and neural network approach. CASP. 2000;4:75–76. [Google Scholar]
- Raina A, Tuomi K, Pajula RL. Inhibition of the synthesis of polyamines and macromolecules by 5′-methylthioadenosine and 5′-alkylthiotubercidins in BHK21 cells. Biochem J. 1982;204:697–703. doi: 10.1042/bj2040697. [DOI] [PMC free article] [PubMed] [Google Scholar]
- Ringe D, Petsko GA. Mapping protein dynamics by X-ray diffraction. Prog Biophys Mol Biol. 1985;45:197–235. doi: 10.1016/0079-6107(85)90002-1. [DOI] [PubMed] [Google Scholar]
- Ringe D, Petsko GA. Study of protein dynamics by X-ray diffraction. Methods Enzymol. 1986;131:389–433. doi: 10.1016/0076-6879(86)31050-4. [DOI] [PubMed] [Google Scholar]
- Riscoe MK, Ferro AJ, Fitchen JH. Methionine recycling as a target for antiprotozoal drug development. Parasitol Today. 1989;5:330–333. doi: 10.1016/0169-4758(89)90128-2. [DOI] [PubMed] [Google Scholar]
- Roje S. S-Adenosyl-L-methionine: beyond the universal methyl group donor. Phytochemistry. 2006;67:1686–1698. doi: 10.1016/j.phytochem.2006.04.019. [DOI] [PubMed] [Google Scholar]
- Rzewuski G, Cornell KA, Rooney L, Burstenbinder K, Wirtz M, Hell R, Sauter M. OsMTN encodes a 5′-methylthioadenosine nucleosidase that is upregulated during submergence-induced ethylene synthesis in rice (Oryza sativa L.) J Exp Bot. 2007;58:1505–1514. doi: 10.1093/jxb/erm014. [DOI] [PubMed] [Google Scholar]
- Schauder S, Shokat K, Surette MG, Bassler BL. The LuxS family of bacterial autoinducers: biosynthesis of a novel quorum-sensing signal molecule. Mol Microbiol. 2001;41:463–476. doi: 10.1046/j.1365-2958.2001.02532.x. [DOI] [PubMed] [Google Scholar]
- Shortle D. Composites of local structure propensities: evidence for local encoding of long-range structure. Protein Sci. 2002;11:18–26. doi: 10.1110/ps.ps.31002. [DOI] [PMC free article] [PubMed] [Google Scholar]
- Singh V, Shi W, Almo SC, Evans GB, Furneaux RH, Tyler PC, Painter GF, Lenz DH, Mee S, Zheng R, Schramm VL. Structure and inhibition of a quorum sensing target from Streptococcus pneumoniae. Biochemistry. 2006;45:12929–12941. doi: 10.1021/bi061184i. [DOI] [PMC free article] [PubMed] [Google Scholar]
- Siu KK, Lee JE, Sufrin JR, Moffatt BA, McMillan M, Cornell KA, Isom C, Howell PL. Molecular determinants of substrate specificity in plant 5′-methylthioadenosine nucleosidases. J Mol Biol. 2008a;378:112–128. doi: 10.1016/j.jmb.2008.01.088. [DOI] [PMC free article] [PubMed] [Google Scholar]
- Siu KKW, Lee JE, Smith GD, Horvatin-Mrakovcic C, Howell PL. Structure of Staphylococcus aureus 5′-methylthioadenosine/Sadenosylhomocysteine nucleosidase. Acta Crystallogr Sec F. 2008b;64:343–350. doi: 10.1107/S1744309108009275. [DOI] [PMC free article] [PubMed] [Google Scholar]
- Sufrin JR, Meshnick SR, Spiess AJ, Garofalo-Hannan J, Pan XQ, Bacchi CJ. Methionine recycling pathways and antimalarial drug design. Antimicrob Agents Chemother. 1995;39:2511–2515. doi: 10.1128/aac.39.11.2511. [DOI] [PMC free article] [PubMed] [Google Scholar]
- Yan X, Watson J, Ho PS, Deinzer ML. Mass spectrometric approaches using electrospray ionization charge states and hydrogen-deuterium exchange for determining protein structures and their conformational changes. Mol Cell Proteomics. 2004;3:10–23. doi: 10.1074/mcp.R300010-MCP200. [DOI] [PubMed] [Google Scholar]
- Zawadzki KM, Hamuro Y, Kim JS, Garrod S, Stranz DD, Taylor SS, Woods VL., Jr Dissecting interdomain communication within cAPK regulatory subunit type IIbeta using enhanced amide hydrogen/deuterium exchange mass spectrometry (DXMS) Protein Sci. 2003;12:1980–1990. doi: 10.1110/ps.03166903. [DOI] [PMC free article] [PubMed] [Google Scholar]
- Zwart PH, Langer GG, Lamzin VS. Modelling bound ligands in protein crystal structures. Acta Crystallogr D Biol Crystallogr. 2004;60:2230–2239. doi: 10.1107/S0907444904012995. [DOI] [PubMed] [Google Scholar]