

Abstract
p23 is an Hsp90 co-chaperone located in both the cytoplasm and nucleus that stabilizes unliganded steroid receptors, controls catalytic activity of certain kinases, regulates protein-DNA dynamics and is upregulated in several cancers. We previously demonstrated that p23-overexpressing MCF-7 cells (MCF-7+p23) exhibit increased invasion without affecting the estrogen-dependent proliferative response, which suggests that p23 differentially regulates genes controlling processes linked to breast tumor metastasis. To gain a comprehensive view of the effects of p23 on estrogen receptor (ER)-dependent and -independent gene expression, we profiled mRNA expression from control versus MCF-7+p23 cells in the absence and presence of estrogen. A number of p23-sensitive target genes involved in metastasis and drug resistance were identified. Most striking is that many of these genes are also misregulated in invasive breast cancers, including PMP22, ABCC3, AGR2, Sox3, TM4SF1, and p8 (NUPR1). Upregulation of the ATP-dependent transporter ABCC3 by p23 conferred resistance to the chemotherapeutic agents etoposide and doxorubicin in MCF-7+p23 cells. MCF-7+p23 cells also displayed higher levels of activated Akt and an expanded phosphoproteome relative to control cells, suggesting that elevated p23 also enhances cytoplasmic signaling pathways. For breast cancer patients, tumor stage together with high cytoplasmic p23 expression more accurately predicted disease recurrence and mortality than stage alone. High nuclear p23 was found to be associated with high cytoplasmic p23, therefore both may promote tumor progression and poor prognosis by increasing metastatic potential and drug resistance in breast cancer patients.
Keywords: p23, Hsp90, estrogen receptor, breast cancer, drug resistance
INTRODUCTION
p23 is a ubiquitous and evolutionarily conserved protein first characterized as a component of unliganded progesterone receptor complexes (1, 2). p23 acts as a co-chaperone, stabilizing the ATP-bound form of Hsp90, thereby stabilizing Hsp90 interactions with steroid receptors (SR) (3) and assisting Hsp90 in increasing the hormone binding affinities of many SRs (4–6). p23 is required for survival in mammals because p23-null mice die perinatally and fail to undergo proper lung development due in part to decreased activity of the glucocorticoid receptor (7). p23 regulates SR and telomerase recruitment to DNA (8–11), and stabilizes some kinases, including PKR, FAK-2, Flt3, and Raf (12–15). In addition to Hsp90-dependent events, p23 might also regulate client proteins autonomously via its innate chaperone activity (16). There is also evidence that mammalian p23 is a cytoplasmic prostaglandin E synthetase (PGES)(17), although this function is controversial since p23 knockout mice do not exhibit reduced PGES activity (18).
p23 has many implicated roles in cancer. We have previously demonstrated that p23 overexpression increases ligand binding to the estrogen receptor alpha (ER) and enhances ER-dependent transcriptional activation (19, 20). We have also demonstrated that p23 overexpression in human ER-positive MCF-7 breast cancer cells promotes a transition from non-invasive into migratory and invasive cells, without affecting cell proliferation (10). Mechanistically, p23 selectively increases ER-target gene transcription and ER recruitment to the estrogen response element (ERE) of the metastasis-associated gene TFF1 (pS2), rather than at proliferative genes like c-myc (10).
p23 protein expression increases with breast tumor stage (10) and is upregulated in metastatic cancers (21, 22). p23 also regulates of the binding and activity of the oncoprotein, telomerase (11, 23, 24), known to impact both early and late stages of tumorigenesis including epithelial cell transformation (25), human mammary epithelial cell immortalization (26), and metastasis in ER-negative breast cancer cells (27, 28). In addition, p23 desensitizes mammalian cells to treatment with the Hsp90 inhibitor and chemotherapeutic agent geldanamycin (GA), thereby protecting Hsp90 from GA inhibition and stabilizing Hsp90 client oncoproteins (15).
Given the implicated role of p23 in cancer and the fact that a modest increase in p23 protein expression causes such strong estrogen-dependent and -independent transcriptional and functional effects on migration and invasion in MCF-7 cells (10), we further characterized the effect of p23 on global gene expression in MCF-7 cells, and examined the expression of p23 protein in primary tumor samples with appended outcome data from women with breast cancer.
MATERIALS AND METHODS
Cell Lines
MCF-7 control and MCF-7+p23 cells were cultured and hormone-starved as previously described (10). A single MCF-7+p23 overexpressing clone (#7) was used in the experiments. Validation of selected p23-sensitive genes was performed using an independent, previously described MCF-7+p23 clone (#8) with similar results (Figure S1)(10).
Microarray Analysis
Total RNA was isolated using the RNeasy kit (Qiagen) from MCF-7 control and MCF- 7+p23 cells treated 16h with either ethanol vehicle or 1nM 17-β-estradiol (E2). Total RNA was reverse transcribed into cDNA and in vitro transcribed to cRNA. The cRNA was fragmented, labeled, hybridized to the human U133A 2.0 Affymetrix GeneChip, washed and scanned. Data is representative of four different conditions performed in duplicate (a total of eight) and normalized using Robust Multichip Average (RMA) Express. The primary data was analyzed using MultiExperiment Viewer (MeV) to determine hierarchical clustering and the ANOVA test was performed on each of the conditions to find those probe sets that were considered significant (p<0.05). Genes were considered significant if they passed the ANOVA test and displayed a fold-change of >2.0 when the logarithmic values in MCF-7+p23 and control cells were compared. The L2L online microarray data analysis tool (http://depts.washington.edu/l2l/) was used to analyze the gene sets for gene ontology.
RNA isolation and quantitative real-time PCR (qRT-PCR)
Cells were incubated in the absence (ethanol vehicle) or presence of 1nM E2 or 100nM 4-hydroxy-tamoxifen (TAM) for 16h before harvesting. Total RNA from MCF-7 control and MCF-7+p23 cells was extracted with TRIzol (Invitrogen) as described by the manufacturer. cDNA was synthesized from 1μg of RNA using the Superscript III reverse transcriptase (Invitrogen) and random primer hexamers (Amersham Biosciences) following the manufacturer's instructions. cDNAs were amplified with the SYBR Green Taq Ready Mix (USB) or Fast Start Universal SYBR Master Mix (Roche) using MyiQ Single-Color Real-Time PCR Detection System from Bio-Rad. The primers used for qRT-PCR are listed in Table S1.
Chromatin Immunoprecipitation Experiments
Cells were hormone-starved for 3 days and treated with the ethanol vehicle or 10nM E2 for 45 min and then formaldehyde crosslinked, lysed, washed and pelleted prior to sonication according to methods described (10). Sonication of chromatin, preparation of protein A beads, immunoprecipitation of chromatin, and semiquantitative PCR were modified from methods described (29). Chromatin (125μg) was subjected to IP with 6μg estrogen receptor alpha (ER) antibody (HC20, Santa Cruz Biotechnology), 2μg acetyl- Histone H3-K9/14 antibody (Millipore, Inc.; 06-599), or equivalent amount of rabbit IgG (Sigma; I-8140). Following crosslink reversal, DNA was purified using Qiagen PCR purification kit. Primers used for PCR are listed in Table S2.
RNA interference
ON-TARGET plus Non-Targeting (D-001810-10-05), ER (L-003401-00-0005), and ABCC3 (L-007312-00-0005) SMART pool small interfering RNAs (siRNA) were purchased from Thermo Scientific. Prior to the siER and siABCC3 RNA transfections, cells were hormone-starved for 1 and 3 days, respectively. Cells were transfected using Oligofectamine (Invitrogen) according to the manufacturer's instructions. For ER RNA interference (RNAi) experiments, 36h after the transfection, RNA and protein were isolated. mRNA expression levels were determined by qRT-PCR and protein levels were analyzed following extraction from cells using RIPA buffer (10) and immunoblotting using antibodies for ER (1:1000; (HC20) Santa Cruz Biotechnology, sc- 543), α-tubulin (1:2000; Covance, MMS-489P), and p23 (1:2000; (JJ3) Thermo Fisher, MA3-414). For ABCC3 RNAi experiments, 24h post transfection cells were dissociated using Versene-EDTA and plated at the same density. Two days after plating, cells were treated for 24h with 100ng/mL doxorubicin. Percent survival was determined by cell counting wells in each condition. RNA was extracted from the untreated cells and knockdown of ABCC3 mRNA expression was confirmed.
Chemotherapeutic resistance assays
Cells were hormone-starved for 3 days. Media was supplemented with 0.01–1μg/mL doxorubicin hydrochloride (Adriamycin) (Sigma; D1515), 0.02–20μM etoposide (Sigma; E1383), or 0.04–40μM camptothecin (Cpt) (Sigma; C9911) for 48h and percent survival was determined in quadruplicate for each condition using the sulphorhodamine B (SRB) assay (30).
Immunohistochemistry and tissue microarray analysis
Tissue arrays contained tissue specimens from individuals who had undergone surgical removal of breast tumors at Ludwig Cancer Center in São Paulo Brazil between 1983 and 1993 with a twelve-year follow up. Representative tissue cores of 0.6 mm in diameter were extracted from each specimen and mounted in paraffin blocks and stained for p23 (JJ3, Thermo Fisher, MA3-414). Two board certified pathologists scored the specimens from the breast tissue microarray in a blinded fashion. Each was scored for intensity of staining (0–3) in the nucleus and in the cytoplasm. For intensity scores, no staining above background was scored as 0, weak but convincing staining was scored as 1, moderate staining was scored as 2, and strong staining was scored as 3. Spearman correlation coefficients were used to determine associations between variables. Age and disease characteristics were compared between cytoplasmic p23 levels using Chi-square tests, t-tests and Fisher’s exact test. Univariate and multivariable Cox proportional hazards models were developed to predict recurrence or mortality. Models were selected using stepwise procedures in SAS with differences in the likelihood ratio test statistics as the criteria for model selection.
RESULTS
Higher p23 protein levels cause changes in gene expression in MCF-7 cells that are also observed in invasive breast cancers
Our previous study demonstrated that a small increase in the amount of p23 protein expression caused specific estrogen-dependent and -independent changes in MCF-7 cell gene expression and function favoring tumor progression (10). We profiled genes globally regulated by p23 using Affymetrix microarray technology (Figure 1a) on RNA extracted from hormone-starved control or MCF-7 cells stably expressing two-fold more p23 protein (MCF-7+p23) (10). The analysis identified 359 known human genes sensitive to p23 levels in the absence of estrogen treatment. Of these genes, 179 were upregulated and 180 were downregulated by more than 2-fold (genes and corresponding probe sets are listed in Tables S5-6).
Figure 1. The effects of p23 overexpression on gene expression in MCF-7 cells.

A) Depiction of the procedure used to examine p23-responsive genes. B) Microarray heat map and fold-change of six genes misregulated in invasive breast cancers with > 5-fold change in expression between MCF-7 control and MCF-7+p23 cells in the absence of 17-β-estradiol (E2) treatment and C) verified by qRT-PCR. Data are means of at least three independent experiments, normalized to GAPDH, and presented as relative fold-change (RFC) from that of MCF-7 control cells, set to 1. Error bars represent standard error. D) Clusters of genes affected by p23 overexpression in the absence or presence of E2 treatment. Heat map reveals clusters of genes rendered unresponsive (Clusters A1, A2; yellow bar) or responsive (Cluster B; red bar) to E2 by p23 overexpression. Cluster C (green bar) denotes genes are inversely regulated by p23 and E2. Also listed are genes misregulated in MCF-7+p23 cells involved in migration and invasion, including cell adhesion molecule 1 (CADM1), laminin B1 (LAMB1), and metastasis suppressor 1 (MTSS1).
In fact, 50% of the genes most upregulated and 61% of the genes most downregulated by p23 overexpression (i.e. those genes exhibiting > 5-fold changes in expression between MCF-7-control and MCF-7+p23 cells in the microarray) are also misregulated in invasive breast cancers (Figure S2). Many of these genes were validated, including PMP22, AGR2, and ABCC3 (upregulated in the microarray 23.7-fold, 5.2-fold, and 5.1-fold in MCF-7+p23 cells) and p8/NUPR1, TM4SF1, and Sox3 (downregulated 14.2-fold, 9.2-fold, and 7.9-fold) from independent MCF-7+p23 lines (Figures 1b and S1). PMP22 is an integral membrane protein known to play a role in cell-cell and cell-matrix interactions in multiple cell types and is implicated in hereditary human neuropathies such as Charcot-Marie-Tooth Syndrome (31). ABCC3 (MRP3) is an ABC transporter with specificity for cellular export of etoposides and antifolates, both of which are used as chemotherapeutic agents (32). AGR2 is a secretory protein, p53 inhibitor, and late-stage breast cancer marker (33, 34). As in MCF-7+p23 cells, PMP22, ABCC3, and AGR2 have also been shown to be upregulated in advanced cancers (32–35). Downregulation of p8, TM4SF1 and Sox3, similar to what is observed in MCF-7+p23 cells, is also associated with breast cancer progression (36, 37). p8 is a nuclear phosphoprotein, TM4SF1 is a tetraspanin family member implicated in cell motility, and studies in Xenopus allude to Sox3 as a tumor suppressor through its ability to bind to β-catenin and inhibit TCF-signaling (38).
The gene expression changes observed in the microarray were validated by qRT-PCR. PMP22, ABCC3 and AGR2 were upregulated 33-fold, 3.5-fold and 1.5-fold, respectively, in MCF-7+p23 cells compared to control cells. p8, TM4SF1, and Sox3 were reduced by 8.6-fold, 30.8-fold and 6.1-fold, respectively (Figure 1c). Interestingly, genes upregulated by p23 overexpression also displayed varying degrees of dependency on Hsp90. As expected for a gene dependent upon Hsp90-p23 complexes, disruption of Hsp90-p23 interactions in MCF-7+p23 cells with either geldanamycin (GA) or 17-AAG, the GA analogue with lower toxicity and used in chemotherapeutic regimens, decreased expression of ABCC3 (Figure S3). The same held true for pS2 and c-myc, both well characterized ER target genes. By contrast expression of AGR2 was not reduced, but rather was enhanced upon inhibition of Hsp90. This suggests that an Hsp90-sensitive pathway may repress AGR2 expression. Surprisingly, GA or 17-AAG treatments had no effect on the expression of PMP22, despite disruption of Hsp90-p23 interaction by GA (Figure S3). Thus, the effect of p23 on PMP22 gene expression appears Hsp90-independent. Collectively, these data demonstrate that p23 protein levels can modulate the expression of genes misregulated in advanced breast cancers and that certain p23-sensitive changes in gene expression are Hsp90-independent.
We also found that 357 genes were sensitive to the ER agonist 17-β-estradiol (E2) in MCF-7 cells, many of which became more or less responsive to E2 by p23 overexpression (Figure 1d, Figure S4, Table S7). Heat maps revealed functional similarities between these genes. For example, Cluster A (Figure 1d, yellow bar) represents genes that changed from E2-responsive to E2-unresponsive as a result of p23 overexpression and can be divided into two subclusters based on function. In Cluster A1, 23% of genes are involved in transcriptional regulation, including Sox11, and in Cluster A2, 61% of genes are involved in migration and cell adhesion. Cluster B (red bar) represents genes involved in a range of biological processes that changed from E2-unresponsive to E2-responsive. Cluster C (green bar) represents a group of genes also involved in a variety of biological processes that are inversely regulated by p23 and E2, including ion transport (16%) and regulation of transcription (13%). Though they did not fall into specific clusters, other genes characteristically involved in migration and invasion are also sensitive to p23 overexpression, and include cell adhesion molecule 1 (CADM1), laminin B1 (LAMB1), and metastasis suppressor 1 (MTSS1) (Figure 1b).
Gene ontology of the genes induced by p23 revealed that p23 overexpression particularly affects the expression of genes involved in metabolism (Table S3) with the highest significance attributed to Kynureninase (KYNU), an enzyme involved in tryptophan metabolism. KYNU is also upregulated in ER-negative breast cancer cells that have metastasized to the lung (39), further supporting a role of p23 in promoting tumor progression through altering gene expression patterns.
Higher p23 protein levels result in increased histone H3 acetylation at PMP22 and ABCC3 gene promoters
To test whether the mechanism of the p23-mediated increase in PMP22 or ABCC3 gene expression is through activation of transcription at corresponding promoters, chromatin immunoprecipitation (ChIP) experiments were performed to detect acetylation of histone H3 lysines 9 and 14 (H3-AcK9/14), marks of transcriptional activation. The PMP22 locus encodes two transcripts that contain alternative exons, 1A and 1B (Figure 2a). Since the 1B transcript is predominantly expressed in non-neuronal cells (40), we predicted that increases in histone acetylation at the PMP22 locus in MCF-7+p23 cells relative to control cells would be most likely to occur at the promoter of 1B (P2). Histone H3-AcK9/14 levels relative to input are higher at the PMP22 P2 in MCF- 7+p23 cells than in control cells (Figure 2b–c; top panels). A similar, albeit less robust increase in Histone H3-AcK9/14 is also observed at the ABCC3 promoter (Figure 2b–c; bottom panels). The ABCC3 promoter has basal levels of histone acetylation, which can be detected above background (non-specific IgG) levels in control cells (Figure 2b). This suggests that a mechanism of p23-mediated transcriptional activation is through increased recruitment of chromatin modifying enzymes that hyperacetylate histone H3-K9/14 and re-initiate gene transcription from active promoters.
Figure 2. Increased Histone H3 acetylation at genes upregulated by p23 overexpression.

A) Schematic of PMP22 and ABCC3 loci. Arrows represent transcriptional start sites (TSS), white boxes represent exons, and black bars represent the DNA promoter regions amplified by PCR to determine the level of histone H3-AcK9/K14. ChIP assays were performed using specific antibodies against histone H3-AcK9/14 or negative control IgG. Relative levels of histone H3-AcK9/K14 were determined using both B) semiquantitative and C) qRT-PCR. Data are averages from three independent experiments, normalized to input, and presented as relative fold-enrichment of histone H3-AcK9/K14 at corresponding promoters of MCF+p23 over MCF-7 control cells, set to 1. Error bars represent standard deviation.
Downregulation of PMP22 and ABCC3 gene expression by E2 is associated with ER recruitment to distal EREs
Our microarray data revealed that many genes positively regulated by p23 overexpression (e.g. PMP22 and ABCC3) are negatively regulated by E2 treatment. To further explore the E2-mediated repression of genes upregulated by p23, we treated MCF-7 control and MCF-7+p23 cells with E2 or the selective estrogen receptor modulator (SERM) 4-hydroxy-tamoxifen (TAM) and measured mRNA expression of PMP22 and ABCC3. E2 treatment repressed PMP22 and ABCC3 gene expression roughly 2-fold in both control and MCF-7+p23 cells (Figure 3a–b, left panels). Also, when comparing total expression levels of PMP22 and ABCC3 between untreated control cells and E2-treated MCF-7+p23 cells, it is evident that E2-repression could not fully reverse the activation of these genes elicited by p23 overexpression. Interestingly, treatment with TAM increased expression of PMP22 and ABCC3 in both control and MCF-7+p23 cells (Figure 3a–b, right panels). Thus, p23 overexpression furthers induces the expression of these genes in the presence of TAM, while activation of PMP22 and ABCC3 by p23 overexpression is partially reversed by E2.
Figure 3. ER recruitment to distal EREs is associated with repression of PMP22 and ABCC3 gene expression.

MCF-7 control (white bars) and MCF-7+p23 cells (black bars) were hormone- starved for three days, treated for 16h with 1nM 17-β-estradiol (E2) (A and B, left panels) or 100nM 4-hydroxytamoxifen (TAM) (A and B, right panels) and mRNA was analyzed by qRT-PCR. Data are means from six independent experiments and presented as in Figure 1c. C) Schematic of PMP22 and ABCC3 loci containing transcription start sites (arrows), ER binding elements as determined by global ChIP-Chip analysis (ERE, striped boxes) and control upstream regions (UPS, black boxes). Black bars represent regions amplified by PCR to determine the level of ER recruitment. D) The relative amount of ER binding, in the presence or absence of E2, was determined by ChIP, followed by qRT-PCR. Data are shown as the averages, with standard error between replicate experiments, normalized to input for each sample, and expressed relative to ER recruitment at the corresponding UPS in MCF-7 control cells, set to 1. E) Depletion of ER protein by RNAi using ER (siER) and control siRNAs (siControl) verified by immunoblotting. F) ABCC3 and PMP22 gene expression levels upon depletion of ER were obtained by qRT-PCR. Shown are the averages obtained from three independent experiments normalized to GAPDH and presented as relative fold-change (RFC) between siER (+) and siControl (−) transfected cells, with siControl cells set to 1.
Recent data suggests that repression by ER requires E2-dependent recruitment of the receptor to the EREs of the target gene (41). Therefore, we examined ER recruitment to PMP22 and ABCC3 EREs predicted from ChIP-on-Chip data (42), as well as to regions upstream of PMP22 and ABCC3 promoters (UPS) that were not predicted to bind ER (Figures 3c). In MCF-7+p23 cells, E2-dependent ER recruitment to PMP22 and ABCC3 EREs is enriched relative to control cells (Figure 3d, compare black to dark grey bars, and Figure S5, compare differences between columns 14 and 6 relative to respective inputs), but not to the PMP22 or ABCC3 UPS regions (Figure 3d and S5). In fact, no ER binding could be detected above non-specific IgG levels at PMP22 and ABCC3 UPS regions (Figure S5), indicating both as suitable negative control regions for ER binding. Thus, p23 overexpression increases E2-dependent ER recruitment specifically to the EREs of the E2-repressed genes PMP22 and ABCC3. This trend of increased ER recruitment upon p23 overexpression to PMP22 and ABCC3 EREs is similar to what has been observed previously at the pS2 ERE (10). However, for pS2, ER recruitment is associated with gene activation, rather than repression.
Interestingly, ER recruitment was evident at the PMP22 ERE and more so at the ABCC3 ERE, even in the absence of exogenously added E2 in MCF-7+p23 cells compared to control cells (Figure 3d, compare light grey to white bars, and Figure S5, compare differences between columns 10 and 2 relative to respective inputs). This suggests that ER may also function as a repressor of PMP22 and ABCC3 gene expression under basal conditions when E2 levels are very low. To assess whether ER represses “basal” PMP22 and ABCC3 gene expression, we silenced ER expression using small interfering RNA (siRNA) in both MCF-7 control and MCF-7+p23 cells and measured ABCC3 and PMP22 mRNA levels in the absence of exogenous E2. Loss of ER resulted in a significant induction of ABCC3 in both MCF-7 control and MCF-7+p23 cells under such “basal” conditions (Figure 3e and f). Only a modest effect was observed on PMP22 gene expression. Therefore, ER represses PMP22 and ABCC3 gene expression under “basal” and high E2 situations.
Upregulation of ABCC3 in MCF-7+p23 cells imparts selective chemotherapeutic resistance
Since MCF-7+p23 cells express more ABCC3 mRNA (Figure 1b–d) compared to control cells, and ABCC3 overexpression confers multidrug resistance by exporting from cells chemotherapeutic agents including etoposide (43) and doxorubicin (Adriamycin) (44), we suspected that MCF-7+p23 cells would be more resistant to these chemotherapeutic agents than control cells. Using a sulphorhodamine B (SRB) dye to stain for surviving cells following treatment with chemotherapeutic agents, MCF-7+p23 cells survived better than control cells in the presence of etoposide and doxorubicin (Figure 4a and c). This resistance was selective in that MCF-7+p23 cells were no more resistant than control cells to Camptothecin (Cpt), a chemotherapeutic agent not exported by ABCC3 (43)(Figure 4b). Resistance to etoposide and doxorubicin, but not Cpt, was validated using clonogenic assays (data not shown). To assess the requirement for ABCC3 in doxorubicin resistance, since it is commonly used to treat metastatic and recurrent breast cancers, we silenced the expression of ABCC3 using small interfering RNA (siRNA) and measured sensitivity of MCF-7+p23 cells to doxorubicin. Our analysis revealed that MCF-7+p23 cells are nearly 50% more sensitive to doxorubicin when ABCC3 expression is reduced by 80% (Figure 4d), indicating that doxorubicin resistance is mediated in part by ABCC3. Lack of complete sensitization can be attributed to other multidrug resistance proteins capable of exporting doxorubicin (43).
Figure 4. Increased ABCC3 gene expression in MCF-7+p23 cells mediates doxorubicin resistance.

A) MCF-7 control (blue) and MCF-7+p23 cells (pink) cells were treated with the indicated concentrations of etoposide; B) camptothecin (Cpt); or C) doxorubicin. Percent survival upon increasing concentrations of drugs was determined using the sulphorhodamine B (SRB) dye, which coats cells evenly so optical density (OD) values are proportional to cell number. Data are expressed as averages of at least three independent experiments with untreated cells set at 100% survival. Error bars represent standard error. D) MCF-7+p23 cells were transfected with siRNA against ABCC3 (siABCC3) or a control siRNA (siControl), and percent survival of doxorubicin treated relative to untreated cells is shown (left panel). Data from quadruplicate points were averaged from two independent experiments and error bars represent standard error. ABCC3 mRNA levels from siABCC3 and siControls were measured by qRT-PCR (right panel).
High p23 expression correlates with shorter disease-free survival times in breast cancer patients
Since breast cancer cells that express more p23 have a higher invasive potential and are more drug resistant, we suspected that patients expressing high levels of p23 protein would have shorter periods of disease-free survival. We analyzed 213 specimens from a human breast tissue microarray for intensity of p23 staining in the nucleus and cytoplasm on a scale of 0 to 3, with 3 being the highest intensity staining (Figure S6).
Using univariate analysis we determined associations between cytoplasmic p23, nuclear p23, stage, and tumor size (T), nodal involvement (N) and metastasis (M) (TNM status). We find that cytoplasmic p23 is significantly associated with nuclear p23 expression (Spearman Correlation ρ=0.37), as well as with stage (ρ=0.23) and nodal involvement (ρ=0.26), but does not correlate significantly with tumor size (ρ=0.16) or metastasis (ρ=0.12) (Table S4).
High cytoplasmic p23 (3+) is also associated with later stage tumors (68% are stage III/IV) compared to moderate p23 (2+) expression (36% are stage III/IV) (chi-square, p-value<0.01) (Table 1). Interestingly 73% of the high cytoplasmic p23 expressing tumors displayed nodal involvement, whereas only 41% of the moderate cytoplasmic p23 expressing cancers are node positive (chi-square, p-value<0.01) (Table 1). This is consistent with our observation that MCF-7+p23 cells are more migratory and invasive than control MCF-7 cells (10).
Table 1.
p23 Expression in Relation to Stage and TMN from the Breast Tumor Microarray
| Samples (N=213) | Cytoplasm P23 |
P-Value (Tests 1+&2+ vs. 3+) | |||
|---|---|---|---|---|---|
| 1+ (N=2) | 2+ (N=22) | 3+ (N=189) | |||
| Age | mean±SD | 46.0±42.24 | 50.91±10.27 | 55.12±13.21 | 0.10* |
| Nuclear p23 | 0 | 2 (100%) | 4 (18%) | 2 (1%) | <0.0001** |
| 1+ | 0 | 10 (45%) | 33 (17%) | ||
| 2+ | 0 | 7 (32%) | 69 (37%) | ||
| 3+ | 0 | 1 (5%) | 85 (45%) | ||
| Stage | I | 0 | 3 (14%) | 5 (3%) | <0.01** |
| II | 1 (50%) | 11 (50%) | 55 (29%) | ||
| III | 1 (50%) | 8 (36%) | 108 (57%) | ||
| IV | 0 | 0 | 21 (11%) | ||
| T | 1 | 0 | 3 (14%) | 7 (4%) | 0.09** |
| 2 | 1 (50%) | 9 (43%) | 54 (31%) | ||
| 3 | 1 (50%) | 3 (14%) | 30 (17%) | ||
| 4 | 0 | 6 (29%) | 81 (47%) | ||
| missing | 1 | 17 | |||
| N | 0 | 1 (50%) | 13 (59%) | 50 (27%) | <0.01*** |
| 1 | 1 (50%) | 6 (27%) | 46 (24%) | ||
| 2 | 0 | 3 (14%) | 52 (28%) | ||
| 3 | 0 | 0 | 40 (21%) | ||
| missing | 1 | ||||
| M | 0 | 2 (100%) | 22 (100%) | 168 (89%) | 0.14** |
| 1 | 0 | 0 | 21 (11%) | ||
T-Test,
-Fisher Exact Test,
-Chi-Square Test
We used Cox proportional hazards models for each variable individually to examine the association of that variable with recurrence or death (Table 2). High levels of cytoplasmic p23, stage III/IV disease and high T, N and M were all individually associated with increased recurrence and death. When these variables were considered jointly (multivariable), only cytoplasmic p23 expression and stage are associated with disease recurrence or death (from Cox models). Our findings indicate that individuals with stage I/II disease and high cytoplasmic p23 (3+) expression (stage I/II-p23high) are 2.35-times more likely to have recurrent disease or death than the same stage patient with low p23 (1+ or 2+) expression (stage I/II-p23low) (Table 2 and Figure 5). Moreover, patients with stage III/IV disease and cytoplasmic p23 1+ or 2+ expression (stage III/IV-p23low), or stage III/IV disease and cytoplasmic p23 3+ expression (stage III/IV-p23high) are 3.34- and 7.85-times more likely to have disease recurrence than those stage I/II-p23low individuals (Table 2 and Figure 5). At 150 months post-surgery, the cumulative disease-free survival for patients with stage I/II-p23low tumors is estimated at 80%; the corresponding estimates are 50% of individuals with stage I/II-p23high, 44% with stage III/IV-p23low, and 18% with stage III/IV-p23high tumors (Figure 5). Although stage alone is highly associated with recurrence or death (Likelihood Ratio (LR)=45.77), the addition of cytoplasmic p23 expression to the Cox proportional hazard models significantly improves the model fit (LR=52.15). In summary, individuals with high levels of cytoplasmic p23 and stage III/IV disease are more likely to exhibit lymph node metastases and experience disease recurrence and mortality.
Table 2.
Disease Recurrence as Function of p23 Expression and Stage using a Cox Proportional Hazard Model
| Univariate | Multivarable | ||||||
|---|---|---|---|---|---|---|---|
| Hazard Ratio | 95% CI | P-Value | Hazard Ratio | 95% CI | P-Value | ||
| Age | 1.01 | 0.99–1.02 | 0.16 | ||||
| Cytoplasm p23 | 1+, | ||||||
| 2+ | 1.00 | <0.01 | 1.00 | 0.02 | |||
| 3+ | 2.97 | 1.46–6.06 | <0.01 | 2.35 | 1.15–4.82 | ||
| Nuclear p23 | 0, 1+ | 1.00 | 0.17 | ||||
| 2+,3+ | 1.33 | 0.88–2.01 | |||||
| Stage | I, II | 1.00 | <0.0001 | 1.00 | <0.0001 | ||
| III, IV | 3.47 | 2.34–5.15 | 3.34 | 2.22–5.03 | |||
| T | 1 | 1.00 | |||||
| 2 | 7.10 | 0.97–51.75 | 0.05 | ||||
| 3 | 8.04 | 1.08–59.81 | 0.04 | ||||
| 4 | 17.38 | 2.41–125.20 | <0.01 | ||||
| N | 0 | 1.00 | |||||
| 1 | 1.52 | 0.91–2.53 | 0.11 | ||||
| 2 | 6.81 | 4.25–10.90 | <0.0001 | ||||
| 3 | 4.04 | 2.43–6.72 | <0.0001 | ||||
| M | 0 | 1.00 | <0.0001 | ||||
| 1 | 11.41 | 6.76–19.27 | |||||
Figure 5. p23 expression and clinical outcome in human breast cancer.
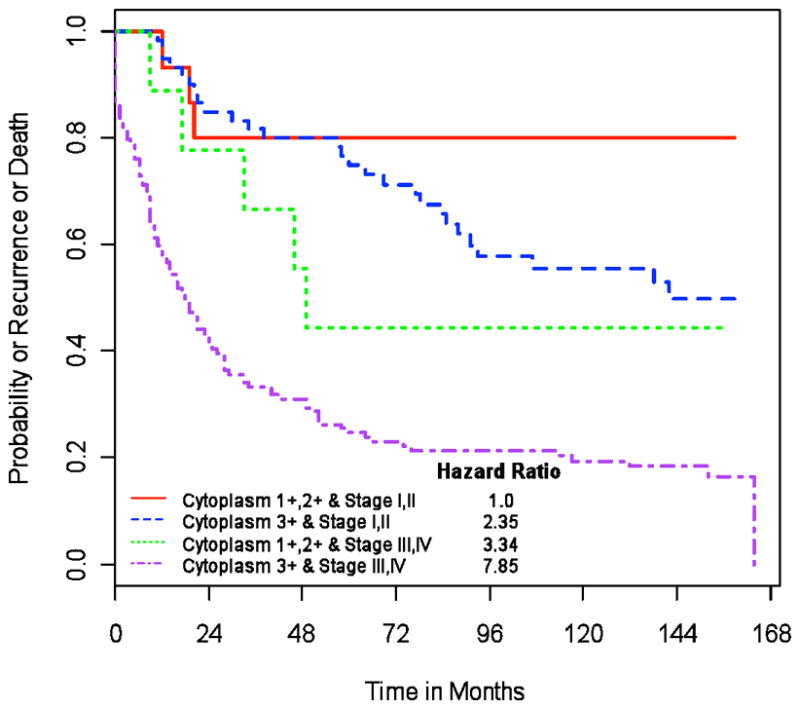
Kaplan-Meier curves plotting time to recurrence (in months) versus survival probability are shown for patients with stage I/II disease and low p23 (red solid line), stage I/II disease and high p23 (blue dotted line), stage III/IV disease and low p23 (green dotted line), or stage III/IV disease and high p23 (purple dotted line). Hazard ratios were calculated using multivariable Cox proportional hazards models and are shown for patients classified according to stage (I/II or III/IV) and p23 expression levels (low, 1+ or 2+; high, 3+).
DISCUSSION
We have determined that many genes affected by p23 overexpression in MCF-7 cells are also misregulated in advanced breast cancers. These genes display varying sensitivities to treatments with Hsp90 inhibitors, TAM, or E2, which could play a role in the responsiveness of tumor cells to anti-estrogen treatment or chemotherapy. For example, ABCC3 is upregulated by p23 overexpression alone, is Hsp90-dependent, further upregulated by TAM treatment, and downregulated by E2 treatment. Functionally, ABCC3 confers selective resistance to chemotherapeutic agents in MCF-7+p23 cells when compared to control cells, and we have observed preliminarily that siRNA-mediated or pharmacological depletion of ER, using ICI treatment, decreases the sensitivity of MCF-7 control cells to doxorubicin (data not shown). Thus, both gene expression data and functional studies demonstrate that p23 via ABCC3 may regulate chemotherapeutic resistance acquired in metastatic and recurrent ER-negative breast tumors.
How might p23 selectively affect gene expression? p23 has been suggested to play a role in the binding and clearance of steroid receptors at response elements (8–10). Our results also indicate that p23 increases recruitment of ER to EREs of E2-repressed genes ABCC3 and PMP22 (Figure 3) as well as to ER-activated genes pS2 and cathepsin D (10). Thus, certain transcription factors, like steroid receptors, may utilize p23 to efficiently cycle on and off DNA to modulate gene transcription.
We find that “active” histone modifications (H3-AcK9/14) are present at the promoters of p23-sensitive genes (Figure 2b–c). The fact that these modifications are also present at the promoters of some p23-sensitive genes in MCF-7 control cells where p23 is not overexpressed (Figure 2b) indicate that p23 may not need to overcome the transcriptional barriers associated with gene silencing in order to upregulate gene expression. Therefore, a mechanism p23 may use to increase gene expression could be to recruit HATs implicated in transcription re-initiation (i.e. GCN5), rather than those involved in transcription initiation (i.e. p300) (45) to raise the transcriptional output from already “active” promoters.
Indeed, we have observed a functional interaction between p23 and the HAT GCN5 by conducting a synthetic lethal screen in yeast, suggesting that p23 affects the activity of HAT pathways in an overlapping fashion with GCN5 (Oxelmark and Garabedian, unpublished). Histone H3-K9/14 is a target for acetylation by GCN5 (39, 46, 47), which further implicates GCN5 as a HAT mediating hyperaceylation at the promoters of p23-upregulated genes. Interestingly, two metabolic genes regulated by p23, ACSL1 and KYNU, which are upregulated in metastatic and recurrent breast cancers, are also known to regulate the activity of HATs and PARP chromatin remodeling enzymes (39, 46, 47). Therefore, a plausible model for p23-sensitive gene regulation is that p23 may influence the DNA binding dynamics of specific transcription factors to up- or downregulate gene expression. p23 may also modulate the recruitment of co-activators necessary to re-initiate transcription from active loci to increase gene expression. Further, amplification of gene regulation in situations of p23 overexpression may occur through the enhancement of p23-sensitive metabolic pathways that affect the activity of chromatin modifying enzymes. Whether or not p23 is recruiting these factors directly is still under investigation.
p23 localizes to both the nucleus and cytoplasm in MCF-7 cells (Figure S7) and high cytoplasmic p23 correlates with shorter disease-free survival times for breast cancer patients, indicating that p23 can promote tumorigenesis by functioning in multiple cellular compartments. In fact, we observe increased activated Akt1 in the cytoplasm and an expanded phosphoproteome in the cytoplasm and nucleus of MCF-7+p23 compared to control cells, suggesting that p23 overexpression facilitates, either directly or indirectly, enhanced kinase activity and protein phosphorylation (Figure S8). Given that activated Akt is a potent survival signal, our findings also suggest that tumors overexpressing p23 would have a survival advantage (48). Therefore, we propose that cancers with high levels of p23 activate signaling pathways in the cytoplasm, which can also amplify p23-sensitive gene transcription in the nucleus.
Our findings strongly suggest that individuals with breast cancers that display high p23 protein levels are more likely to exhibit lymph node involvement and experience disease recurrence and mortality. This is consistent with our in vitro model that p23 overexpression elicits gene expression and phenotypic changes in MCF-7 cells akin to those that occur as breast tumors become invasive. Given that nodal status is the most significant factor in predicting survival (49), it will be important to find ways to reduce p23 expression to decrease lymph node metastases. Lowering p23 expression should also mitigate p23-mediated chemotherapeutic resistance (etoposide, doxorubicin). Recently, celastrol, the active compound in “Thunder of God Vine” root extracts used in traditional Chinese medicine, has been shown to bind and inactivate p23 by triggering its oligomerization into fibers (50). Thus, targeting p23 should reduce invasiveness and drug resistance in breast cancer cells and prevent disease recurrence.
Supplementary Material
Acknowledgments
Financial support: Vilcek Foundation (NES), NIH/NCI P30 CA16087 (JDG), DOD Center of Excellence (W81XWH-04-1-0905) (RJS/JDG), Breast Cancer Research Foundation (RJS/JDG), Avon Foundation (RJS) and NIH/NCRR M01 RR000096 (RJS), Philip Morris USA (MJG).
We thank Naoko Tanese, Keren Imberg and Chaowei Wu for critically reading the manuscript, and Diego Acosta-Alvear for guidance with the ChIP assays.
Footnotes
Potential conflicts of interest: none
References
- 1.Johnson JL, Beito TG, Krco CJ, Toft DO. Characterization of a novel 23-kilodalton protein of unactive progesterone receptor complexes. Mol Cell Biol. 1994;14:1956–63. doi: 10.1128/mcb.14.3.1956. [DOI] [PMC free article] [PubMed] [Google Scholar]
- 2.Johnson JL, Toft DO. A novel chaperone complex for steroid receptors involving heat shock proteins, immunophilins, and p23. J Biol Chem. 1994;269:24989–93. [PubMed] [Google Scholar]
- 3.McLaughlin SH, Sobott F, Yao ZP, et al. The co-chaperone p23 arrests the Hsp90 ATPase cycle to trap client proteins. J Mol Biol. 2006;356:746–58. doi: 10.1016/j.jmb.2005.11.085. [DOI] [PubMed] [Google Scholar]
- 4.Bohen SP. Genetic and biochemical analysis of p23 and ansamycin antibiotics in the function of Hsp90-dependent signaling proteins. Mol Cell Biol. 1998;18:3330–9. doi: 10.1128/mcb.18.6.3330. [DOI] [PMC free article] [PubMed] [Google Scholar]
- 5.Freeman BC, Felts SJ, Toft DO, Yamamoto KR. The p23 molecular chaperones act at a late step in intracellular receptor action to differentially affect ligand efficacies. Genes Dev. 2000;14:422–34. [PMC free article] [PubMed] [Google Scholar]
- 6.Holley SJ, Yamamoto KR. A role for Hsp90 in retinoid receptor signal transduction. Mol Biol Cell. 1995;6:1833–42. doi: 10.1091/mbc.6.12.1833. [DOI] [PMC free article] [PubMed] [Google Scholar]
- 7.Grad I, McKee TA, Ludwig SM, et al. The Hsp90 cochaperone p23 is essential for perinatal survival. Mol Cell Biol. 2006;26:8976–83. doi: 10.1128/MCB.00734-06. [DOI] [PMC free article] [PubMed] [Google Scholar]
- 8.Freeman BC, Yamamoto KR. Disassembly of transcriptional regulatory complexes by molecular chaperones. Science. 2002;296:2232–5. doi: 10.1126/science.1073051. [DOI] [PubMed] [Google Scholar]
- 9.Stavreva DA, Muller WG, Hager GL, Smith CL, McNally JG. Rapid glucocorticoid receptor exchange at a promoter is coupled to transcription and regulated by chaperones and proteasomes. Mol Cell Biol. 2004;24:2682–97. doi: 10.1128/MCB.24.7.2682-2697.2004. [DOI] [PMC free article] [PubMed] [Google Scholar]
- 10.Oxelmark E, Roth JM, Brooks PC, Braunstein SE, Schneider RJ, Garabedian MJ. The cochaperone p23 differentially regulates estrogen receptor target genes and promotes tumor cell adhesion and invasion. Mol Cell Biol. 2006;26:5205–13. doi: 10.1128/MCB.00009-06. [DOI] [PMC free article] [PubMed] [Google Scholar]
- 11.Toogun OA, Zeiger W, Freeman BC. The p23 molecular chaperone promotes functional telomerase complexes through DNA dissociation. Proc Natl Acad Sci U S A. 2007;104:5765–70. doi: 10.1073/pnas.0701442104. [DOI] [PMC free article] [PubMed] [Google Scholar]
- 12.Donze O, Abbas-Terki T, Picard D. The Hsp90 chaperone complex is both a facilitator and a repressor of the dsRNA-dependent kinase PKR. Embo J. 2001;20:3771–80. doi: 10.1093/emboj/20.14.3771. [DOI] [PMC free article] [PubMed] [Google Scholar]
- 13.Schmidt MH, Chen B, Randazzo LM, Bogler O. SETA/CIN85/Ruk and its binding partner AIP1 associate with diverse cytoskeletal elements, including FAKs, and modulate cell adhesion. J Cell Sci. 2003;116:2845–55. doi: 10.1242/jcs.00522. [DOI] [PubMed] [Google Scholar]
- 14.Yao Q, Nishiuchi R, Li Q, Kumar AR, Hudson WA, Kersey JH. FLT3 expressing leukemias are selectively sensitive to inhibitors of the molecular chaperone heat shock protein 90 through destabilization of signal transduction-associated kinases. Clin Cancer Res. 2003;9:4483–93. [PubMed] [Google Scholar]
- 15.Forafonov F, Toogun OA, Grad I, Suslova E, Freeman BC, Picard D. p23/Sba1p protects against Hsp90 inhibitors independently of its intrinsic chaperone activity. Mol Cell Biol. 2008;28:3446–56. doi: 10.1128/MCB.02246-07. [DOI] [PMC free article] [PubMed] [Google Scholar]
- 16.Bose S, Weikl T, Bugl H, Buchner J. Chaperone function of Hsp90-associated proteins. Science. 1996;274:1715–7. doi: 10.1126/science.274.5293.1715. [DOI] [PubMed] [Google Scholar]
- 17.Tanioka T, Nakatani Y, Semmyo N, Murakami M, Kudo I. Molecular identification of cytosolic prostaglandin E2 synthase that is functionally coupled with cyclooxygenase-1 in immediate prostaglandin E2 biosynthesis. J Biol Chem. 2000;275:32775–82. doi: 10.1074/jbc.M003504200. [DOI] [PubMed] [Google Scholar]
- 18.Lovgren AK, Kovarova M, Koller BH. cPGES/p23 is required for glucocorticoid receptor function and embryonic growth but not prostaglandin E2 synthesis. Mol Cell Biol. 2007;27:4416–30. doi: 10.1128/MCB.02314-06. [DOI] [PMC free article] [PubMed] [Google Scholar]
- 19.Knoblauch R, Garabedian MJ. Role for Hsp90-associated cochaperone p23 in estrogen receptor signal transduction. Mol Cell Biol. 1999;19:3748–59. doi: 10.1128/mcb.19.5.3748. [DOI] [PMC free article] [PubMed] [Google Scholar]
- 20.Oxelmark E, Knoblauch R, Arnal S, Su LF, Schapira M, Garabedian MJ. Genetic dissection of p23, an Hsp90 cochaperone, reveals a distinct surface involved in estrogen receptor signaling. J Biol Chem. 2003;278:36547–55. doi: 10.1074/jbc.M305960200. [DOI] [PubMed] [Google Scholar]
- 21.Krebs J, Saremaslani P, Caduff R. ALG-2: a Ca2+-binding modulator protein involved in cell proliferation and in cell death. Biochim Biophys Acta. 2002;1600:68–73. doi: 10.1016/s1570-9639(02)00446-6. [DOI] [PubMed] [Google Scholar]
- 22.Mollerup J, Krogh TN, Nielsen PF, Berchtold MW. Properties of the co-chaperone protein p23 erroneously attributed to ALG-2 (apoptosis-linked gene 2) FEBS Lett. 2003;555:478–82. doi: 10.1016/s0014-5793(03)01310-3. [DOI] [PubMed] [Google Scholar]
- 23.Holt SE, Aisner DL, Baur J, et al. Functional requirement of p23 and Hsp90 in telomerase complexes. Genes Dev. 1999;13:817–26. doi: 10.1101/gad.13.7.817. [DOI] [PMC free article] [PubMed] [Google Scholar]
- 24.Forsythe HL, Jarvis JL, Turner JW, Elmore LW, Holt SE. Stable association of hsp90 and p23, but Not hsp70, with active human telomerase. J Biol Chem. 2001;276:15571–4. doi: 10.1074/jbc.C100055200. [DOI] [PubMed] [Google Scholar]
- 25.Hahn WC, Counter CM, Lundberg AS, Beijersbergen RL, Brooks MW, Weinberg RA. Creation of human tumour cells with defined genetic elements. Nature. 1999;400:464–8. doi: 10.1038/22780. [DOI] [PubMed] [Google Scholar]
- 26.Stampfer MR, Garbe J, Levine G, Lichtsteiner S, Vasserot AP, Yaswen P. Expression of the telomerase catalytic subunit, hTERT, induces resistance to transforming growth factor beta growth inhibition in p16INK4A(−) human mammary epithelial cells. Proc Natl Acad Sci U S A. 2001;98:4498–503. doi: 10.1073/pnas.071483998. [DOI] [PMC free article] [PubMed] [Google Scholar]
- 27.Hochreiter AE, Xiao H, Goldblatt EM, et al. Telomerase template antagonist GRN163L disrupts telomere maintenance, tumor growth, and metastasis of breast cancer. Clin Cancer Res. 2006;12:3184–92. doi: 10.1158/1078-0432.CCR-05-2760. [DOI] [PubMed] [Google Scholar]
- 28.Goldblatt EM, Gentry ER, Fox MJ, Gryaznov SM, Shen C, Herbert BS. The telomerase template antagonist GRN163L alters MDA-MB-231 breast cancer cell morphology, inhibits growth, and augments the effects of paclitaxel. Mol Cancer Ther. 2009;8:2027–35. doi: 10.1158/1535-7163.MCT-08-1188. [DOI] [PubMed] [Google Scholar]
- 29.Acosta-Alvear D, Zhou Y, Blais A, et al. XBP1 controls diverse cell type- and condition-specific transcriptional regulatory networks. Mol Cell. 2007;27:53–66. doi: 10.1016/j.molcel.2007.06.011. [DOI] [PubMed] [Google Scholar]
- 30.Houghton P, Fang R, Techatanawat I, Steventon G, Hylands PJ, Lee CC. The sulphorhodamine (SRB) assay and other approaches to testing plant extracts and derived compounds for activities related to reputed anticancer activity. Methods. 2007;42:377–87. doi: 10.1016/j.ymeth.2007.01.003. [DOI] [PubMed] [Google Scholar]
- 31.Houlden H, Reilly MM. Molecular genetics of autosomal-dominant demyelinating Charcot-Marie-Tooth disease. Neuromolecular Med. 2006;8:43–62. doi: 10.1385/nmm:8:1-2:43. [DOI] [PubMed] [Google Scholar]
- 32.Kool M, de Haas M, Scheffer GL, et al. Analysis of expression of cMOAT (MRP2), MRP3, MRP4, and MRP5, homologues of the multidrug resistance-associated protein gene (MRP1), in human cancer cell lines. Cancer Res. 1997;57:3537–47. [PubMed] [Google Scholar]
- 33.Liu D, Rudland PS, Sibson DR, Platt-Higgins A, Barraclough R. Human homologue of cement gland protein, a novel metastasis inducer associated with breast carcinomas. Cancer Res. 2005;65:3796–805. doi: 10.1158/0008-5472.CAN-04-3823. [DOI] [PubMed] [Google Scholar]
- 34.Smirnov DA, Zweitzig DR, Foulk BW, et al. Global gene expression profiling of circulating tumor cells. Cancer Res. 2005;65:4993–7. doi: 10.1158/0008-5472.CAN-04-4330. [DOI] [PubMed] [Google Scholar]
- 35.Nies AT, Konig J, Pfannschmidt M, Klar E, Hofmann WJ, Keppler D. Expression of the multidrug resistance proteins MRP2 and MRP3 in human hepatocellular carcinoma. Int J Cancer. 2001;94:492–9. doi: 10.1002/ijc.1498. [DOI] [PubMed] [Google Scholar]
- 36.Jiang WG, Watkins G, Douglas-Jones A, Mokbel K, Mansel RE, Fodstad O. Expression of Com-1/P8 in human breast cancer and its relevance to clinical outcome and ER status. Int J Cancer. 2005;117:730–7. doi: 10.1002/ijc.21221. [DOI] [PubMed] [Google Scholar]
- 37.Abba MC, Drake JA, Hawkins KA, et al. Transcriptomic changes in human breast cancer progression as determined by serial analysis of gene expression. Breast Cancer Res. 2004;6:R499–513. doi: 10.1186/bcr899. [DOI] [PMC free article] [PubMed] [Google Scholar]
- 38.Zorn AM, Barish GD, Williams BO, Lavender P, Klymkowsky MW, Varmus HE. Regulation of Wnt signaling by Sox proteins: XSox17 alpha/beta and XSox3 physically interact with beta-catenin. Mol Cell. 1999;4:487–98. doi: 10.1016/s1097-2765(00)80200-2. [DOI] [PubMed] [Google Scholar]
- 39.Minn AJ, Gupta GP, Siegel PM, et al. Genes that mediate breast cancer metastasis to lung. Nature. 2005;436:518–24. doi: 10.1038/nature03799. [DOI] [PMC free article] [PubMed] [Google Scholar]
- 40.Maier M, Castagner F, Berger P, Suter U. Distinct elements of the peripheral myelin protein 22 (PMP22) promoter regulate expression in Schwann cells and sensory neurons. Mol Cell Neurosci. 2003;24:803–17. doi: 10.1016/s1044-7431(03)00246-x. [DOI] [PubMed] [Google Scholar]
- 41.Ellison-Zelski SJ, Solodin NM, Alarid ET. Repression of ESR1 through actions of estrogen receptor alpha and Sin3A at the proximal promoter. Mol Cell Biol. 2009;29:4949–58. doi: 10.1128/MCB.00383-09. [DOI] [PMC free article] [PubMed] [Google Scholar]
- 42.Carroll JS, Meyer CA, Song J, et al. Genome-wide analysis of estrogen receptor binding sites. Nat Genet. 2006;38:1289–97. doi: 10.1038/ng1901. [DOI] [PubMed] [Google Scholar]
- 43.Kruh GD, Belinsky MG, Gallo JM, Lee K. Physiological and pharmacological functions of Mrp2, Mrp3 and Mrp4 as determined from recent studies on gene-disrupted mice. Cancer Metastasis Rev. 2007;26:5–14. doi: 10.1007/s10555-007-9039-1. [DOI] [PubMed] [Google Scholar]
- 44.Liu Y, Peng H, Zhang JT. Expression profiling of ABC transporters in a drug-resistant breast cancer cell line using AmpArray. Mol Pharmacol. 2005;68:430–8. doi: 10.1124/mol.105.011015. [DOI] [PubMed] [Google Scholar]
- 45.Metivier R, Penot G, Hubner MR, et al. Estrogen receptor-alpha directs ordered, cyclical, and combinatorial recruitment of cofactors on a natural target promoter. Cell. 2003;115:751–63. doi: 10.1016/s0092-8674(03)00934-6. [DOI] [PubMed] [Google Scholar]
- 46.Pitroda SP, Khodarev NN, Beckett MA, Kufe DW, Weichselbaum RR. MUC1-induced alterations in a lipid metabolic gene network predict response of human breast cancers to tamoxifen treatment. Proc Natl Acad Sci U S A. 2009;106:5837–41. doi: 10.1073/pnas.0812029106. [DOI] [PMC free article] [PubMed] [Google Scholar]
- 47.Takahashi H, McCaffery JM, Irizarry RA, Boeke JD. Nucleocytosolic acetyl-coenzyme a synthetase is required for histone acetylation and global transcription. Mol Cell. 2006;23:207–17. doi: 10.1016/j.molcel.2006.05.040. [DOI] [PubMed] [Google Scholar]
- 48.Liu W, Bagaitkar J, Watabe K. Roles of AKT signal in breast cancer. Front Biosci. 2007;12:4011–9. doi: 10.2741/2367. [DOI] [PubMed] [Google Scholar]
- 49.Shek LL, Godolphin W. Model for breast cancer survival: relative prognostic roles of axillary nodal status, TNM stage, estrogen receptor concentration, and tumor necrosis. Cancer Res. 1988;48:5565–9. [PubMed] [Google Scholar]
- 50.Chadli A, Felts SJ, Wang Q, et al. Celastrol inhibits Hsp90 chaperoning of steroid receptors by inducing fibrillization of the Co-chaperone p23. J Biol Chem. 285:4224–31. doi: 10.1074/jbc.M109.081018. [DOI] [PMC free article] [PubMed] [Google Scholar]
Associated Data
This section collects any data citations, data availability statements, or supplementary materials included in this article.