

Abstract
c-Myc stimulates angiogenesis in tumors through mechanisms that remain incompletely understood. Recent work indicates that c-Myc upregulates the miR-17~92 microRNA cluster and downregulates the angiogenesis inhibitor thrombospondin-1, along with other members of the thrombospondin type I repeat (TSR) superfamily. Here we demonstrate that downregulation of the TSR protein clusterin in cells overexpressing c-Myc and miR-17~92 promotes angiogenesis and tumor growth. However, clusterin downregulation by miR-17~92 is indirect. It occurs as a result of reduced TGFβ signaling caused by targeting of several regulatory components in this signaling pathway. Specifically, miR-17-5p and miR-20 reduce expression of the type II TGFβ receptor and miR-18 limits expression of Smad4. Supporting these results, in human cancer cell lines levels of the miR-17~92 primary transcript MIR17HG negatively correlate with those of many TGFβ-induced genes that are not direct targets of miR-17~92 (e.g., clusterin and angiopoietin-like 4). Furthermore, enforced expression of miR-17~92 in MIR17HGlow cell lines (e.g., glioblastoma) results in impaired gene activation by TGFβ. Together, our results define a pathway in which c-Myc activation of miR-17~92 attenuates the TGFβ signaling pathway to shut down clusterin expression, thereby stimulating angiogenesis and tumor cell growth.
Keywords: Myc, TGFβ, miR-17~92 cluster, thrombospondin-1, clusterin, angiogenesis
INTRODUCTION
While the c-Myc proto-oncogene is generally thought to control cell proliferation, apoptosis, and differentiation, its contribution to non-cell-autonomous cancer phenotypes such as angiogenesis (formation of new blood vessels) has only recently come to the fore (1, 2). The propensity of Myc to induce the angiogenic phenotype was observed in several models, including mouse papillomatosis (3, 4), chicken bursal lymphomagenesis (5), and Rat-1A cell xenografts (6). However, molecular events triggering the angiogenic switch in Myc-transformed cells remained incompletely understood.
To identify Myc-regulated angiogenic factors, we had developed an experimental system wherein overexpression of this oncoprotein in murine colon carcinoma cells resulted in the hypervascular phenotype. This occurred without increased production of vascular endothelial growth factor (VEGF). Instead, Myc down-regulated the potent endogenous inhibitor of angiogenesis thrombospondin-1 as well as several other thrombospondin type I repeat (TSR) proteins, such as connective tissue growth factor (CTGF) and clusterin (7). Thrombospondin-1 is down-regulated primarily at the level of mRNA turnover (8), suggesting the involvement of microRNAs (miRNAs), which are known to contribute to mRNA degradation (9). Several Myc-regulated microRNAs are known to be important for Myc-induced phenotypes (10, 11) and, provocatively, Myc has been reported to upregulate the miR-17~92 miRNA cluster (12), whose predicted targets include thrombospondin-1 and other TSR proteins.
Our published results confirmed that miR-17~92 controls TSR protein levels. Moreover, overexpression of miR-17~92 in murine carcinoma cells mimicked cell-extrinsic effects of Myc and resulted in enhanced tumor angiogenesis (7). However, it remained unclear whether non-thrombospondin members of the TSR superfamily (such as clusterin) also act to inhibit tumor angiogenesis and whether miR-17~92 regulates them as well. In this report, we first focused on clusterin, because our prior works had shown that clusterin inhibits neoplastic transformation of epithelial cells in vivo (13) and acts as a haploinsufficient tumor suppressor in the mouse model of neuroblastoma (14). However, its function during tumor progression is a matter of considerable controversy (15), as are the mechanisms of its downregulation by c-Myc. Our initial data suggested that clusterin is regulated by miR-17~92, but indirectly, in a TGFβ-dependent manner. This led us to explore the effects of Myc and miR-17~92 on TGFβ signaling and discover that miR-17~92 is a global attenuator of this important pathway.
MATERIALS AND METHODS
Cell lines and tumor production
All cell lines were maintained in DMEM supplemented with 10% FBS and antibiotics. Parental, K-Ras-, and K-Ras+Myc-transformed p53-null colonocytes were described previously (13, 16). HCT116 p53-null human colon carcinoma cells were a kind gift of Dr. Burt Vogelstein. To overexpress miR-17~92 in Ras colonocytes, a BamH1-EcoRV fragment containing miR-17~92 (12) was excised from pcDNA3.1 and inserted into pRNA-CMV3.1/Puro (GenScript, Piscataway, NJ). Cells were transfected using Lipofectamine 2000 and selected in puromycin. Human hepatocellular carcinoma and glioblastoma cell lines overexpressing miR-17~92 were generated by infection with the MSCVpuro retrovirus containing miR-17~92 as described previously (7). Murine clusterin was overexpressed in p53-null colonocytes using the MigR1 retrovirus. Ras-transformed colonocytes were transduced with the QCXIP (Clontech) retrovirus containing the mouse clusterin coding sequence and selected with puromycin. HCT116 cells were likewise transduced with QCXIP expressing human clusterin and additionally - with a retrovirus expressing firefly luciferase.
Treatment of cells with microRNA inhibitors was as described previously (7). For most microRNA mimics experiments, HCT116 and DLD1 cells bearing a hypomorphic mutation in Dicer (Dicerhypo) (17) were used. MicroRNA mimics were purchased from Dharmacon and transfected using Lipofectamine 2000 or Hiperfect (Qiagen) in the case of A172 cells. siRNA against the type II TGFβ receptor was purchased as a Smart Pool from Dharmacon and transfected into cells using Lipofectamine RNAi Max (Invitrogen).
C57BL6/NCr mice were obtained from NCI (Frederick, MD) and used as syngeneic hosts for murine colonocytes. Transformed colonocytes were implanted subcutaneously. Tumor sizes were measured using calipers and tumor weights were recorded on the day of tumor excision. For in vivo imaging of HCT116 xenografts, BALB/c nude mice (Charles River Laboratories) were inoculated subcutaneously with 2×10⁶ cells resuspended in 50 µl of Matrigel. Optical imaging was performed using the Xenogen In-Vivo Imaging System (IVIS). For immunohistochemical analysis unmodified HCT116 cells were grown subcutaneously in NOD.SCID/NCr mice (NCI).
Analyses of tumor specimens and blood vasculature
Following excision, tumor pieces were placed in embedding molds containing O.C.T., snap frozen, and stored at −80°C. Using a cryostat, 6-µm thick sections were prepared and placed on glass slides. Slides were allowed to dry, and then stored at −80°C until use. Slides containing tumor sections were warmed to room temperature, fixed by placing in 10% formalin for 5 minutes, and then rinsed with 1× PBS for 10 minutes. To block endogenous peroxidase, the slides were immersed in 3% hydrogen peroxide for 15 minutes, and then rinsed with water for 5 minutes. Blocking of endogenous biotin was accomplished by using Avidin/biotin blocking kit (Vector Labs, Inc.), and to reduce background staining, blocking was done using M.O.M. Basic Kit (Vector Labs, Inc.) A biotinylated antibody against CD31 (MEC 7.46; Abcam, ab7389) was applied at a concentration of 1:50 and incubated for 1 hour at 37°C. Slides were rinsed 3× for 5 minutes with 1× PBS. ABC immunoperoxidase detection kit (Vector Labs, Inc.) was applied to slides and incubated for 30 minutes at 37°C. Slides were rinsed 3× for 5 minutes with 1× PBS. Slides were then developed using DAB Substrate Kit.
Digitalized slides of H&E- or α-CD31-stained tumors were analyzed to detect pixels that correspond to either red blood cells or CD31-positive endothelial cells and thus represent blood vessels. Aperio ImageScope (V10.0.36.1805) software, and the Positive Pixel Count algorithm (V9.1) were used for this purpose. The total numbers of positive and strong positive pixels were divided by the total area of the analyzed section (expressed as mm2) to yield pixel density. Statistical significance was calculated using two-tailed Student T-test (for the counting of α-CD31-stained vessels) or two-tailed Mann-Whitney U-test (for the counting of perfused vessels.)
Staining for clusterin was performed on formalin fixed paraffin embedded tissue sections as described previously (18). Tumor cell proliferation was assayed by immunoperoxidase staining for Ki-67 in paraffin embedded tissue sections by standard methods. The use of p53-null colonocytes for in vivo Matrigel assays has been described in detail previously (19).
Western Blotting
Cells were lysed in RIPA buffer containing PMSF and cocktails of protease (Sigma) and phosphatase (Pierce) inhibitors. Lysates were separated on SDS PAGE mini-gels (Lonza) under reducing conditions and transferred to PVDF membranes. For thrombospondin-1 expression analysis, either cell lysates or conditioned media were used. Membranes were probed with antibodies to Clusterin, CTGF, TGFBR2 (Santa Cruz and Abcam), Smad4 (Santa Cruz), Smad2 and Smad3 (Invitrogen), phosphorylated Smad3 (Cell Signaling) and Tsp-1 (Ab-11, Lab Vision, Fremont, CA) according to manufacturers’ recommendations. Conditioned media were loaded on PAGE neat. Appropriate secondary antibodies were used in horseradish peroxidase-conjugated forms (Amersham Biosciences, Piscataway, NJ). Antibody binding was detected using the enhanced chemiluminescence system (Amersham) and Quantity One software (BioRad). A monoclonal antibody reactive with actin (Sigma) was used to confirm equal loading.
Quantitation by Odyssey Infrared Imager
After transfer, the PVDF membrane was incubated with 10 ml LI-COR blocking buffer (LI-COR® Biosciences) for 1 hour at room temperature with gentle agitation. To determine the ratios of Smad4 and TGFBRII levels to actin, the membrane was incubated simultaneously with the Smad4 antibody and actin antibody (1:500 and 1:500,000, respectively), or TGFBRII antibody and actin antibody, (1:500 and 1:500,000, respectively) and incubated overnight at 4°C with gentle agitation. After incubation, the membrane was washed with Tris-buffered saline (TBS) with 0.1% Tween (TBS-T) three times for 10 minutes each. The membrane was incubated with a fluorescently labeled antibody, either IRDye® 680 donkey anti-mouse IgG and/or IRDye® 800CW donkey anti-rabbit (1:10,000), in 10 ml LI-COR blocking buffer with 0.1% Tween, for 1 hour at room temperature. After incubation, the membrane was washed with TBS-T three times for 10 minutes each. The wet membrane was analyzed on the Odyssey Infrared Imager (LI-COR® Biosciences).
Luciferase reporter constructs and assays
To analyze the interaction of microRNAs with the human TGFBR2 and Smad4 genes, sense and antisense oligonucleotides encompassing approximately 100 bp surrounding the predicted microRNA binding sites were synthesized with ends compatible with XhoI and NotI. Annealed oligonucleotides were ligated downstream of the renilla luciferase gene in the psiCHECK-2 vector (Promega). DLD1Dicerhypo cells were lysed 48 hours after transfection with reporter constructs, and ratios of firefly to renilla luciferase activities were measured using the dual luciferase assay (Promega). Luminescence was measured on a Synergy 2 luminometer (BioTek).
The sequences of TGFBR2 3’-UTR oligonucleotides were as follows:
miR-17-5p WT sense: TCGAGCCTCAGGAAATGAGATTGATTTTTACAATAGCCAATAACATTTGCACTTTATTAATGCCTGTATATAAATATGAATAGCTATGTTTTATATATGC
miR-17-5p WT a/sense: GGCCGCATATATAAAACATAGCTATTCATATTTATATACAGGCATTAATAAAGTGCAAATGTTATTGGCTATTGTAAAAATCAATCTCATTTCCTGAGGC
miR-17-5p mut sense: TCGAGCCTCAGGAAATGAGATTGATTTTTACAATAGCCAATAACATTTACGCTGTATTAATGCCTGTATATAAATATGAATAGCTATGTTTTATATATGC
miR-17-5p mut a/sense: GGCCGCATATATAAAACATAGCTATTCATATTTATATACAGGCATTAATACAGCGTAAATGTTATTGGCTATTGTAAAAATCAATCTCATTTCCTGAGGC
The sequences of Smad4 3’-UTR oligonucleotides were as follows:
miR-17-5p WT sense: TCGAGCCTCAGGAAATGAGATTGATTTTTACAATAGCCAATAACATTTGCACTTTATTAATGCCTGTATATAAATATGAATAGCTATGTTTTATATATGC
miR-17-5p WT a/sense: GGCCGCCTGTCATTTAGTAGAAGGTACCTCATCACTGAGATTGGACTCAAAAGTGCAAAAGAAAAAAAAAATCTTAAAAATCAAACCTAGAATTCAACTC
miR-17-5p mut sense: TCGAGAGTTGAATTCTAGGTTTGATTTTTAAGATTTTTTTTTTCTTTTACAATTCTGAGTCCAATCTCAGTGATGAGGTACCTTCTACTAAATGACAGGC
miR-17-5p mut a/sense: GGCCGCCTGTCATTTAGTAGAAGGTACCTCATCACTGAGATTGGACTCAGAATTGTAAAAGAAAAAAAAAATCTTAAAAATCAAACCTAGAATTCAACTC
miR-18a WT sense: TCGAGATAGTATGCCCTTAAGACTTAATTTTAACCAAAGGCCTAGCACCACCTTAGGGGCTGCAATAAACACTTAACGCGCGTGCGCACGCGCGCGCGGC
miR-18a WT a/sense: GGCCGCCGCGCGCGCGTGCGCACGCGCGTTAAGTGTTTATTGCAGCCCCTAAGGTGGTGCTAGGCCTTTGGTTAAAATTAAGTCTTAAGGGCATACTATC
miR-18a mut sense: TCGAGATAGTATGCCCTTAAGACTTAATTTTAACCAAAGGCCTAGCACTACTTTCGGGGCTGCAATAAACACTTAACGCGCGTGCGCACGCGCGCGCGGC
miR-18a mut a/sense: GGCCGCCGCGCGCGCGTGCGCACGCGCGTTAAGTGTTTATTGCAGCCCCGAAAGTAGTGCTAGGCCTTTGGTTAAAATTAAGTCTTAAGGGCATACTATC
miR-19 WT sense: TCGAGCAAAGTTGAATTCTAGGTTTGATTTTTAAGATTTTTTTTTTCTTTTGCACTTTTGAGTCCAATCTCAGTGATGAGGTACCTTCTACTAAATGAGC
miR-19 WT a/sense: GGCCGCTCATTTAGTAGAAGGTACCTCATCACTGAGATTGGACTCAAAAGTGCAAAAGAAAAAAAAAATCTTAAAAATCAAACCTAGAATTCAACTTTGC
miR-19 mut sense: TCGAGCAAAGTTGAATTCTAGGTTTGATTTTTAAGATTTTTTTTTTCTGTTACATTTTTGAGTCCAATCTCAGTGATGAGGTACCTTCTACTAAATGAGC
miR-19 mut a/sense: GGCCGCTCATTTAGTAGAAGGTACCTCATCACTGAGATTGGACTCAAAAATGTAACAGAAAAAAAAAATCTTAAAAATCAAACCTAGAATTCAACTTTGC
Quantitative Real-Time PCR analysis
Total RNAs were isolated using TRI Reagent (Sigma) and treated with a TURBO DNA-free kit (Ambion, Applied Biosystems, Carlsbad, CA). For mRNA analysis, cDNAs were prepared using SuperScript III First-Strand Synthesis System for RT-PCR (Invitrogen). Amplification reactions were performed using the PowerSYBR Green PCR master mix (Applied Biosystems, Carlsbad, CA) with QuantiTect Primer Assays from Qiagen. Target gene expression levels were normalized to actin or GAPDH. From the same RNA samples, miRNA expression levels were analyzed starting with 10 ng of total RNA using TaqMan microRNA Assays and theTaqman Gene expression Master Mix according manufacturer’s instructions (Applied Biosystems, Carlsbad, CA). Target gene expression levels were normalized to the RNU6B. All quantitative PCR reactions were performed on an ABI 7900 Sequence Detection system and analyzed with RQ Manager software v1.2.
MicroRNA gain-of-function gene expression analysis
HCT116Dicerhypo or DLD1Dicerhypo cells were transfected with 25 nM final concentrations of the indicated microRNA mimics. Total RNA was purified by use of the RNeasy protocol (QIAGEN) at the time specified, processed as described previously (20), and hybridized competitively with processed RNA from mock-transfected cells (treated with transfection reagent in the absence of microRNA mimic) to microarrays containing oligonucleotide probes corresponding to ~40,000 human transcripts. Data were analyzed by use of Rosetta Resolver software. Gene regulations were calculated as error-weighted mean log10 ratios from fluor-reversed pairs (two ratio hybridizations were performed with fluorescent label reversal to eliminate dye bias).
Correlating expression levels of MIR17HG and TGFβ-responsive genes
The 318 human cancer cell lines comprising the Wooster dataset were classified according to tumor tissue of origin. Relative probeset intensity for each gene of interest and MIR17HG were obtained from the publicly available GlaxoSmithKline microarray database (21) and averaged for cell lines within each tumor type.
RESULTS
Clusterin inhibits tumor growth and angiogenesis
To analyze the functional significance of clusterin down-regulation in Myc mediated tumorigenesis, we transduced RasMyc colonocytes with a retrovirus expressing murine clusterin and/or the puromycin resistance gene and implanted these cells subcutaneously in syngeneic mice. Transduced cells expressed clusterin at higher levels than empty vector-transduced cells but at lower levels than Ras-only colonocytes (Figure 1A, inset). Despite the modest overexpression achieved, RasMyc tumors with reconstituted clusterin expression grew significantly slower than tumors transduced with the empty vector (Figure 1A). To determine whether clusterin affects tumor formation by human cells, we utilized the HCT116 human colon carcinoma cell line which expresses mutant Ki-Ras, elevated levels of Myc and very low levels of clusterin. These cells also have been modified to constitutively express the firefly luciferase gene, allowing the analysis of tumor growth in live animals using bioluminescent imaging. Thus modified HCT116 cells were then infected with retroviruses expressing human clusterin or puromycin resistance gene alone. A total of 2×10⁶ clusterin-expressing or control cells were implanted subcutaneously on contralateral flanks in nude mice and tumor growth was assessed three times per week. Initially tumors grew at comparable rates, but eventually modest clusterin overexpression (Figure 1B, inset) significantly inhibited the growth of tumor xenografts (Figure 1B), which was consistent with data from the colonocyte model. Delayed tumor suppression was apparent through the use of optical imaging (Figure 1C, compare ROI values at days 3 and 21) and suggested that anti-angiogenesis could be involved.
Figure 1. Clusterin inhibits tumor growth and angiogenesis.
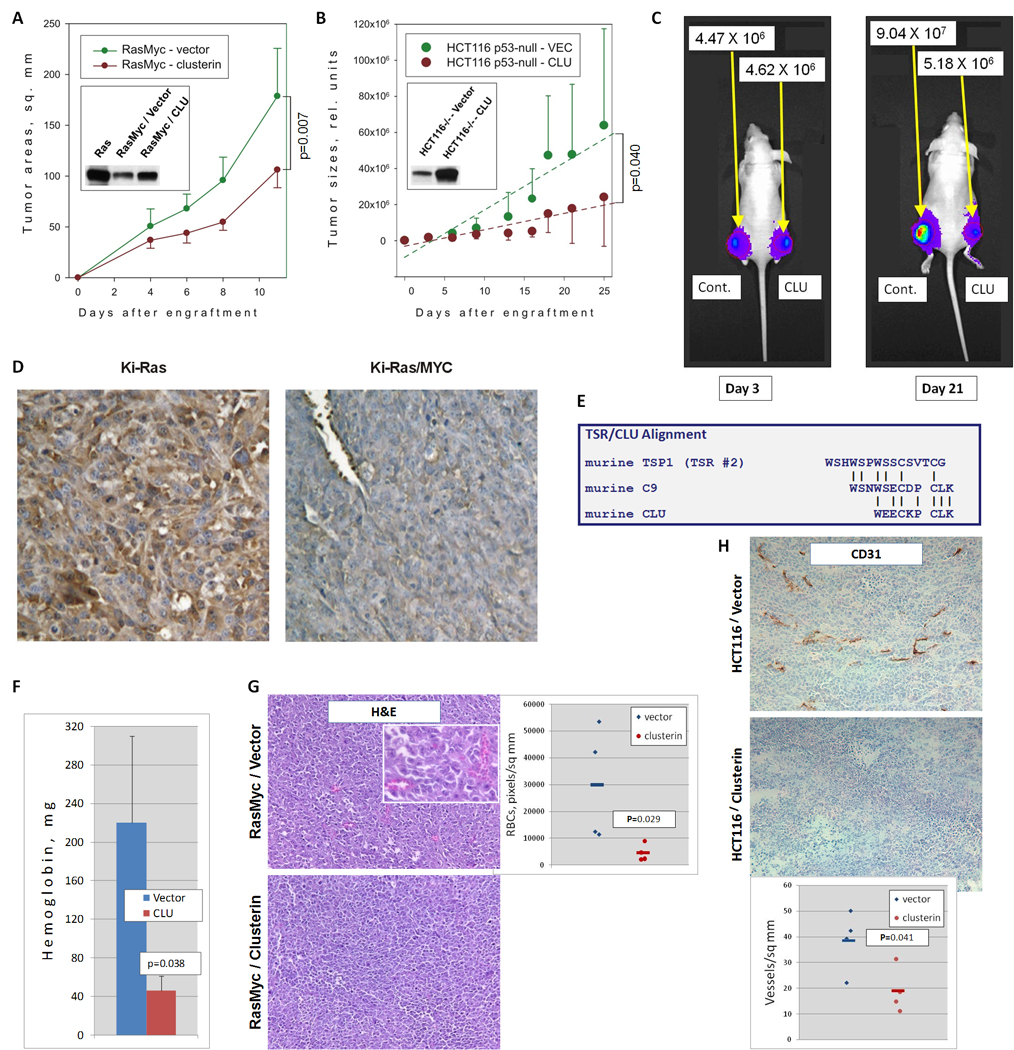
A. Growth of subcutaneous tumors derived from RasMyc cells transduced with a retrovirus expressing murine clusterin and/or the puromycin resistance gene. Inset represents immunoblot of clusterin levels in Ras and RasMyc colonocytes. B. Growth of subcutaneous tumors derived from HCT116 cells transduced with an empty vector or the retrovirus expressing human clusterin. Regression lines represent average rates of growth. The p-value refers to the difference in regression coefficients. Inset represents immunoblot of clusterin levels in transduced cells. C. In vivo bioluminescent imaging of representative animals from the experiment in B. Mice were photographed at days 3 and 21 after injection. No less than 5 animals per group were utilized in all these experiments. D. Immunohistochemical staining of Ki-Ras and Ki-Ras/Myc tumors with an anti-clusterin antibody. Cytoplasmic staining for clusterin is depicted in brown whereas nuclei are counterstained in blue. E. Alignment of the second TSR of murine thrombospondin-1 with the C9 protein and clusterin. F. Hemoglobin content of Matrigel pellets seven days after injection. Matrigels were admixed with p53-null mouse colonocytes transduced with either empty vector (blue bar) or clusterin retrovirus (red bar) and injected s.c. into syngeneic host animals. G. Hematoxylin/eosin staining of RasMyc/vector (top) and RasMyc/clusterin (bottom) tumor sections. Perfused blood vessels contain numerous red blood cells, which could be clearly seen under higher magnification (inset). The scatter plot represents densities of perfused blood vessels in 4 individual tumors. H. Immunohistochemical staining of control (top) and clusterin-overexpressing (bottom) HCT116 tumor sections with antibody recognizing the endothelial cell surface antigen CD31. The scatter plot represents densities of CD31-positive blood vessels in 4 individual tumors.
The anti-angiogenesis-based mechanism would be consistent with clusterin being a secreted protein [save for some special conditions (22)]. This was readily apparent following immunostaining of Ras and RasMyc tumors. While RasMyc tumor cells were essentially negative for clusterin expression, Ras neoplasms exhibited strong cytoplasmic and extracellular staining (Figure 1D). As a secreted protein, clusterin could interact with endothelial cells. Additionally, a homology has been noted between amino acids 77–98 in clusterin and some TSR repeats (23) which are thought to mediate the anti-angiogenic activity of thrombospondin-1 (Figure 1E). Thus, we set out to explore a possible correlation between clusterin and angiogenesis.
To this end, we utilized murine colonocytes, which are strongly angiogenic even without transformation by Ras or Myc, perhaps due to the lack of p53 (19). Control and clusterin-overexpressing colonocytes were embedded in Matrigel and injected subcutaneously into mice, as described previously (6). Seven days later, Matrigel pellets were excised and liquefied, and hemoglobin concentration was measured. We indeed observed >4-fold decrease in hemoglobin content (Figure 1F), attesting to intrinsic anti-angiogenic properties of clusterin. To determine whether clusterin inhibits tumor angiogenesis, we compared microvascular densities of CluLOW and CluHIGH neoplasms. H&E staining clearly demonstrated a marked reduction in large caliber vessels characteristic of RasMyc tumors following clusterin overexpression (Figure 1G, microphotographs and scatter plot). Since blood vessels in HCT116 xenografts are of smaller caliber, we used staining for the endothelial cell marker CD31. Again, we found that clusterin expression negatively correlated with tumor neovascularization (Figure 1H, microphotographs and scatter plot). Thus, just like its fellow TSR superfamily member thrombospondin-1, clusterin is an inhibitor of angiogenesis.
miR-17~92 regulates clusterin indirectly, through the TGFβ pathway
We then asked whether Myc-mediated repression of clusterin also involves miR-17~92, even though the commonly used TargetScan algorithm (24) does not predict miR-17~92 binding sites within the 3’-UTR of the CLU gene. When the cluster was overexpressed using a CMV promoter-containing retrovirus in Ras-transformed mouse colonocytes, miR-17~92 levels were increased no more than 4-fold and were similar to that observed in RasMyc colonocytes (Dews et al., 2006 and data not shown). Even without gross miR-17~92 overexpression, we observed markedly reduced levels of clusterin by immunoblotting (Figure 2A, left panel). Conversely, the knockdown of all six members of the miR-17~92 cluster with 2’-O-methyl antisense oligoribonucleotides partially restored clusterin expression in RasMyc colonocytes (Figure 2A, right panel).
Figure 2. Clusterin is regulated by miR-17~92 via the TGFβ pathway.

A. Immunoblotting analysis of clusterin expression levels in the following cell lines. Left: Ras-only mouse colonocytes transduced with either empty vector (Ras/Puro) or the miR-17~92-encoding retrovirus (Ras/miR-17~92). Right: RasMyc cells transfected with scrambled or anti-miR-17~92 2'-O-methyl oligoribonucleotides. B. Changes in expression levels of thrombospondin-1 (THBS1) and clusterin mRNAs in HCT116 Dicerhypo (left) and A172 (right) cells after transfection with the indicated microRNA mimics. mRNA levels in HCT116 and A172 cells were profiled using Affymetrix microarrays and qPCR as described in Materials and Methods. C. Activation of TGFβ signaling in Ras colonocytes. Ras cells treated with vehicle or 10 ng/mL TGFβ1 for 30 m were analyzed by immunoblotting for phosphorylated Smad3 (pSmad3) and total Smad3. D. Measurement of TGFβ effects on TSR proteins. Ras cells were treated with increasing doses of TGFβ1 for 48 h and lysates were immunoblotted for clusterin and CTGF proteins. Tsp-1 was detected in conditioned medium. E. Immunoblotting analysis of TSR proteins in Ras/vector, Ras/ miR-17~92 or c-Myc cells cultured in the absence or presence of TGFβ1 (5 ng/mL) for 48 h. F. CLU mRNA levels in Ras/Vector and Ras/17~92 cells before and after (24h) stimulation with TGFβ, as measured by qPCR. Expression levels of CLU are adjusted to those of GAPDH.
We then analyzed the immediate effects of these microRNAs on clusterin mRNA levels in HCT116 cells rendered hypomorphic for Dicer through the deletion of its helicase domain in exon 5 (17). This mutation causes HCT116 Dicerhypo cells to express low levels of endogenous microRNAs, making them well-suited for gain-of-function experiments (25, 26). They were transfected with microRNA mimics and gene expression was profiled at short intervals (10–24 hours) in order to capture only those mRNAs that are directly affected by introduced miRs. Under these conditions, thrombospondin-1 mRNA was appreciably down-regulated by miR-18a and 19a, as envisioned in our previous study (7); however, none of the six miR-17~92 members were found to lower clusterin mRNA levels significantly (Figure 2B, left panel). Identical data were obtained using another colon cancer cell line with the Dicer mutation (DLD1 Dicerhypo; data not shown). To determine if clusterin mRNA “resistance” to miR-17~92 mimics was an artifact of the Dicer mutation, we performed the same experiment in Dicer-sufficient A172 cells where miR mimics were found to work effectively (Fox and Thomas-Tikhonenko, unpublished data), with essentially identical results (Figure 2B, right panel). Furthermore, no effects of miR-17~92 mimics on clusterin protein expression were detected (data not shown). Taken together, these data suggest that clusterin is not a direct target for miR-17~92 and that instead miR-17~92 targets an upstream activator of clusterin expression. Reports from one laboratory had demonstrated that in some cell lines clusterin can be induced by TGFβ(27), prompting us to investigate this pathway as a possible link between miR-17~92 and CLU.
To confirm that parental Ras colonocytes (unlike most human colon carcinomas) are responsive to TGFβ, we stimulated them with recombinant human TGFβ1 for 30 minutes and observed robust phosphorylation of Smad3 (Figure 2C). We then examined the expression of clusterin and several other TSR proteins in TGFβ-treated Ras cells. Clusterin indeed was induced in a dose dependent manner by TGFβ, as were CTGF and thrombospondin-1 (Figure 2D).
Remarkably, when we examined clusterin protein levels after TGFβ treatment in Ras cells over-expressing either miR-17~92 or c-Myc, we discovered that up-regulation of clusterin was either non-existent (in the presence of Myc) or strongly inhibited (in the presence of retrovirally encoded miR-17~92.) The same pattern of expression was observed for thrombospondin-1 and CTGF (Figure 2E). Additionally, CLU mRNA induction by TGFβ was apparent in control but abolished in miR-17~92-transduced cells (Figure 2F). This suggests that Myc may inhibit expression of TSR proteins either directly or indirectly, by interfering with the TGFβ signaling pathway, at least in part through the induction of miR-17~92. While thrombospondin-1 and CTGF can be targeted both directly and indirectly, the prime example of the TGFβ-dependent deregulation is the Myc ┤ clusterin axis.
miR-17~92 down-regulates endogenous TGFβ receptor II and Smad4
The TGFβ pathway is activated when the cognate ligand binds to the type II receptor (TGFBR2) at the cell surface and recruits and phosphorylates the Type I receptor (TGFBR1). This heterodimeric transmembrane complex further phosphorylates Smad2 and Smad3, allowing them to form a complex with Smad4. The Smad2/3-Smad4 complex then translocates to the nucleus where it can either promote or inhibit transcription of target genes (28, 29). We wanted to determine which of these proteins are affected by miR-17~92.
Previously, miR-17 and -20a (with identical seed sequences) were shown to inhibit expression of the luciferase reporter when it was fused to the 3’-UTR of TGFBR2 (30). However this repression had not been observed in the context of the endogenously expressed receptor, which became the focus of the next series of experiments.
To re-confirm that TGFBR2 is a direct target of miR-17/20a, we generated two psiCHECK™-2-based bi-cistronic firefly/renilla luciferase sensor vectors, wherein the coding sequence of the Renilla luciferase is followed by ~100 nucleotide synthetic DNA fragment encompassing the predicted miR-17/20a binding site from TGFBR2 3’-UTR in either wild-type or seed-mutated conformation (see Materials and Methods). The recombinant constructs were transfected into DLD1 Dicerhypo cells along with miR-17 or control mimic. Consistent with in silico predictions and published data (30), inclusion of the miR-17/20a site decreased protein output in a manner dependent on co-transfection with the cognate miR and retention of the intact seed homology sequence (Figure 3A). This suggests that TGFBR2 is indeed a direct target of miR-17/20a.
Figure 3. miR-17~92 targets endogenous TGFβ receptor II.

A. Luciferase sensor assay. Constructs tested were psiCHECK™-2 derivatives containing a single miR-17/20a binding site from TGFBR2 3’UTR in either wild type (wt) or seed-mutated (mut) conformation. Cells were additionally co-transfected with miR-17 or control mimic. Results are expressed as ratios of renilla to firefly luciferase, the latter being constitutively expressed from the same vector and serving as a control for transfection efficiency. Sequence alignment corresponds to positions 268–274 of TGFBR2 3’UTR and mature hsa-miR-17. Arrows indicate mutated nucleotides. B. Expression levels of TGFBR2 mRNA in DLD1 Dicerhypo cells 10 hours after transfection with microRNA mimics (25 nM). mRNA levels were quantified by microarray. C. Immunoblotting analysis of TGFBR2 and clusterin expression levels in Ras cells transfected with 10 nM of non-targeting siRNA pool or siRNA pool targeting mouse TGFBR2. D,E. Immunoblotting analysis of TGFBR2 and Smad3 in Ras cells 20 hours after transfection with microRNA mimics (25 nM). Bottom panels represent quantitations of Western blots above.
To extend our observation to the endogenous transcript, we then transfected the corresponding mimics into DLD1 Dicerhypo cells. Once again, transfection of miR-17 and -20a but not other members of the cluster into these cells resulted in reduced TGFBR2 mRNA levels (Figure 3B, asterisks.) However, TGFBR2 protein levels could not be studied in common human colon cancer cell lines such as HCT116 or DLD1 since they are microsatellite-instable and have mutations crippling TGFBR2 expression (31). We thus performed this analysis in Ras colonocytes.
To verify that TGFBR2 levels control clusterin expression in these cells, we transfected Ras cells with a pool of siRNAs against TGFBR2 and observed a concomitant decrease in TGFBR2 and clusterin (Figure 3C). To test whether miR-17~92 targets endogenous TGFBR2, we transfected each miR-17~92 mimic into Ras colonocytes. We found that miR-17 and miR-20a reduced TGFBR2 protein levels 20 hours after transfection most strongly, while miR-18a mimic had a modest effect. (Figure 3D top.) To assure accurate measurements, bands were quantified using a LI-COR Biosciences Odyssey Infrared Imager and appropriate IRDye-labeled antibodies (Figure 3D bottom). To determine if reduced TGFBR2 levels affect Smad3 activation, we treated cells transfected with miR-17, -18a, and -20a with TGFβ and measured levels of total and phosphorylated Smad3. Again, while steady-state levels of Smad3 remained constant, pSmad3 levels were reduced in miR-17 and -20a-transfected cells, as measured by imaging of Western blots (Figure 3E, top and bottom.)
To determine whether other mediators of TGFβ signaling could also be among miR-17~92 targets, we evaluated levels of the receptor-regulated Smads (Smad2 and Smad3) and the principal co-Smad (Smad4) in the presence of overexpressed miR-17~92. Immunoblotting revealed that Smad2 and Smad3 levels were unaffected by miR-17~92, but Smad4 levels were appreciably lower in miR-17~92-transduced cells (Figure 4A.) To determine if this regulation also occurs in human colon cancer cell lines, we transfected DLD1 Dicerhypo cells with a mixture of all six 17~92 mimics and measured Smad4 protein levels 24 and 48 hours after transfection. At both time points Smad4 levels were more than 2-fold lower than in control mimic-transfected cells (Figure 4B.)
Figure 4. miR-17~92 inhibits expression of Smad4.

A. Immunoblotting for Smad2, Smad3 and Smad4 in stably transduced Ras/vector and Ras/miR-17~92 cells. B. Immunoblotting for Smad4 in DLD1 Dicerhypo cells 24 and 48 hours after transfection with control mimic or the mix of six 17~92 mimics. The ratio of Smad4-to-actin is plotted below. C. Smad4 mRNA expression levels in DLD1 Dicerhypo cells 24 hours after transfection with five individual 17~92 mimics (miR-19b was not tested), as analyzed by microarray. Asterisk indicates the most profound down-regulation of Smad4 mRNA, although in all five transfections statistically significant downregulation was observed. D. Luciferase reporter assay performed on predicted miR-17, -19, and 18a binding sites in the human Smad4 gene. Results are expressed as a ratio of renilla to firefly luciferase. Sequence alignment corresponds to positions 1357–1363, 1354–1360, and 5491–5497 of Smad4 3’UTR and mature hsa-miR-17, -19a, and -18a, respectively. Arrows indicate mutated nucleotides.
We wanted to determine how miR-17~92 regulates Smad4 expression since Smad4, a tumor suppressor gene predominantly involved in gastrointestinal tumorigenesis, has been reported to affect angiogenesis (32) but has not been proven to be a target of any specific microRNA. To this end, we transfected DLD1 Dicerhypo cells with individual mimics and measured Smad4 mRNA levels. Interestingly, all miR-17~92 mimics tested decreased Smad4 mRNA levels, but this down-regulation was most profound with miR-18a (Figure 4C.) In the human Smad4 3’UTR, TargetScan predicts binding sites for miR-17 and -19 as well as miR-18a. To determine whether any of these were bona fide target sites, we constructed six sets of psiCHECK2-based sensor plasmids as described above. DLD1 Dicerhypo cells were transfected with these constructs and also control or cognate mimics. The results shown in Figure 4D demonstrate that of the three sequences tested, only the miR-18a homology region is a bona fide binding site. Not only did transfection with miR-18a mimic reduce protein output (asterisk in column 2), but it was restored (albeit partly) when the seed homology sequence was mutated (double asterisk in column 4.) That the mutant construct was still partially sensitive to the miR-18a mimic could be attributed to the fact that the mir-18a site in Smad4 contains additional base pairing at the 3’ end, which might increase tolerance of mutations in the seed sequence (33). Of note, this set of mutations was designed to be subtle and resulted in a single one-nucleotide bulge (Figure 4D, right panel, middle arrow). Still, the importance of this site is underscored by its conservation among primates, macaques, mouse, rat, and guinea pig (24). Additionally, other microRNAs in the miR-17~92 cluster, which fail to target the reporter constructs tested but do affect the endogenous mRNA levels, might be affecting Smad4 through alternative binding sites or indirectly.
miR-17~92 host transcript levels inversely correlate with those of many TGFβ target genes
Concurrent down-regulation of both TGFBR2 and Smad4 by miR-17~92 cluster components suggested that this cluster could be a global attenuator of TGFβ signaling in various cell types. To corroborate this hypothesis, we took advantage of existing profiling studies, primarily of the Wooster dataset generated by GlaxoSmithKline and made available through the National Cancer Institute caArray portal (21). This dataset contains gene expression profiling data from 318 tumor cell lines. Notably, it documents expression levels of MIR17HG, the miR-17~92 primary transcript (Affy_ID 232291_at). To simplify analysis, the cell lines were grouped in 32 tumor types based on tissue of origin, and regression analysis was carried out to identify genes whose expression levels inversely correlate with that of MIR17HG. Provocatively, genes ranking #1 and #2 respectively were thbs1 (encoding thrombospondin-1) and CTGF, two known miR-17~92 targets (7) for which r2 exceeded 0.75 (Figure 5B.) That known targets of miR-17~92 topped the list was construed as a validation of this bioinformatics approach.
Figure 5. Inverse correlation between MIR17HG levels and those of TGFβ target genes.

A. Expression levels of TGFβ target genes in Dicer-deficient cell lines transfected with individual 17–92 mimics. In the heatmap cyan and magenta squares denote down- and up-regulated genes, respectively. B. Regression analysis performed on individual TGFβ target genes and MIR17HG. Each dot represents an individual tumor type. The dotted red rectangle denotes genes encoding known regulators of angiogenesis. C. The proposed connections between Myc - miR-17~92 axis, TGFβ pathway, TSR proteins, and angiogenesis.
We thus asked whether known TGFβ targets that are not targeted by miR-17~92 directly would also show inverse correlation with miR-17~92. To this end, we considered all genes upregulated by TGFβ at least 2-fold in all 4 different cell lines profiled in a recent study (34). The 12 genes that fit these criteria were as follows: ANGPTL4, BHLHB2/BHLHE40, CTGF, IL11, JUN, NEDD9, LARP6, RHOB, SERPINE1, SKIL, SMAD7, and ZEB1. We assessed their expression levels in both HCT119 and DLD1 Dicerhypo cells transfected with individual mimics and excluded all genes showing down-regulation by at least one mimic in at least one cell line, an indicator of potential TGFβ-independent regulation (cyan squares in the heatmap in Figure 5A). Additionally, we excluded SMAD7 and RHOB as they had predicted conserved miR-17~92 binding sites per TargetScan. This left us with 5 genes (ANGPTL4, IL11, JUN, LARP6, ZEB1) that could be reasonably considered to be miR-17~92 non-targets, and we added CLU to that list based on the data shown in Figure 2B. Regression analysis revealed that five out of six genes analyzed (with the exception of ZEB1) negatively correlated with MIR17HG, with r2 ranging from 0.38 to 0.69 (Figure 5B). Interestingly, 4 genes out of 8 [THBS1, CTGF, CLU, and ANGPTL4 (dotted red rectangle)] are known to encode proteins with anti-angiogenic properties [for Angptl4 data see (35)]. This led us to propose a mechanism whereby multiple inhibitors of angiogenesis are down-regulated by miR-17~92, either directly or via suppression of TGFβ signaling (Figure 5C).
Modest overexpression of miR-17~92 impairs gene regulation by TGFβ
The inverse correlation between MIR17HG levels and those of TGFβ target genes implied that most of the cell lines profiled produce and respond to endogenous TGFβ in an autocrine fashion. Another implicit assumption was that levels of MIR17HG correlate with those of mature 17~92 miRNAs. In order to test the effect of miR-17~92 on TGFβ signaling in a more defined setting, we wanted to identify cell lines with low miR-17~92 expression levels, transduce them with a miR-17~92 retrovirus, verify down-regulation of TGFβ signaling components, and assess responses to exogenous TGFβ.
To this end, we first analyzed MIR17HG levels across tumor types. Using the same Wooster dataset, we observed that glioblastomas (GBM) and hepatocellular carcinomas (HCC) have low MIR17HG levels (Figure 6A, black rectangles) We then chose four cell lines, three GBMs (A172, SF268, and U251) and one HCC (HepG2), and transduced them with the same miR-17~92 retrovirus as used previously for Ras colonocytes (7). To assess the overexpression level, we measured levels of miR-18a and miR-20a using qPCR. As expected, they were modestly elevated (2–8-fold) in transduced cells (Figure 6B). Furthermore, in these cells levels of TGFBR2 and Smad4 were appreciably lower than in “empty vector” cultures, while levels of Smad2 and Smad3 were unchanged (Figure 6C), consistent with data in Figures 3 and 4.
Figure 6. miR-17~92 impairs gene regulation by TGFβ.

A. Expression levels of MIR17HG across tumor types from the Wooster dataset. Error bars represent standard deviation. T-ALL denotes acute T-cell lymphoblastic leukemia, B-ALL - acute B-cell lymphoblastic leukemia, AML - acute myeloid leukemia, CML - chronic myeloid leukemia, CLL - chronic lymphoblastic leukemia. B. Fold overexpression of miR-18 and -20 in miR-17~92-tranduced glioblastoma (GBM) and hepatocellular carcinoma (HCC) cell lines relative to empty vector-transduced cells, as measured by qPCR. C. Expression levels of TGFBR2 and Smad proteins in cell lines depicted in the previous panel, as measured by Western blotting. D. Fold induction by TGFβ of three transcripts in the same cell lines as measured by qPCR. Treatment with TGFβ was carried out as in Figure 2. E. Comparison by qPCR of TGFβ effects on gene expression in miR-17~92-transduced cells relative to empty vector-transduced cells. F. Comparison by qPCR of TGFβ effects on ANGPTL4 in control (Ctrl) and miR-17~92 mimic-transfected A172 cells.
We then measured expression levels of 5 TGFβ “signature” genes: ANGPTL4, CLU, IL11, JUN, and LARP6. CLU was not induced by TGFβ in any of these cell lines and we were unable to detect IL11 mRNA (data not shown). For the remaining three genes, we observed consistent up-regulation by TGFβ in vector-transduced cells (Figure 6D). However, when vector- and miR-17~92-transduced cells were compared side by side, in all cases except one (ANGPTL4 in SF268 cells), activation by TGFβ was less robust in miR-17~92-transduced cells (Figure 6E). We thus concluded that attenuation by miR-17~92 of TGFβ signaling is not limited to TSR proteins and affects many other genes, presumably those for which TGFRB2 and Smad4 levels are rate-limiting.
To determine which microRNA(s) in the miR-17~92 cluster is primarily responsible for the observed effects, we transfected A172 cells with individual mimics as well as with admixed miRNAs and determined their effects on gene activation by TGFβ using ANGPTL4 as an example. As evidenced by data in Figure 6F, of all members of the cluster, miR-18a exerted the most profound negative effects (asterisk) comparable in scope to that caused by the admixed mimics. This result identifies this microRNA as a key attenuator of TGFβ signaling, at least in this particular cell type.
DISCUSSION
TGFβ and Myc have long been linked in the context of cell cycle progression, where the former is to the latter as yin is to yang. Indeed, TGFβ-induced growth arrest inevitably involves down-regulation of c-Myc and conversely, during Myc-induced transformation cells become refractory to the inhibitory effects of TGFβ (36). This interdependent, antagonistic relationship is commonly explained by a model wherein Myc (along with its interactor Miz1) and Smad2/3/4 compete for the binding to promoters of cdk-inhibitors, such as p21Cip1, p15Ink4b, and possibly p27Kip1 (37). In proliferating cells, these promoters are occupied by the Myc/Miz1 complex resulting in CDKI gene repression and cell cycle progression (38, 39). Upon exposure to TGFβ, Smad complexes gain the upper hand, induce CDKI expression, and block entry into the cell cycle [reviewed in (29, 40)].
Assuming that Myc must blunt the TGFβ responses to establish the transformed phenotype, this approach to TGFβ inhibition is surprisingly ineffective, since every target gene would need to be dealt with individually. The better way would be to intercept the TGFβ signal before it reaches the nucleus. Yet there was surprisingly little evidence that Myc employs this strategy. There is one published report showing that Myc binds to Smad2 and 3, but rather than inhibiting their transcriptional activity, Myc inhibits Smad-dependent activity of Sp1. Thus, such effects are presumably limited to promoters containing both Smad2/3 and Sp1 binding sites (41). And while TGFBR2 has been reported to be downregulated by c-Myc in B-cells, there was no evidence of direct promoter binding and consequently, the mechanism of downregulation remained unknown (42). Furthermore, the Myc Target Gene database does not include any of the Smads (43). However, the discovery of Myc-regulated microRNAs (10, 12) highlighted the possibility that some components of the TGFβ pathway could be affected by Myc indirectly, through microRNA clusters such as miR-17~92.
The effects of microRNAs, including miR-17~92, on TGFβ target genes are well-recognized. For example, two 2008 papers detailed how miR-200 and -205 directly target TGFβ responsive genes ZEB1 and ZEB2, thus contributing to epithelial-mesenchymal transition (44, 45). More relevantly, miR-17~92 also targets important TGFβ target genes, such as p21 (46) and most notably Bim (46–51). Yet these important papers offered no evidence of the microRNAs’ systemic effects on the TGFβ pathway. In fact, the reverse appears to be true: Smad proteins are known to control Drosha-mediated microRNA maturation (52). Thus, prior studies reinforced the prevailing view that miR-17~92 impairs TGFβ signaling by inhibiting transcription of individual TGFβ-responsive genes (53). This model was agnostic of possible targeting of TGFβ receptors and Smads; yet it was attractive because it incorporated miR-17~92 into the Myc-TGFβ axis and provided a mechanistic explanation for miR-17~92 overexpression (i.e., via Myc activation).
On the other hand, a couple of very recent papers demonstrated targeting by other miRs of various Smads. Relevant examples include the report of targeting of SMAD5 by miR-155 in diffuse large B-cell lymphoma (54). While this event might have implications for B-lymphomagenesis, what accounts for overexpression of miR-155 remains an open question. Similarly, another study demonstrated that miR-23b inhibits multiple Smads and promotes hepatocytes differentiation at the expense of cholangiocyte fate determination and bile duct formation (55). Yet how the miR-23b cluster is turned on was unclear. Overall, without knowing what controls the miR-based TGFβ switch, the understanding of the decision-making process remained incomplete.
In this study we demonstrate that miR-17~92 blunts TGFβ responses in colon cancer cells by directly targeting its receptor and the key effector Smad4. Moreover, these events are firmly placed downstream of Myc, which is a direct transcriptional regulator of miR-17~92 (7, 12). Although TGFBR2 and SMAD4 are known to be genetically inactivated in a subset of colon cancers with microsatellite instability (MSI), our data provide evidence that they could be repressed by Myc-regulated microRNAs in non-MSI tumors, which frequently overexpress c-Myc and exhibit DNA copy number gain of the miR-17~92 locus on 13q31 (56). Myc and miR-17~92 are known to cooperate in other tumor types as well, in particular in lymphoid tissues (57–59). Finally, our findings are likely to apply to N-Myc, which is known to upregulate miR-17~92 in neuro- and medulloblastomas (14, 60–62).
This provides a mechanistic explanation for two much broader biological questions: how does Myc counteract tumor suppressive effects of TGFβ, and how does it promote tumor angiogenesis? Our new data demonstrate that by increasing miR-17~92 levels and blunting TGFβ signaling, Myc can down-regulate a wider repertoire of anti-angiogenic factors than we appreciated previously. Notably, the revised list now includes clusterin (a.k.a. apolipoprotein J). While a direct effect of clusterin on tumor angiogenesis has not been previously reported, it was identified as a gene silenced in tumor-conditioned endothelial cells (63). Clusterin down-regulation stimulated growth and sprouting of endothelial cells and the repression of clusterin increased endothelial cell migration. Indeed, the ability of clusterin to inhibit angiogenesis may not be surprising given the homology between clusterin and some TSR proteins (23). Overall, putting the anti-angiogenic activity of clusterin, thrombospondin-1 and other TSR proteins in the context of colon carcinoma progression highlights the importance of cell-extrinsic mechanisms in cancer.
ACKNOWLEDGEMENTS
We are indebted to Drs. Anil Rustgi and Cameron Johnstone (University of Pennsylvania), Lars French (University of Zurich), Sabina Pucci (University of Rome “Tor Vergata”), and Arturo Sala (University College London) for sharing unpublished data on clusterin and Ms. Monica Lee (University of Pennsylvania) for the analysis of clusterin-overexpressing clones. We thank Dr Andrei Bakin (Roswell Park Cancer Institute) for pointing out the overlap between Myc- and TGFβ-regulated genes. Past and current members of our laboratories (in particular Drs. Cinzia Sevignani and Elena Sotillo Piñeiro) are acknowledged for many stimulating discussions and Dr. Tom Curran (Children’s Hospital of Philadelphia) - for general guidance. Dr. Jim Zhe Zhang from the Children’s Hospital of Philadelphia Bioinformatics Core contributed to the analysis of the Wooster dataset. We are grateful to the Rosetta Gene Expression Laboratory for performing microarray hybridization experiments and Miho Kibukawa (Merck & Co., Inc.) - for technical support.
Financial support: This work was supported by the NCI grant R01 CA122334, pilot funds from the NCI grant P30 CA016520 and NIDDK grant P30 DK050306, the Institutional Development Fund of the Children’s Hospital of Philadelphia (ATT), Cancer Research Institute Immunobiology training grant (JLF), and NCI training grant T32 CA009140 (PS). Optical Imaging Core of Small Animal Imaging Facility at the University of Pennsylvania was supported in part by the NCI grant U54 CA105008.
Footnotes
Authors’ contribution: Jamie Fox and Stacy Hultine contributed equally to this work
Potential conflict of interest: Michele Cleary is an employee of Merck & Co. Inc.
REFERENCES
- 1.Meyer N, Penn LZ. Reflecting on 25 years with MYC. Nat Rev Cancer. 2008;8:976–990. doi: 10.1038/nrc2231. [DOI] [PubMed] [Google Scholar]
- 2.Shchors K, Evan G. Tumor angiogenesis: cause or consequence of cancer? Cancer Res. 2007;67:7059–7061. doi: 10.1158/0008-5472.CAN-07-2053. [DOI] [PubMed] [Google Scholar]
- 3.Pelengaris S, Littlewood T, Khan M, Elia G, Evan GI. Reversible activation of c-Myc in skin: induction of a complex neoplastic phenotype by a single oncogenic lesion. Mol Cell. 1999;3:565–577. doi: 10.1016/s1097-2765(00)80350-0. [DOI] [PubMed] [Google Scholar]
- 4.Shchors K, Shchors E, Rostker F, Lawlor ER, Brown-Swigart L, Evan GI. The Myc-dependent angiogenic switch in tumors is mediated by interleukin 1beta. Genes Dev. 2006;20:2527–2538. doi: 10.1101/gad.1455706. [DOI] [PMC free article] [PubMed] [Google Scholar]
- 5.Brandvold KA, Neiman P, Ruddell A. Angiogenesis is an early event in the generation of myc-induced lymphomas. Oncogene. 2000;19:2780–2785. doi: 10.1038/sj.onc.1203589. [DOI] [PubMed] [Google Scholar]
- 6.Ngo C, Gee MS, Akhtar N, Yu D, Volpert OV, Auerbach R, et al. An in vivo function for the transforming myc protein: elicitation of the angiogenic phenotype. Cell Growth Differ. 2000;11:201–210. [PMC free article] [PubMed] [Google Scholar]
- 7.Dews M, Homayouni A, Yu D, Murphy D, Sevignani C, Wentzel E, et al. Augmentation of tumor angiogenesis by a Myc-activated microRNA cluster. Nat Genet. 2006;38:1060–1065. doi: 10.1038/ng1855. [DOI] [PMC free article] [PubMed] [Google Scholar]
- 8.Janz A, Sevignani C, Kenyon K, Ngo C, Thomas-Tikhonenko A. Activation of the Myc oncoprotein leads to increased turnover of thrombospondin-1 mRNA. Nucl Acids Res. 2000;28 doi: 10.1093/nar/28.11.2268. 2268-5. [DOI] [PMC free article] [PubMed] [Google Scholar]
- 9.Ghildiyal M, Zamore PD. Small silencing RNAs: an expanding universe. Nat Rev Genet. 2009;10:94–108. doi: 10.1038/nrg2504. [DOI] [PMC free article] [PubMed] [Google Scholar]
- 10.Chang T-C, Yu D, Lee Y-S, Arking DE, West CM, Dang CV, et al. Widespread microRNA repression by c-Myc promotes tumorigenesis. Nat Genet. 2008;40:43–50. doi: 10.1038/ng.2007.30. [DOI] [PMC free article] [PubMed] [Google Scholar]
- 11.Lin CH, Jackson AL, Guo J, Linsley PS, Eisenman RN. Myc-regulated microRNAs attenuate embryonic stem cell differentiation. EMBO J. 2009;28:3157–3170. doi: 10.1038/emboj.2009.254. [DOI] [PMC free article] [PubMed] [Google Scholar]
- 12.O'Donnell KA, Wentzel EA, Zeller KI, Dang CV, Mendell JT. c-Myc-regulated microRNAs modulate E2F1 expression. Nature. 2005;435:839–843. doi: 10.1038/nature03677. [DOI] [PubMed] [Google Scholar]
- 13.Thomas-Tikhonenko A, Viard-Leveugle I, Dews M, Wehrli P, Sevignani C, Yu D, et al. Myc-transformed epithelial cells down-regulate clusterin which inhibits their growth in vitro and carcinogenesis in vivo. Cancer Res. 2004;64:3126–3136. doi: 10.1158/0008-5472.can-03-1953. [DOI] [PubMed] [Google Scholar]
- 14.Chayka O, Corvetta D, Dews M, Caccamo AE, Piotrowska I, Santilli G, et al. Clusterin, a haploinsufficient tumour suppressor gene in neuroblastomas. J Natl Cancer Inst. 2009;101:663–677. doi: 10.1093/jnci/djp063. [DOI] [PMC free article] [PubMed] [Google Scholar]
- 15.Trougakos IP, Djeu JY, Gonos ES, Boothman DA. Advances and challenges in basic and translational research on clusterin. Cancer Res. 2009;69:403–406. doi: 10.1158/0008-5472.CAN-08-2912. [DOI] [PMC free article] [PubMed] [Google Scholar]
- 16.Sevignani C, Wlodarski P, Kirillova J, Mercer WE, Danielson KG, Iozzo RV, et al. Tumorigenic conversion of p53-deficient colon epithelial cells by an activated Ki-ras gene. J Clin Inv. 1998;101:1572–1580. doi: 10.1172/JCI919. [DOI] [PMC free article] [PubMed] [Google Scholar]
- 17.Cummins JM, He Y, Leary RJ, Pagliarini R, Diaz LA, Jr, Sjoblom T, et al. The colorectal microRNAome. Proc Natl Acad Sci USA. 2006;103:3687–3692. doi: 10.1073/pnas.0511155103. [DOI] [PMC free article] [PubMed] [Google Scholar]
- 18.Suh E, Zhengqi W, Swain GP, Tenniswood M, Traber PG. Clusterin gene transcription is activated by caudal-related homeobox genes in intestinal epithelium. Am J Physiol. 2001;280:G149–G156. doi: 10.1152/ajpgi.2001.280.1.G149. [DOI] [PubMed] [Google Scholar]
- 19.Hunter CA, Yu D, Gee M, Ngo C, Sevignani C, Goldscmidt M, et al. Cutting edge: Systemic inhibition of angiogenesis underlies resistance to tumors during acute toxoplasmosis. J Immunol. 2001;166:5878–5881. doi: 10.4049/jimmunol.166.10.5878. [DOI] [PubMed] [Google Scholar]
- 20.Hughes TR, Mao M, Jones AR, Burchard J, Marton MJ, Shannon KW, et al. Expression profiling using microarrays fabricated by an ink-jet oligonucleotide synthesizer. Nat Biotechnol. 2001;19:342–347. doi: 10.1038/86730. [DOI] [PubMed] [Google Scholar]
- 21.Wooster R. Transcript profiling of cancer cell line panel. 2008 https://array nci nih gov/caarray/project/woost-00041.
- 22.Yang CR, Leskov K, Hosley-Eberlein K, Criswell T, Pink JJ, Kinsella TJ, et al. Nuclear clusterin/XIP8, an x-ray-induced Ku70-binding protein that signals cell death. Proc Natl Acad Sci USA. 2000;97:5907–5912. doi: 10.1073/pnas.97.11.5907. [DOI] [PMC free article] [PubMed] [Google Scholar]
- 23.Jenne DE, Tschopp J. Clusterin: the intriguing guises of a widely expressed glycoprotein. Trends Biochem Sci. 1992;17:154–159. doi: 10.1016/0968-0004(92)90325-4. [DOI] [PubMed] [Google Scholar]
- 24.Grimson A, Farh KK, Johnston WK, Garrett-Engele P, Lim LP, Bartel DP. MicroRNA targeting specificity in mammals: determinants beyond seed pairing. Mol Cell. 2007;27:91–105. doi: 10.1016/j.molcel.2007.06.017. [DOI] [PMC free article] [PubMed] [Google Scholar]
- 25.Linsley PS, Schelter J, Burchard J, Kibukawa M, Martin MM, Bartz SR, et al. Transcripts targeted by the microRNA-16 family cooperatively regulate cell cycle progression. Mol Cell Biol. 2007;27:2240–2252. doi: 10.1128/MCB.02005-06. [DOI] [PMC free article] [PubMed] [Google Scholar]
- 26.Chung EY, Dews M, Cozma D, Yu D, Wentzel EA, Chang TC, et al. c-Myb oncoprotein is an essential target of the dleu2 tumor suppressor microRNA cluster. Cancer Biol Ther. 2008;7:1758–1764. doi: 10.4161/cbt.7.11.6722. [DOI] [PMC free article] [PubMed] [Google Scholar]
- 27.Jin G, Howe PH. Regulation of clusterin gene expression by transforming growth factor β. J Biol Chem. 1997;272:26620–26626. doi: 10.1074/jbc.272.42.26620. [DOI] [PubMed] [Google Scholar]
- 28.Bierie B, Moses HL. Tumour microenvironment: TGFβ: the molecular Jekyll and Hyde of cancer. Nat Rev Cancer. 2006;6:506–520. doi: 10.1038/nrc1926. [DOI] [PubMed] [Google Scholar]
- 29.Massague J. TGFβ in cancer. Cell. 2008;134:215–230. doi: 10.1016/j.cell.2008.07.001. [DOI] [PMC free article] [PubMed] [Google Scholar]
- 30.Volinia S, Calin GA, Liu CG, Ambs S, Cimmino A, Petrocca F, et al. A microRNA expression signature of human solid tumors defines cancer gene targets. Proc Natl Acad Sci USA. 2006;103:2257–2261. doi: 10.1073/pnas.0510565103. [DOI] [PMC free article] [PubMed] [Google Scholar]
- 31.Markowitz S, Wang J, Myeroff L, Parsons R, Sun L, Lutterbaugh J, et al. Inactivation of the type II TGF-beta receptor in colon cancer cells with microsatellite instability. Science. 1995;268:1336–1338. doi: 10.1126/science.7761852. [DOI] [PubMed] [Google Scholar]
- 32.Schwarte-Waldhoff I, Volpert OV, Bouck NP, Sipos B, Hahn SA, Klein-Scory S, et al. Smad4/DPC4-mediated tumor suppression through suppression of angiogenesis. Proc Natl Acad Sci USA. 2000;97:9624–9629. doi: 10.1073/pnas.97.17.9624. [DOI] [PMC free article] [PubMed] [Google Scholar]
- 33.Miranda KC, Huynh T, Tay Y, Ang YS, Tam WL, Thomson AM, et al. A pattern-based method for the identification of MicroRNA binding sites and their corresponding heteroduplexes. Cell. 2006;126:1203–1217. doi: 10.1016/j.cell.2006.07.031. [DOI] [PubMed] [Google Scholar]
- 34.Padua D, Zhang XH, Wang Q, Nadal C, Gerald WL, Gomis RR, et al. TGFβ primes breast tumors for lung metastasis seeding through angiopoietin-like 4. Cell. 2008;133:66–77. doi: 10.1016/j.cell.2008.01.046. [DOI] [PMC free article] [PubMed] [Google Scholar]
- 35.Ito Y, Oike Y, Yasunaga K, Hamada K, Miyata K, Matsumoto S, et al. Inhibition of angiogenesis and vascular leakiness by angiopoietin-related protein 4. Cancer Res. 2003;63:6651–6657. [PubMed] [Google Scholar]
- 36.Alexandrow MG, Kawabata M, Aakre M, Moses HL. Overexpression of the c-Myc oncoprotein blocks the growth-inhibitory response but is required for the mitogenic effects of transforming growth factor β1. Proc Natl Acad Sci USA. 1995;92:3239–3243. doi: 10.1073/pnas.92.8.3239. [DOI] [PMC free article] [PubMed] [Google Scholar]
- 37.Warner BJ, Blain SW, Seoane J, Massague J. Myc downregulation by transforming growth factor β required for activation of the p15(Ink4b) G(1) arrest pathway. Mol Cell Biol. 1999;19:5913–5922. doi: 10.1128/mcb.19.9.5913. [DOI] [PMC free article] [PubMed] [Google Scholar]
- 38.Seoane J, Pouponnot C, Staller P, Schader M, Eilers M, Massague J. TGFβ influences Myc, Miz-1 and Smad to control the CDK inhibitor p15INK4b. Nature Cell Biol. 2001;3:400–408. doi: 10.1038/35070086. [DOI] [PubMed] [Google Scholar]
- 39.Staller P, Peukert K, Kiermaier A, Seoane J, Lukas J, Karsunky H, et al. Repression of p15INK4b expression by Myc through association with Miz-1. Nat Cell Biol. 2001;3:392–399. doi: 10.1038/35070076. [DOI] [PubMed] [Google Scholar]
- 40.Amati B. Integrating Myc and TGFβ signalling in cell-cycle control. Nat Cell Biol. 2001;3:E112–E113. doi: 10.1038/35074634. [DOI] [PubMed] [Google Scholar]
- 41.Feng XH, Liang YY, Liang M, Zhai W, Lin X. Direct interaction of c-Myc with Smad2 and Smad3 to inhibit TGF-β-mediated induction of the CDK inhibitor p15(Ink4B) Mol Cell. 2002;9:133–143. doi: 10.1016/s1097-2765(01)00430-0. [DOI] [PubMed] [Google Scholar]
- 42.Schuhmacher M, Kohlhuber F, Holzel M, Kaiser C, Burtscher H, Jarsch M, et al. The transcriptional program of a human B cell line in response to Myc. Nucl Acids Res. 2001;29:397–406. doi: 10.1093/nar/29.2.397. [DOI] [PMC free article] [PubMed] [Google Scholar]
- 43.Zeller KI, Jegga AG, Aronow B, O'Donnell KA, Dang CV. An integrated database of genes responsive to the Myc oncogenic transcription factor: identification of direct genomic targets. Genome Biol. 2003;4:R69.1–R69.10. doi: 10.1186/gb-2003-4-10-r69. [DOI] [PMC free article] [PubMed] [Google Scholar]
- 44.Gregory PA, Bert AG, Paterson EL, Barry SC, Tsykin A, Farshid G, et al. The miR-200 family and miR-205 regulate epithelial to mesenchymal transition by targeting ZEB1 and SIP1. Nat Cell Biol. 2008;10:593–601. doi: 10.1038/ncb1722. [DOI] [PubMed] [Google Scholar]
- 45.Park SM, Gaur AB, Lengyel E, Peter ME. The miR-200 family determines the epithelial phenotype of cancer cells by targeting the E-cadherin repressors ZEB1 and ZEB2. Genes Dev. 2008;22:894–907. doi: 10.1101/gad.1640608. [DOI] [PMC free article] [PubMed] [Google Scholar]
- 46.Fontana L, Fiori ME, Albini S, Cifaldi L, Giovinazzi S, Forloni M, et al. Antagomir-17-5p abolishes the growth of therapy-resistant neuroblastoma through p21 and BIM. PLoS ONE. 2008;3:e2236. doi: 10.1371/journal.pone.0002236. [DOI] [PMC free article] [PubMed] [Google Scholar]
- 47.Ventura A, Young AG, Winslow MM, Lintault L, Meissner A, Erkeland SJ, et al. Targeted deletion reveals essential and overlapping functions of the miR-17 through 92 family of miRNA clusters. Cell. 2008;132:875–886. doi: 10.1016/j.cell.2008.02.019. [DOI] [PMC free article] [PubMed] [Google Scholar]
- 48.Koralov SB, Muljo SA, Galler GR, Krek A, Chakraborty T, Kanellopoulou C, et al. Dicer ablation affects antibody diversity and cell survival in the B lymphocyte lineage. Cell. 2008;132:860–874. doi: 10.1016/j.cell.2008.02.020. [DOI] [PubMed] [Google Scholar]
- 49.Xiao C, Srinivasan L, Calado DP, Patterson HC, Zhang B, Wang J, et al. Lymphoproliferative disease and autoimmunity in mice with increased miR-17-92 expression in lymphocytes. Nat Immunol. 2008;9:405–414. doi: 10.1038/ni1575. [DOI] [PMC free article] [PubMed] [Google Scholar]
- 50.Mavrakis KJ, Wolfe AL, Oricchio E, Palomero T, de KK, McJunkin K, et al. Genome-wide RNA-mediated interference screen identifies miR-19 targets in Notch-induced T-cell acute lymphoblastic leukaemia. Nat Cell Biol. 2010;12:372–379. doi: 10.1038/ncb2037. [DOI] [PMC free article] [PubMed] [Google Scholar]
- 51.Inomata M, Tagawa H, Guo YM, Kameoka Y, Takahashi N, Sawada K. MicroRNA-17-92 down-regulates expression of distinct targets in different B-cell lymphoma subtypes. Blood. 2009;113:396–402. doi: 10.1182/blood-2008-07-163907. [DOI] [PubMed] [Google Scholar]
- 52.Davis BN, Hilyard AC, Lagna G, Hata A. SMAD proteins control DROSHA-mediated microRNA maturation. Nature. 2008;454:56–61. doi: 10.1038/nature07086. [DOI] [PMC free article] [PubMed] [Google Scholar]
- 53.Petrocca F, Vecchione A, Croce CM. Emerging role of miR-106b-25/miR-17-92 clusters in the control of transforming growth factor β signaling. Cancer Res. 2008;68:8191–8194. doi: 10.1158/0008-5472.CAN-08-1768. [DOI] [PubMed] [Google Scholar]
- 54.Rai D, Kim SW, McKeller MR, Dahia PL, Aguiar RC. Targeting of SMAD5 links microRNA-155 to the TGF-beta pathway and lymphomagenesis. Proc Natl Acad Sci U S A. 2010;107:3111–3116. doi: 10.1073/pnas.0910667107. [DOI] [PMC free article] [PubMed] [Google Scholar]
- 55.Rogler CE, Levoci L, Ader T, Massimi A, Tchaikovskaya T, Norel R, et al. MicroRNA-23b cluster microRNAs regulate transforming growth factor-beta/bone morphogenetic protein signaling and liver stem cell differentiation by targeting Smads. Hepatology. 2009;50:575–584. doi: 10.1002/hep.22982. [DOI] [PubMed] [Google Scholar]
- 56.Diosdado B, van de Wiel MA, Terhaar Sive Droste JS, Mongera S, Postma C, Meijerink WJ, et al. MiR-17-92 cluster is associated with 13q gain and c-myc expression during colorectal adenoma to adenocarcinoma progression. Br J Cancer. 2009;101:707–714. doi: 10.1038/sj.bjc.6605037. [DOI] [PMC free article] [PubMed] [Google Scholar]
- 57.He L, Thomson JM, Hemann MT, Hernando-Monge E, Mu D, Goodson S, et al. A microRNA polycistron as a potential human oncogene. Nature. 2005;435:828–833. doi: 10.1038/nature03552. [DOI] [PMC free article] [PubMed] [Google Scholar]
- 58.Olive V, Bennett MJ, Walker JC, Ma C, Jiang I, Cordon-Cardo C, et al. miR-19 is a key oncogenic component of mir-17-92. Genes Dev. 2009;23:2839–2849. doi: 10.1101/gad.1861409. [DOI] [PMC free article] [PubMed] [Google Scholar]
- 59.Mu P, Han YC, Betel D, Yao E, Squatrito M, Ogrodowski P, et al. Genetic dissection of the miR-17~92 cluster of microRNAs in Myc-induced B-cell lymphomas. Genes Dev. 2009;23:2806–2811. doi: 10.1101/gad.1872909. [DOI] [PMC free article] [PubMed] [Google Scholar]
- 60.Fontana L, Pelosi E, Greco P, Racanicchi S, Testa U, Liuzzi F, et al. MicroRNAs 17-5p-20a-106a control monocytopoiesis through AML1 targeting and M-CSF receptor upregulation. Nat Cell Biol. 2007;9:775–787. doi: 10.1038/ncb1613. [DOI] [PubMed] [Google Scholar]
- 61.Schulte JH, Horn S, Otto T, Samans B, Heukamp LC, Eilers UC, et al. MYCN regulates oncogenic MicroRNAs in neuroblastoma. Int J Cancer. 2008;122:699–704. doi: 10.1002/ijc.23153. [DOI] [PubMed] [Google Scholar]
- 62.Northcott PA, Fernandez L, Hagan JP, Ellison DW, Grajkowska W, Gillespie Y, et al. The miR-17/92 polycistron is up-regulated in sonic hedgehog-driven medulloblastomas and induced by N-myc in sonic hedgehog-treated cerebellar neural precursors. Cancer Res. 2009;69:3249–3255. doi: 10.1158/0008-5472.CAN-08-4710. [DOI] [PMC free article] [PubMed] [Google Scholar]
- 63.Hellebrekers DM, Melotte V, Vire E, Langenkamp E, Molema G, Fuks F, et al. Identification of epigenetically silenced genes in tumor endothelial cells. Cancer Res. 2007;67:4138–4148. doi: 10.1158/0008-5472.CAN-06-3032. [DOI] [PubMed] [Google Scholar]