Abstract
Many patients with advanced bladder cancer develop lethal metastases to the lung. The vasoconstricting protein endothelin-1 (ET-1) has been implicated in this process, although the mechanism(s) by which it promotes metastasis remains unclear. Here, we have evaluated whether tumor ET-1 expression can serve as a biomarker for lung metastasis and whether it is required for metastatic disease. Evaluation of ET-1 mRNA and protein expression in four patient cohorts revealed that levels of ET-1 are higher in patients with muscle-invasive bladder cancers, which are associated with higher incidence of metastasis, and that high ET-1 levels are associated with decreased disease-specific survival. Consistent with its proinflammatory activity, we found that tumor-derived ET-1 acts through endothelin-1 receptor A (ETAR) to enhance migration and invasion of both tumor cells and macrophages and induces expression of inflammatory cytokines and proteases. Using human and mouse cancer cells depleted of ET-1 and pharmacologic blockade of ET receptors in lung metastasis models, we found that tumor ET-1 expression and ETAR activity are necessary for metastatic lung colonization and that this process is preceded by and dependent on macrophage infiltration of the lung. In contrast, tumor ET-1 expression and ETAR activity appeared less important in established primary or metastatic tumor growth. These findings strongly suggest that ETAR inhibitors might be more effective as adjuvant therapeutic agents than as initial treatment for advanced primary or metastatic disease.
Introduction
Nearly 14,680 deaths are expected to occur in 2010 (1) from bladder cancer, primarily from metastatic disease, with the lung being a common site (2). Comparative gene expression studies of human bladder cancer tissues and cell lines have implicated endothelin-1 (ET-1) as a mediator of this process (3). Pharmacologic blockade of ET-1 receptor A (ETAR) was found to suppress lung colonization (3), while this maneuver did not suppress subcutaneous growth of bladder cancer xenografts (4). ET-1, an endothelial cell–derived vasoconstrictor peptide, is an important member of the endothelin family (5–7) with myriad developmental, physiological, and pathological functions (8). The so-called endothelin axis consists of three similar small peptides, ET-1, ET-2, and ET-3, two G protein–coupled receptors, ETAR and ETBR, and two membrane-bound proteases, the ET-converting enzymes, ECE-1 and ECE-2 (8), that activate the secreted pro-forms of the peptide. ET-1 production is stimulated by a variety of cytokines and growth factors, hypoxia, and shear stress, while ETAR activation triggers signaling networks involved in cell proliferation, new vessel formation, invasion, inflammation, and metastatic spread (8–11). ET-1 is secreted by human carcinoma cell lines and detected in malignant tissue (12–15). Based on these findings, receptor inhibitors have been developed and used in clinical trials in cancer and other diseases (10, 16). Importantly, endothelins also modulate trafficking, differentiation, and activation of tumor-associated immune cells (17–24), possibly contributing to immune evasion and resistance to immunotherapy (25, 26). ET-1 can induce expression of IL-6, MCP-1, and COX-2, key orchestrators of inflammation-mediated cancer cell invasiveness and metastasis via AP-1 and NF-κB (27, 28), as well as MMP activity (9, 22).
Together, these data suggest a model whereby the endothelin axis, via ETAR, might drive bladder cancer lung colonization by regulating key factors in the microenvironment of disseminated tumor cells. Yet a clear definition of which cells produce and respond to ET-1 and the role of ETBR in this process remains to be determined. Here, we combine genetic and pharmacologic approaches in vitro and in vivo in human and murine models of experimental and spontaneous lung metastasis to answer these questions. Our data reveal for the first time to our knowledge that tumor ET-1 is a paracrine mediator of early metastatic colonization of the lung and that this is mediated through macrophage responsiveness to this peptide via ETAR. These findings strongly suggest that clinical trials with endothelin axis inhibitors should be used in the adjuvant setting rather than for the treatment of advanced metastatic disease or established primary tumors and highlight the need for preclinical evaluation of new drugs in the metastatic setting.
Results
ET-1, ECE-1, and ETAR expression is associated with bladder tumor invasion and survival in patients.
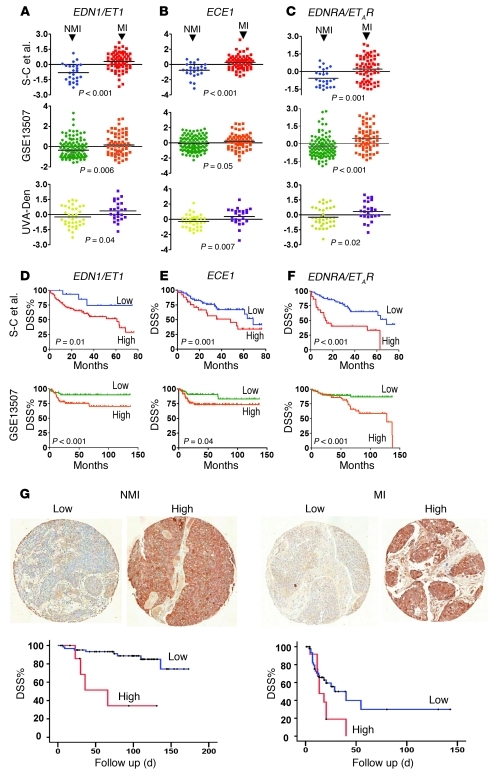
We investigated whether tumor mRNA expression of ET axis genes is correlated with key clinicopathologic parameters in human bladder cancer in three separate human studies (29–31). Since muscle-invasive-stage (MI-stage) disease is associated with a higher incidence of metastasis than non-muscle-invasive (NMI) disease, we first examined the association between expression level of these genes and invasion. Only EDN1/ET1, ECE1, and EDNRA/ETAR were significantly overexpressed in MI compared with NMI in all three studies (Figure 1, A–C). For two of these studies, we had access to follow-up data regarding disease-specific survival (DSS), which, because metastasis is lethal in most patients, is reflective of metastasis development. Classifying tumors by high (above median) or low (below median) expression of these genes, we found that high expression levels of EDN1/ET1, ECE1 and EDNRA/ETAR were each associated with decreased DSS (Figure 1, D–F). In contrast, the other genes in the ET axis were not uniformly associated with either stage or grade in all studies (Supplemental Figure 1; supplemental material available online with this article; doi: 10.1172/JCI42912DS1). We next analyzed ET-1 protein expression by immunohistochemistry in a fourth patient cohort with bladder tumors (Figure 1G). In patients with either NMI disease (n = 92) or MI disease (n = 102), associations were found between cytoplasmic ET-1 expression intensity and DSS (log-rank, P < 0.0005 and P = 0.047, respectively). Taking all tumors together (n = 194), ET-1 intensity was higher in MI compared with NMI tumors (P = 0.02, n = 194) in accordance with the mRNA findings (Figure 1, A and D) and suggested ET-1 is a putative biomarker of prognosis in human bladder cancer.
Figure 1. The association between the expression ET family genes, muscle invasion, and DSS in human bladder cancer.
(A–F) Datasets were used from Sanchez-Carbayo et al. (S-C et al.) (n = 26 and 65 for NMI and MI disease, respectively), GSE13507 (n = 103 and 62 for NMI and MI disease, respectively), and UVA-Den (n = 36 and 24, for NMI and MI, respectively). Data for the expression of ET1 (A), ECE1 (B), ETAR (C) were plotted using probesets identified in Methods. Dot plots represent standardized (z-scored) logged (base 2) expression of probes comparing NMI and MI tumors, and differences in distributions were tested by the Mann-Whitney U test. Kaplan-Meier curves show the association between expression of ET1 (D), ECE1 (E), and ETAR (F) expression and DSS of patients (log-rank). (G) Typical immunohistochemical staining of ET-1 in NMI and MI bladder cancer TMAs (total magnification, ×200). Kaplan-Meier curves reveal association of ET-1 protein expression as assessed by immunohistochemistry in 92 NMI and 102 MI tumor and DSS. Bladder cancer TMAs and IHC protocols and scoring are described in Methods.
ET-1 stimulates migration, invasion, and proteolytic activity of bladder cancer cells through ETAR.
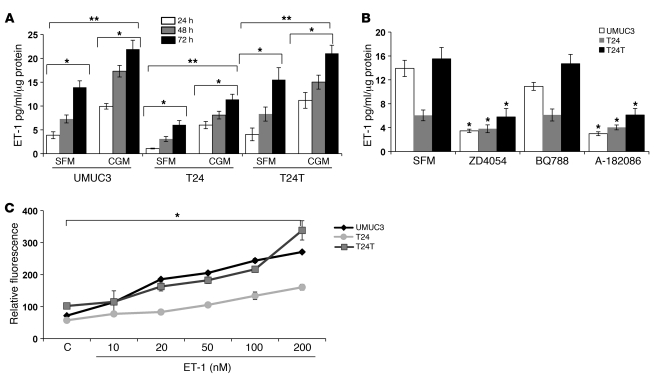
Given the association of ET-1 and ETAR expression with aggressive disease in human bladder tumors, we sought to characterize and then evaluate their role in models of this disease. We first tested three common human bladder cancer cell lines for secretion of ET-1 in vitro. The in vivo metastatic cell lines UMUC3 and T24T (32) as well as the nonmetastatic, poorly tumorigenic cell line T24 (32) all secrete ET-1 (Figure 2A). ET-1 was not detectable in either cell- and serum-free (SFM) or complete growth medium (CGM) used with all lines producing more ET-1 when grown in CGM compared with SFM, with T24 secreting the least in both conditions. Using a panel of pharmacologic inhibitors specific for the ETAR and/or ETBR, we found that only ETAR blockade inhibited ET-1 production (Figure 2B). We also found that ET-1 stimulated the in vitro growth of all 3 lines, with T24 cells least responsive to ET-1 (Figure 2C).
Figure 2. ET-1 production, autocrine regulation, and proliferative effect on bladder cancer cell lines.
(A) Bladder cancer cell lines secrete ET-1 in culture medium. UMUC3, T24, and T24T cell lines were plated in 24-well plates in CGM and SFM. Cells were harvested, and conditioned media (CM) were collected at the indicated time points. ET-1 level was determined in CM by an ELISA kit as per the manufacturer’s instructions. ET-1 values were normalized to protein contents of the cell lysates as determined by BCA. Bars represent mean ± SEM of results of 3 experiments, each done in duplicate. *P < 0.05, ANOVA, comparing ET-1 levels at the indicated time points under similar experimental conditions; **P < 0.05 comparing growth in SFM and CGM in the same cell line. (B) Autocrine regulation of ET-1 production by ETAR. Bladder cancer cells were grown to 75% confluence before treatment with ZD4054 (1 μmol/l), BQ788 (1 μmol/l), and A-182086 (10 μmol/l). CM was collected at 72 hours, and ET-1 was measured by ELISA. Bars represent mean ± SEM of results of 3 experiments each done in duplicate. *P < 0.05, Student’s t test, comparing treated cell lines with control untreated cells in SFM. (C) ET-1 promotes bladder cancer cell proliferation. ET-1 promotes proliferation of UMUC3, T24, and T24T cells in a concentration-dependent fashion. Cell lines were plated in 96-well plates (1,000 cells/100 μl/well) in CGM for 6 hours, before being stimulated with the indicated concentrations of ET-1 in growth medium with 2% FBS for 72 hours. DNA incorporation was measured by CyQuant assay as per the manufacturer’s instructions. *P < 0.05, ANOVA.
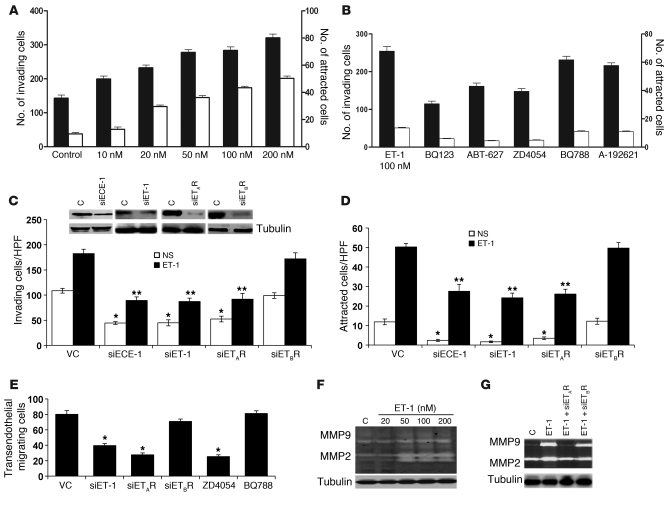
We then found that UMUC3 chemotaxis and Matrigel invasion were induced by ET-1 (Figure 3A) and that ETAR antagonists (BQ123, ABT-627, and ZD4054) significantly reduced this effect compared with ETBR antagonists (BQ788 and A-192621) (Figure 3B). To confirm the specificity of this effect to the ET-1/ETAR interaction, we depleted ET-1 expression, activation, or receptor expression by siRNAs (inset, Figure 3C). Silencing of siET-1, siECE-1, or siETAR, but not siETBR, in UMUC3 cells inhibited ET-1–induced chemotaxis and invasiveness (Figure 3D). Since invasion through the endothelium is important in both the intravasation and extravasation steps of the metastatic cascade, UMUC3 cells depleted for ET-1, ETAR, and ETBR were used in an in vitro assay of transendothelial migration. Migration of UMUC3 cells through the endothelial monolayer was inhibited by ET-1 and ETAR depletion as well as pharmacologic ETAR inhibition (Figure 3E).
Figure 3. ET-1 induces bladder cancer cell invasion, chemotaxis, transendothelial migration, and proteolytic activity.
(A) UMUC3 cells (1 × 10⁵ cells/100 μl, MEM-0.4% BSA) were added to the upper chamber of Matrigel-coated, 8-μm-pore-size polycarbonate inserts. Cells were allowed to invade matrix-coated inserts to the bottom chamber containing CGM or ET-1 (10–200 nM) in SFM. Invasion (black bars)/migration (white bars) assays were carried out for 5 hours. Cells attached to the bottom surface of the inserts were stained with DiffQuick and counted. UMUC3 cells were treated with ETAR inhibitors (BQ123, ABT-627, and ZD4054) or ETBR inhibitors (BQ788 and A-192621) (B) or transfected with siRNA targeting ET-1, ECE-1 (100 nM) or siETAR, siETBR (200 nM) or mock vector control siRNA (VC). Effective knockdown was determined in harvested cells 48 hours after transfection by Western blot (C, inset). Cells were then used for Matrigel invasion (C) and chemotaxis (D) assays as described above. *P < 0.05, compared with nonstimulated (NS) VC; **P < 0.05, compared with ET-1 stimulation, Student’s t test. (E) UMUC3 cells knocked down or not with siET-1/siETRs or treated with ZD4045 and BQ788 were allowed to traverse PMVECs grown on 8-μm inserts. Assays were carried out for 6 hours, after which cells on the undersurface of the inserts were counted. Bars represent mean ± SEM of 3 independent experiments performed in triplicate. *P < 0.05, Student’s t test. (F and G) UMUC3 cells transfected or not with siET-1, siETAR, and siETBR were stimulated with ET-1 (100 nM) in SFM for 72 hours. CM was collected, and MMP2 and MMP9 activity was detected in 10× CM. Cell lysates were probed with α-tubulin as loading control.
We also found in UMUC3 cells that ET-1 induced a marked concentration-dependent increase in the production and gelatinolytic activity of MMP2 and MMP9, two ET-1–dependent regulators of ECM invasion (11, 22, 33, 34) (Figure 3F) and that ETAR, but not ETBR, was mediating this effect (Figure 3G). Consistent with such a regulatory relationship operating in patient tumors, we found in two microarray studies (29, 30) that ET-1 expression positively correlated with MMP9 (r = 0.41 and 0.26, P < 0.001 and P = 0.05) and MMP2 (r = 0.49 and 0.50, both P < 0.001) expression in bladder tumors (Supplemental Figure 2, A and B).
Cancer-macrophage cell line coculture induces inflammatory cytokine production via the ET-1 axis.
Tumor-associated macrophages (TAMs) and other inflammatory cells have been found to play a critical role in tumor progression (35–37). Since ET-1 is a chemoattractant for macrophages, via MCP-1/CCL2 (26), it may promote tumor aggressiveness both by direct effects on the tumor as well as through engagement of inflammatory cells. Since tumor tissues profiled in the human studies (29, 30) described above (Figure 1) were not microdissected and thus may include a substantial proportion of non-neoplastic stromal and inflammatory cells, we sought to determine whether these data also supported a regulatory interaction between ET-1 and key inflammatory mediators and cytokines. Interestingly, we found that ET-1 expression was positively correlated with expression of MCP-1/CCL2 (r = 0.51 and 0.57, both P < 0.001), IL-6 (r = 0.56 and 0.46, both P < 0.001), and the key eicosanoid biosynthetic enzyme COX-2 (r = 0.35 and 0.34, P < 0.001 and P = 0.008) (Supplemental Figure 2, C–E).
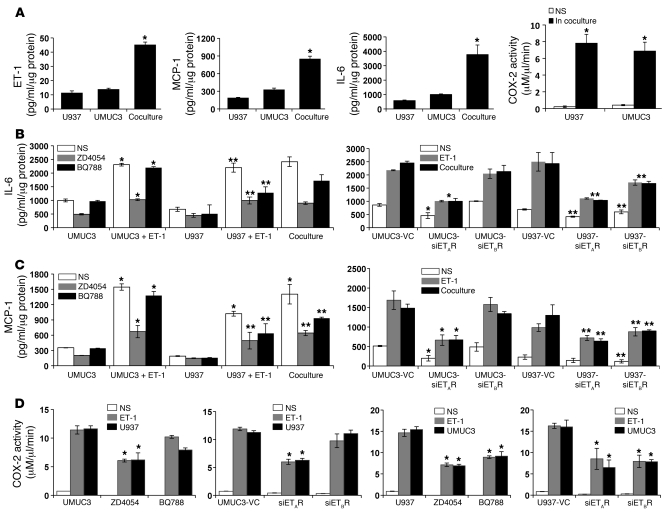
To determine whether paracrine interactions between bladder cancer cells and macrophages occur, we cocultured the UMUC3 cells with the human U937 macrophage cell line (38). Interestingly, ET-1 production was higher when the cells were grown together than either alone, even with adjustment for cell number and protein content (Supplemental Figure 3), indicating an increase in ET-1 in response to the coculture environment (11.37 ± 1.4 and 13.9 ± 0.7 pg/ml for single culture of U937 and UMUC3 cells, respectively, versus 45.2 ± 1.8 pg/ml for coculture, P < 0.0001) (Figure 4A). Similarly, we found that coculture of both cell lines across a cell impermeable barrier led to a synergistic increase in MCP-1 and IL-6, as well as cellular COX-2 activity (Figure 4A). Pharmacologic blockade or silencing ETAR but not ETBR expression in UMUC3 cells decreased the production of MCP-1, IL-6, and COX-2 activity, whereas in U937 cells, targeting either receptor inhibited production of these (Figure 4, B–D). Addition of ET-1 to either cell type phenocopied the effect of coculture (Figure 4, B–D).
Figure 4. Involvement of ET-1 axis in UMUC3 macrophage–induced inflammation.
(A) ET-1, MCP-1, and IL-6 production measured in CM collected at 72 hours from U937 and UMUC3 cells in single-cell and co-cultures, in which U937 was added on the top of cell-impermeable 0.4-μm inserts, without cell-cell contact, with UMUC3 monolayers in the bottom chambers. COX-2 activity was detected in cell lysates under the same experimental conditions. Bars represent the mean ± SEM of 2 independent experiments performed in triplicate. ET-1 and cytokine levels as well as COX-2 activity were normalized to protein content of the cell lysates in single-cell cultures and cell proliferation as detected by CyQuant.*P < 0.05, comparing coculture with either single NS cell culture. IL-6 (B) and MCP-1 (C) were measured in CM, collected at 72 hours, of UMUC3 and U937 cells either NS, stimulated with ET-1 (100 nM), or cocultured together, in the presence or absence of ZD4054 and BQ788. Alternatively, cells were transfected with siETAR or siETBR, before stimulation with ET-1 or coculture with the nontransfected other cell line. IL-6 and MCP-1 values were corrected to protein content of cell lysates. Bars represent the mean ± SEM of 2 experiments performed in triplicate. *P < 0.05, as compared with UMUC3 or UMUC3-VC; **P < 0.05, as compared with U937 or U937-VC. (D) COX-2 activity was measured in UMUC3 and U937 cell lysates under the same experimental conditions as in A and B. Bars represent the mean ± SEM of 2 experiments performed in triplicate. *P < 0.05, Student’s t test, as compared with corresponding control.
Macrophage infiltration and lung inflammation occur before visible lung metastasis.
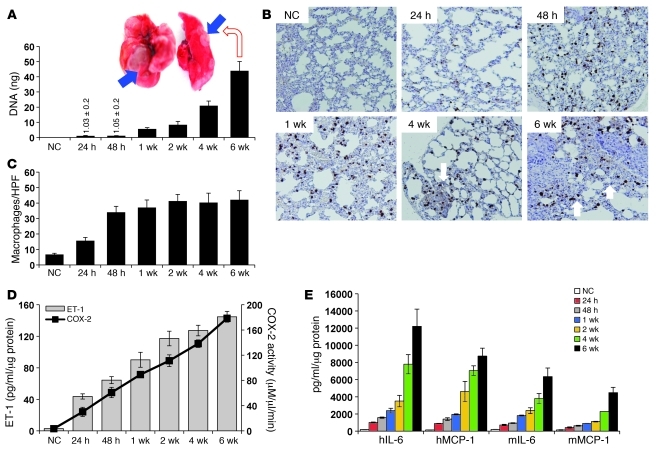
Data presented above suggest that ET-1 mediates tumor cell–macrophage communication, leading to a more aggressive cancer phenotype. In light of these observations and recent experiments associating macrophage infiltration with early lung micrometastases (39, 40), we evaluated whether this bladder tumor cell–macrophage interaction might operate to enhance development of metastases in the lungs through ET-1. We injected UMUC3 cells in the tail vein of nude mice and assayed the lungs for macrophage infiltration, ET-1, and proinflammatory mediators as a function of time. Tumor cell burden in the lungs was quantitatively evaluated by PCR using species-specific primers (41) and visual inspection at necropsy. While no difference in tumor cell burden in the lungs was noted between 24 and 48 hours after inoculation, a progressive increase was seen from 1 to 6 weeks (Figure 5A), culminating in visible metastases (mean of 6.8 ± 0.8 visible lesions/mouse with lesions in 12 of 12 mice) (Figure 5A, inset).
Figure 5. Tumor cells contribute to early macrophage infiltration and inflammation in the lung.
(A) Human 12p genomic DNA was detected by qRT-PCR DNA of 4 μg genomic DNA extracted from dissected lungs at the indicated time points after tail vein injection of 2 × 10⁶ UMUC3 cells/100 μl phenol red–free medium. Bars represent mean ± SEM of the amount of 12p DNA (ng) detected in lungs of 4 animals/group. Inset: Example of mouse lungs with visual metastases at 6 weeks after tail vein inoculation of UMUC3 cells. (B) Representative immunostaining (IHC) with macrophage marker mac2 antibody to assess number of macrophages infiltrating the lungs from normal lungs and lungs from animals injected with UMUC3, at the indicated times after injection. (C) Bars represent the mean ± SEM of the number of mac2-positive macrophages, shown in B, counted in 6 random HPFs (×200)/section, 5 animals/group. P < 0.05, Student’s t test, comparing the number of macrophages/HPF between normal control (NC) lungs and lungs 24 hours after injection and between 24 and 48 hours after injection of UMUC3 cells. (D) ET-1 and COX-2 activity in murine lungs in serial cohorts as in A. (E) Human IL-6, human MCP-1 (hIL-6, hMCP-1), murine IL-6, and murine MCP-1 levels (mIL-6, mMCP-1) were determined in lungs at the indicated time points. Bars represent mean ± SEM of tissue lysates from 5 animals/group performed in triplicate. P < 0.05, 1-way ANOVA for D and E.
Importantly, in lung fields uninvolved with cancer, we observed an increase in macrophage infiltration in lungs as early as 24 hours after injection, and by 48 hours, this reached a plateau comparable to levels at 6 weeks, when visible metastases were seen (Figure 5, B and C). Lung lysates assayed for total (human and murine) ET-1 levels and COX-2 activity indicated a progressive increase through 6 weeks (Figure 5D). Interestingly, both human tumor cells and murine infiltrating macrophages contributed to MCP-1 production (Figure 5E). Taken together with in vitro data (Figure 4), the kinetics of tumor cell growth, macrophage infiltration, and MCP-1 and IL-6 levels support a model whereby circulating tumor cells in the lungs trigger an initial macrophage influx to the lungs, followed by further manifestation of the macrophage inflammatory phenotype in proportion to the increase in tumor load in the lungs.
Tumor ET-1 contributes to early macrophage infiltration and cytokine production in the lung.
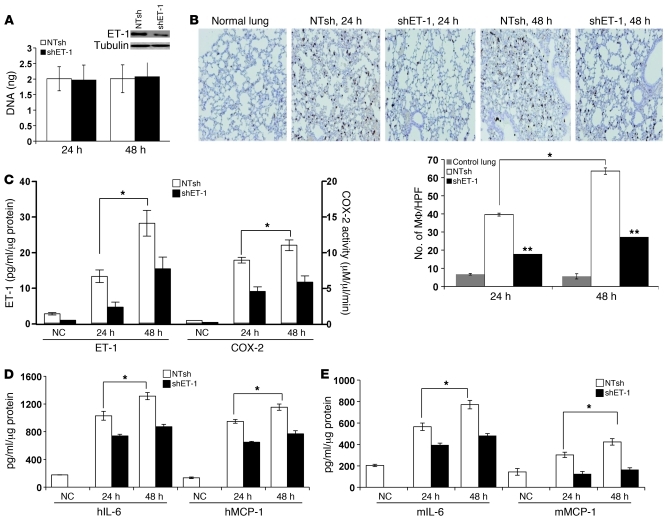
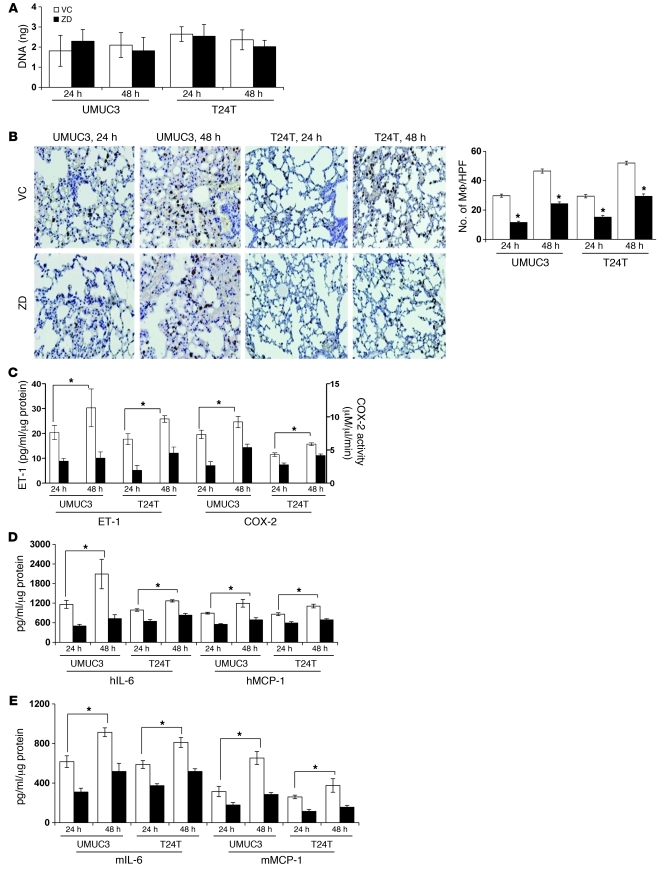
The data presented above led us to evaluate the role of tumor cell ET-1 secretion in driving early (24–48 hours) macrophage infiltration and inflammatory cytokine production in the lung. We stably depleted ET-1 expression in UMUC3 cells by shRNA targeting (Figure 6A). After tail vein injection of control or ET-1–depleted cells in nude mice, we found that ET-1 depletion had no effect on the quantity of tumor cells in the lungs at 24 and 48 hours as determined by 12p PCR (Figure 6A). In contrast, this was associated with a significant decrease in macrophage infiltration of the lungs (Figure 6B), ET-1 levels, COX-2 activity (Figure 6C), as well as human and murine MCP-1 and IL-6 (Figure 6, D and E). To investigate the role of ETAR in the observed early cytokine response triggered by tumor cells in the lungs, we pretreated nude mice with ETAR inhibitor (ZD4054) before tail vein injection of UMUC3 or T24T cells. Interestingly, ZD4054 pretreatment had no effect on either UMUC3 or T24T numbers in the lung (Figure 7A), while we observed a significant decrease in macrophage infiltration of the lungs (Figure 7B), together with a significant decrease in ET-1 levels, COX-2 activity (Figure 7C), as well as human (Figure 7D) and murine (Figure 7E) MCP-1 and IL-6, at 24 and 48 hours.
Figure 6. Tumor endothelin contributes to early macrophage infiltration and inflammation in the lung.
(A) ET-1 depletion in UMUC3 cells transduced with shET-1 and NTsh lentiviruses was determined by Western blotting. The burden of UMUC3 cells in the lungs at the indicated times was determined by 12p PCR. Bars represent mean ± SEM of amount of 12p DNA (ng) detected in lungs of 4 animals/group. (B) The number of macrophages infiltrating the lungs (×100 magnification) after tail vein injection of shET-1 and NTsh cells, at the indicated times. Bars represent the mean ± SEM of the number of macrophages (MF), counted as described above. ET-1 and COX-2 activity (C), hIL-6 and hMCP-1 (D), and mIL-6 and mMCP-1 (E) were determined in lungs at the indicated time points. Bars represent mean ± SEM of tissue lysates from 5 animals/group performed in triplicate. *P < 0.05, Student’s t test, comparing UMUC3-NTsh lungs at 24 hours with those at 48 hours; **P < 0.01, Student’s t test, comparing UMUC3-shET-1–injected lungs with UMUC3-NTsh counterparts at the same time point. NC, normal control.
Figure 7. ETAR mediates early macrophage infiltration and inflammation in the lung.
Nude mice were treated by oral gavage with ETAR inhibitor ZD4054 (10 mg/kg/d) or vehicle control (VC) 24 hours before tail vein injection of UMUC3 and T24 cells. (A) Tumor cell burden in the lungs of mice dissected 24 and 48 hours after tail vein injection was determined as described above. (B) Photomicrographs of macrophage infiltration of the lungs at the indicated time points (total magnification, ×100). Bars represent the mean ± SEM of the number of macrophages. *P < 0.05, comparing macrophage infiltration in lungs of VC-treated mice injected with either UMUC3 or T24T cells at 48 versus 24 hours. (C–E) ET-1 levels, COX-2 activity, hIL-6, hMCP-1, mIL-6, and mMCP-1 were determined in lungs at the indicated time points. For all assays and time points, ZD4054-treated mice showed significant inhibition (P < 0.05, Student’s t test) compared with VC-treated counterparts (5 animals/group, performed in triplicate).
ETAR blockade has minimal effect on primary tumor growth yet inhibits development of spontaneous lung metastasis.
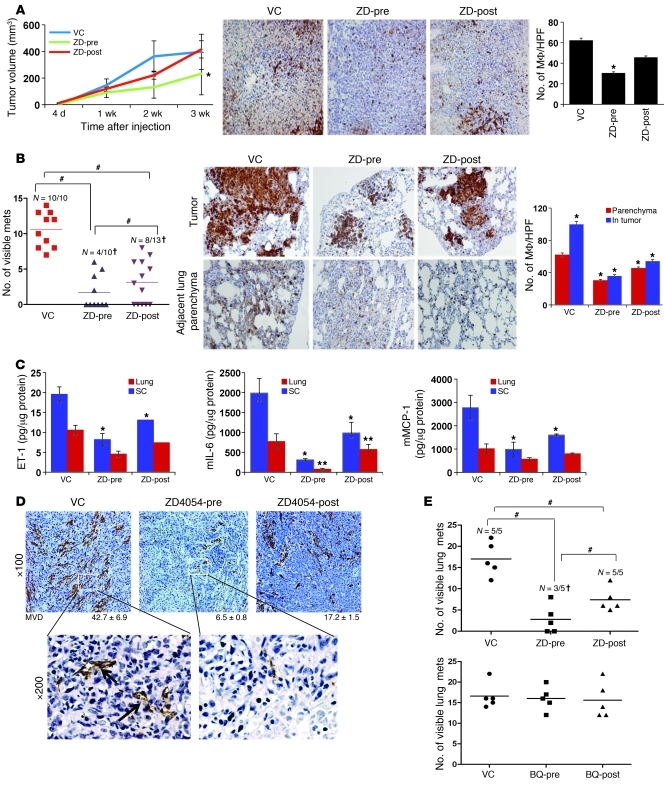
Data above suggest that tumor ET-1 triggers macrophage infiltration and inflammatory cytokine production in the lung before development of metastases and this effect is mediated by ETAR. This leads us to hypothesize that ETAR-mediated macrophage infiltration is a necessary step for metastatic colonization. Here we provide support for this hypothesis while extending the experimental models to spontaneous metastasis in immunocompetent mice. We inoculated the syngeneic MB49 murine bladder cancer cell line (42) subcutaneously into C57BL/6 mice and observed lung metastases in 3–4 weeks, consistent with prior findings (43). Interestingly, ETAR blockade by ZD4054 reduced subcutaneous MB49 tumor growth when this blockade was administered before inoculation, while it had less effect when initiated after inoculation. The magnitude of this effect appeared inversely proportional to the degree of macrophage infiltration of the tumor (Figure 8A). In contrast, ZD4054 dramatically reduced the development of lung metastases (Figure 8B), and this was associated with a significant decrease in tumor macrophages (Figure 8B). ZD4054 administration decreased levels of ET-1, IL-6, and MCP-1 as well as COX-2 activity in both subcutaneous tumors and in lungs, (Figure 8C), but this was less evident in the former compared with the latter. Interestingly, ETBR blockade had no effect on MB49 lung metastasis or tumor macrophages in these distant tumors (Supplemental Figure 4, A and B). In vitro, neither ETAR nor ETBR blockade had any effect on MB49 growth (Supplemental Figure 4C), suggesting that the ET axis is operating on host cells via paracrine interactions. Furthermore, we noted that ET-1, IL-6, and MCP-1 levels as well as COX-2 activity in the lung were elevated within a week after subcutaneous inoculation of MB49 tumors (primary tumor size was 52.5 ± 16.8 mm3), suggesting the possible initiation of a lung metastatic niche (Supplemental Figure 4D).
Figure 8. The effect of ZD4054 on primary tumor development and spontaneous lung metastasis in syngeneic immunocompetent C57BL/6 mice inoculated with MB49 murine bladder cancer cells.
(A–C) MB49 cells (5 × 10⁴ cells/100 μl) were injected s.c. in mice. Animals were assigned to 3 groups that received ZD4054 24 hours before MB49 injection (ZD-pre); vehicle control (VC); or ZD4054 1 week after tumor cell injection (ZD-post). (A) Kinetics of s.c. growth in 3 cohorts Typical example of macrophage immunostaining (total magnification, ×100) and quantification in s.c. tumors. Bars represent the mean ± SEM of macrophages/HPF as described above; *P < 0.05, Student’s t test, compared with VC-treated mice. (B) Incidence and number of visible metastases (mets) per lung in each cohort (left) following s.c. inoculation. †P < 0.0001, χ2 test; #P < 0.01, Student’s t test. Photomicrographs show infiltrating macrophages in lungs. Bars in the right panel represent mean ± SEM of the number macrophages within metastatic foci and in the surrounding lung parenchyma/HPF. *P < 0.05, as compared with VC-treated mice. (C) ET-1, MCP-1, and IL-6 detected in lungs and s.c. tumors. Bars represent mean ± SEM (n = 5/group). *P < 0.05, Student’s t test, compared with VC-treated mice. (D) Representative images of CD31 immunostaining of s.c. MB49 tumors showing MVD. Bars represent MVD ± SEM counted in 6 HPFs/sample. (E) Mice injected with MB49 cells (104 cells/100 μl) via tail vein were treated with ETR inhibitors (ZD4054, top, and BQ788, bottom) and were assigned to 3 cohorts for each inhibitor as described above. Scatter plot of incidence/number of visible lung metastases determined 3 weeks after injection. †P < 0.01, χ2 test; #P < 0.05, Student’s t test.
To begin elucidating at what step in the metastatic cascade ET-1/ETAR play a role, we stained the vasculature of MB49 subcutaneous tumors with endothelial marker CD31 and found that the mean vascular density (MVD) of tumors collected from vehicle-treated mice was significantly higher than that of mice treated with ZD4054 after tumor cell injection, and the levels in turn were significantly higher than those of mice treated before tumor cell injection (Figure 8D). Furthermore, inoculation of MB49 via tail vein either prior to or immediately following treatment with ZD4054 (but not BQ788) resulted in a dramatic decrease in metastasis (Figure 8E) similar to that observed in the spontaneous metastasis setting (Figure 8B).
Tumor ET-1 and macrophage infiltration play a role in metastatic colonization.
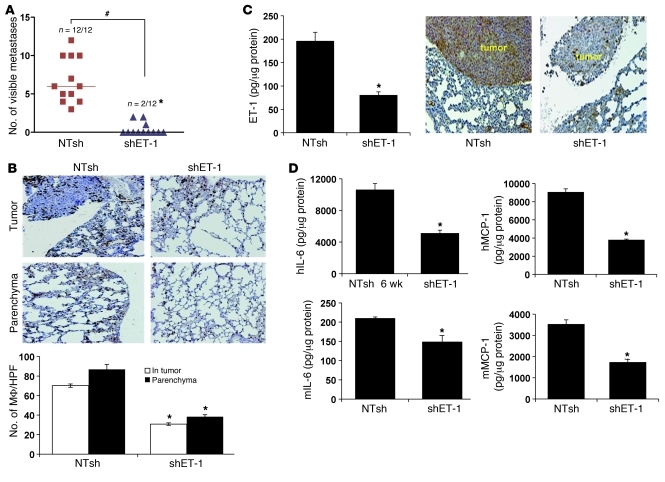
Data from the MB49 model indicated the requirement for ETAR activity in the establishment of lung metastasis but do not address the specific role of tumor ET-1 in this process. To determine this, we examined murine lungs 6 weeks after tail vein inoculation of UMUC3 cells with expression of ET-1 depleted by shRNA. Abrogation of ET-1 production in tumor cells significantly decreased the number of visible lung metastases in animals with lesions, as well as the proportion of mice developing metastasis (Figure 9A). This reduction was associated with a decreased number of infiltrating macrophages both within the metastatic foci and in the surrounding lung parenchyma (Figure 9B). These were associated with a decrease in the level of ET-1 (Figure 9C), as well as tumor- and murine-derived IL-6 and MCP-1 (Figure 9D). Depletion of tumor ET-1 also led to a decrease in ECE-1 and ETAR but not ETBR protein expression in whole lung lysates with metastases (Supplemental Figure 5A). To determine whether ET-1 expression alone was sufficient to induce experimental metastasis, we transfected and stably expressed ET-1 in nonmetastatic T24 human bladder cells, a lineage-related derivative of T24T, a metastatic and ET-1–expressing line (32). The results revealed that ET-1 expression alone was not sufficient to induce lung metastasis in this model (Supplemental Figure 5B).
Figure 9. Role of tumor ET-1 in UMUC3 experimental lung metastases.
Female nude mice were injected via tail vein with UMUC3-shET-1 or control UMUC3-NTsh. Six weeks after injection, mice were euthanized, and lungs were dissected and examined for the development of visible metastases. (A) Number of animals developing lung metastases (*P < 0.0001, χ2 test) as well as the number of visible metastases per lung in each cohort (#P < 0.01, Student’s t test). (B) The number of macrophages infiltrating metastatic tumor foci in lungs (tumor) and in the surrounding lung tissue (parenchyma) are shown (×100 magnification). Bars represent mean ± SEM of the number of macrophages/HPF. *P < 0.002, χ2 test. (C) ET-1 levels determined in lung lysates 6 weeks after UMUC3-shET-1 and NTsh injection as earlier described. Specimens were also examined by ET-1 immunohistochemistry as described in Methods (total magnification, ×100). Representative samples are shown. (D) Human and murine IL-6 and MCP-1 were determined in lung lysates 6 weeks after UMUC3-shET-1 and NTsh injection as earlier described. Bars represent mean ± SEM of tissue lysates from 5 animals/group from experiments performed in triplicate.*P < 0.05, Student’s t test.
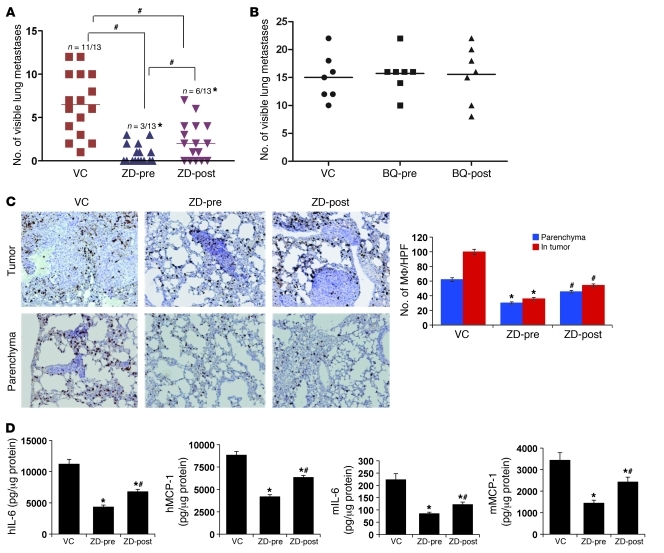
We next investigated the effect of ETAR blockade using ZD4054 in metastatic colonization. Administration of drug prior to tail vein injection of UMUC3 cells (ZD-pre) was associated with a more profound decrease in the number of visible lung metastases (P < 0.01) and the number of animals with metastasis (P < 0.002) compared with those that received ZD4054 1 week following inoculation (ZD-post) (Figure 10A). In contrast, no effect was seen with BQ788 (Figure 10B), findings similar to that in MB49 cells (Figure 8E). The number of macrophages in the tumor and in the surrounding parenchyma was decreased in both drug-treated cohorts compared with control (Figure 10C). Administration of ZD4054 was also associated with decreased levels tumor- and host-derived inflammatory cytokines (Figure 10D). Importantly, growth of UMUC3 after subcutaneous inoculation was not affected by either depletion of ET-1 in tumor cells or the pharmacologic inhibition of ETAR or ETBR (Supplemental Figure 6). Taken together with the MB49 data, these results strongly implicate tumor ET-1, through its effect on ETAR, in triggering of a macrophage response that is necessary for metastatic colonization.
Figure 10. ETAR mediates lung metastasis and inflammation.
Female nude mice were injected via tail vein with UMUC3. One cohort of the mice (ZD-pre) received ZD4054 (10 mg/kg/d) 24 hours prior to inoculation, while another received it 1 week after (ZD-post) tail vein injection. Vehicle control (VC) was given to the third cohort before inoculation. (A) The number of animals developing lung metastases 6 weeks after tail vein injection, as well as the number of visible metastases per lung in each cohort. *P < 0.002, χ2 test; #P < 0.01, Student’s t test. (B) Scatter plot of the incidence and number of visible lung metastases counted 6 weeks after tail vein injection of UMUC3 cells (1 × 10⁶ cells/100 μl) in nude mice with and without treatment with the ETBR blocker BQ788 before (BQ-pre) or after (BQ-post) UMUC3 injection (500 μM/500 μl PBS/mouse/d). (C) Immunostaining of macrophages infiltrating (×100 magnification) metastatic tumor foci in lungs (tumor) and in the surrounding lung tissue (parenchyma). Bars represent mean ± SEM of the number of macrophages/HPF. *P < 0.05, Student’s t test, as compared with VC-treated mice; #P < 0.05, Student’s t test, comparing lungs from ZD-pretreated animals with their ZD-post-treated counterparts. (D) Human and murine IL-6 and MCP-1 were determined in lung lysates 6 weeks after UMUC3 injection in the 3 cohorts described in A. *P < 0.05, Student’s t test, as compared with VC-treated mice; #P < 0.05, comparing lungs from ZD-post-treated with their ZD-pretreated counterparts.
Transient macrophage depletion reduces bladder cancer lung metastasis.
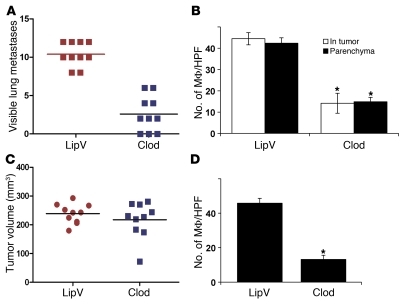
To determine the direct contribution of macrophages in ET-1–induced lung metastasis, we used the well-established clodronate macrophage ablation method (40) before injecting tumor cells. We found that mice that received clodronate liposomes exhibited a significant decrease in the incidence, number, and size of visible lung metastases 6 weeks after tail vein injection of UMUC3 cells (Figure 11A) concomitant with a significant decrease in macrophages (Figure 11B) in the lungs. In contrast, clodronate injection did not affect UMUC3 growth in vivo after subcutaneous implantation (Figure 11C), despite the significant decrease in tumor macrophages (Figure 11D). Interestingly, there was a significant decrease in tumor- and host-derived IL-6 and MCP-1 in lungs but not in subcutaneous tumor lysates (data not shown). These findings suggest that macrophage infiltration is necessary for metastasis but not subcutaneous tumor growth and, together with prior findings, that it is mediated by tumor ET-1 via ETAR.
Figure 11. Transient macrophage depletion blocks lung metastasis without affecting primary growth.
(A) Scatter plot of the incidence and number of lung metastases that developed after tail vein injection of UMUC3 cells in nude mice treated with liposome-encapsulated clodronate (Clod) or empty liposome vehicle (LipV). P < 0.01, Student’s t test. (B) Quantification of mac2 immunostaining of lung tissues showed a significant decrease in macrophage infiltration of lung metastatic foci (In-tumor) and surrounding lung tissues (parenchyma). (C) Scatter plot of the incidence and volume of s.c. tumors grown after injection of UMUC3 cells into nude mice treated with liposome Clod or LipV. (D) Quantification of mac2 immunostaining of s.c. tumors. *P < 0.01, Student’s t test.
Discussion
Gene expression data from human bladder cancer have revealed that ET1 and ETAR were overexpressed in muscle invasive disease and that the degree of expression is associated with reduced patient survival. This was confirmed at the protein level by ET-1 immunohistochemistry. However, an apparent paradox that has arisen in the field regarding the role of ETAR in cancer is the finding that pharmacologic blockade of this receptor does not appear to affect primary tumor growth (4) yet affects experimental metastasis (3) and that clinical trials with ETAR inhibitors in patients with advanced cancers appear to have minimal effect. This prompted us to evaluate the roles of these molecules in bladder cancer metastasis with the hypothesis that ET-1 and ETAR play a role in the early steps of tumor progression and metastasis. The findings presented here provide a possible biological explanation for this paradox, and this has important implications for clinical trial design with ET axis inhibitors.
The known proinflammatory properties of ET-1 and ETAR contributing to the progression of pulmonary, renal vascular diseases, atherosclerosis, diabetes, and autoimmune vasculopathies (26) led us to hypothesize, then demonstrate, that tumor ET-1 could trigger inflammation in the lung soon after the cancer cell lodged at this site and thus set up a vicious cycle wherein inflammatory cells would enhance and facilitate the process of metastatic colonization. In benign disease ET-1 has been shown to activate the proinflammatory transcriptional factors in human monocytes and to stimulate the production of inflammatory cytokines (26). We demonstrated the existence of this mechanism in both human and murine isogenic model systems as well as in spontaneous and experimental metastasis settings. Targeting ET1 gene or its pharmacologic inhibition reduced MCP-1/CCL2, IL-6, and COX-2 in the lung microenvironment, thus reducing metastatic colonization.
Pharmacologic inhibition of ETAR in the spontaneous metastasis model revealed that the ET-1/ERAR axis collectively alters vascular density, breaching the vascular integrity and possibly enhancing intravasation of tumor cell shed from their primary sites. This is supported by significant upregulation of ET-1 axis genes along with inflammatory mediators and MMPs in advanced-stage primary human tumor tissues. Interestingly, the IL-6, MCP-1, COX-2, and MMPs induced by ET-1 are also known to breach the lung vasculature and enable extravasation of cancer cells on dissemination of these cells to the lungs (44–48). These data support the concept of an in vivo cancer-macrophage cell crosstalk that induces an inflammatory environment that stimulates macrophages and possibly other immune cells to create a favorable microenvironment within a given organ that fosters metastasis (33, 36, 37, 40, 47–53). Hence, while these data suggest that the major role of ET-1 is in early establishment of metastasis, our data also suggest a role of this axis at the primary site.
An advantage of our use of human tumor cells in murine hosts to model the colonization stage of metastasis is that it allows detection and quantitative analysis of tumor and host secretomes separately. Our study revealed that circulating tumor cells trigger a robust inflammatory response in the lungs mediated by the ET-1/ETAR axis and this facilitates metastatic colonization. We also show that the cellular effectors of this axis are likely macrophages, by virtue of the observation that metastasis in these models can be suppressed by liposomal clodronate preparations. By demonstrating that it operates in the syngeneic MB49 cell line, a spontaneously metastatic model, we confirm that this finding is related neither to xenograft histoincompatibility nor to bolus delivery of cancer cells in the experimental metastasis assay. We speculate that the magnitude of this early inflammatory response may determine the rapidity of subsequent development of microscopic and macroscopic metastases in the lung and thus might be a factor regulating tumor dormancy (54). This response is likely triggered by tumor secretion of ET-1 and the proinflammatory cytokines IL-6 and MCP-1 much before the establishment of lung colonies. Interestingly, pharmacologic inhibition of ETAR by ZD4054 prior to injection of tumor cells reduced the early inflammatory response and subsequent development of lung metastases. In contrast, when the early inflammatory response was allowed to develop upon injection of tumor cells, and only later followed by administration of ZD4054, the reduction in lung inflammation and clinical lung metastases was not as dramatic. We speculate that this underpins the observation that pharmacologic inhibition of ETAR does not affect primary tumor growth or established high-volume metastatic disease because these advanced tumors are no longer dependent on macrophages or their inflammatory response for their maintenance and growth.
Together, our findings support the ET-1 axis as a target for innovative therapeutic strategies and have important implications for preclinical and clinical drug development. Our findings suggest that clinical trials with endothelin axis inhibitors should be designed to evaluate efficacy in the adjuvant setting rather than for the treatment of advanced metastatic disease or established primary tumors. The data also emphasize the need for preclinical evaluation of new drugs in the adjuvant setting using models of metastatic colonization (55). Not using the latter may lead to loss of highly effective agents from the drug development pipeline.
Methods
Cell culture, reagents, and ELISA.
All cell culture reagents were from Invitrogen. UMUC3, T24, T24T (EJ), U937, 293T, and MB49 cells were obtained from and maintained as recommended by ATCC. Primary human microvascular endothelial cells (PMVECs) were purchased and maintained as recommended by Lonza Inc. ET-1, BQ123, and BQ788 were purchased from Peninsula Laboratories. ETAR antagonists ABT-627 (IC50 for ETAR and ETBR: 0.055 and 84.4 nM, respectively), A-192621 (IC50 for ETAR and ETBR: 4,280 and 4.54 nM, respectively), and A-182086 (IC50 for ETAR and ETBR: 0.08 and 0.29 nM, respectively) were provided by Abbott Laboratories. ZD4054 (IC50 for ETAR: 21 nM, with no binding to ETBR) was provided by AstraZeneca. ET-1, IL-6, MCP-1, and COX-2 activity was determined using appropriate species-specific commercial kits from R&D Systems, Cayman Chemical Inc., and RayBiotech Inc., as per the manufacturer’s recommendations. CyQuant assay (Invitrogen) was used to determine cell proliferation and DNA content as per the manufacturer’s instructions.
Plasmid transfections.
UMUC3 and U937 cells were transfected with 100 nmol/l siRNA duplexes against ET1, ECE1, ETBR, ETAR mRNA (OnTarget Plus-SMART pool) or scrambled mock siRNA obtained commercially (Dharmacon Inc.). siRNA transfection using FuGENE 6 reagent (Roche) was done according to the manufacturer’s protocol. pcDNA vector and ET-1 cDNA–expressing T24 cells were generated by electroporation transfection and after stable selection in G418 were used in metastasis experiments.
shRNA, lentiviruses, and transduction.
Stable knockdown of ET-1 was done using shRNAs ET-1 5′-ACCGGGCAGTTAGTGAGAGGAAGAAACTCGAGTTTCTTCCTCTCACTAACTGCTTTTT-3′ or non-target shRNA (NTsh) control vector, cloned in pLKO.1-puro (Mission-TRC, Sigma-Aldrich) following the manufacturer’s protocol. shRNA plasmids were packaged in 293T cells by cotransfection with compatible packaging plasmids (Addgene). Culture supernatants containing the viral particles were collected 48 hours after transfection and filtered through 0.45-μm filters (Fisher Scientific). UMUC3 cells were transduced with lentivirus-containing supernatant in the presence of 8 μg/ml Polybrene (Sigma-Aldrich) for 24 hours. Virus-containing medium was replaced with selection medium containing 1 μg/ml puromycin (Sigma-Aldrich) for 2 weeks. Cells with the most efficient knockdown were used in subsequent experiments.
Antibodies and Western blotting.
Cells were harvested in lysis buffer (20 mM Tris, pH 7.4, 150 mM NaCl, 1 mM EDTA, 50 mM NaF, 0.5% sodium deoxycholate, 1% NP-40, 1 mM Na3VO4, and 1× protease inhibitor cocktail mixture). Lysates were cleared by centrifugation at 12,000 g for 20 minutes at 4°C, and protein concentrations were determined by BCA assay (Pierce). Cell lysates were resolved by 4%–20% SDS-PAGE and transferred onto PVDF membranes (Bio-Rad). Monoclonal and polyclonal antibodies against ET-1, ECE-1, ETAR, ETBR, and α-tubulin were from Santa Cruz Biotechnology Inc. Protein detection was carried out using HRP-conjugated secondary antibodies and SuperSignalFemto Maximum Sensitivity Substrate (Pierce).
Gelatin zymography, invasion, and transendothelial migration assays.
Cell culture supernatants were electrophoresed for analysis in 9% SDS-PAGE gels containing 1 mg/ml gelatin as earlier described (56). Chemoinvasion assay was carried out with 24-well 3- and 8-μm-pore-size polycarbonate Nucleopore filters (Costar) as previously described (56, 57). Filters were stained with Diff-Quick (Fisher Scientific), and cells were counted in 6 high-power fields (HPFs). For transendothelial migration, primary human PMVECs were grown to confluence on 8-μm pore filters and incubated with cancer cells as described (58).
In vivo experiments.
Female athymic (nu+/nu+) mice, 4–6 weeks of age (NCI), were treated after approval of our experimental protocols by the Animal Care and Use Committee of the University of Virginia. Mice received injections via lateral tail vein as earlier described (3). Mice were euthanized at 24, 48, and 6 weeks after injection, lungs were harvested, and the number of visible surface metastases was determined. Tissues were either processed for immunohistochemical or snap-frozen for molecular analyses. For therapeutic experiments, mice were randomized into groups that received ZD4054 (10 mg/kg/d) or its vehicle control (polyethylene glycol) by oral gavage, or intraperitoneal injection of BQ788 (500 μM/500 μl PBS/mouse) or its vehicle control (methanol in PBS) 24 hours before tail vein injection. In some studies, mice received treatment 1 week after tail vein injection. For evaluation of circulating tumor cell burden in the lungs at early time points, genomic DNA was extracted from lungs, and human 12q chromosome was amplified using highly quantitative and sensitive DNA qPCR assay described previously by our laboratory (41). For syngeneic spontaneous metastasis experiments, C57BL/6 mice were obtained from The Jackson Laboratory. Mice were injected subcutaneously in one flank with 5 × 104 MB49 cells/100 μl phenol red–free RPMI1640. For therapeutic experiments, C57BL/6 mice were randomized into groups that received ZD4054 and BQ788 and their vehicle controls at the aforementioned concentrations 24 hours before or 1 week after MB49 injection. Clodronate encapsulated in liposome nanoparticles (5 mg/ml) was purchased from Encapsula Nanosciences Inc. Twenty-four hours before tumor cell injection, mice were anesthetized by inhalation of isoflurane, followed by an initial intratracheal and intraperitoneal injection of 20 μl clodronate liposomes or empty liposomes (vehicle control) (40). Animals were assigned into random cohorts subjected to tail vein or subcutaneous injection of UMUC3 cells. All groups received weekly intraperitoneal injections of 100 μl clodronate liposomes or empty liposomes for 5 weeks.
Tissue microarrays and immunohistochemistry.
A bladder cancer tissue microarray (TMA) was constructed at the CNIO as described (59, 60) including a total of 194 bladder tumors (92 NMI [stage T1G3] and 102 MI [stage ≥T2]) (2, 61). Protein expression patterns of ET-1 were assessed using standard avidin-biotin immunoperoxidase procedures and antigen retrieval methods (0.01% citric acid for 15 minutes under microwave treatment) prior to overnight incubation with mouse monoclonal primary antibodies against ET-1 (Zymed, Invitrogen). Sections were then scored as described (59, 60). Patient follow-up information allowed the evaluation of protein expression versus DSS. Mac-2, F4/80, and CD31 antibodies were purchased from BD Biosciences and AbD Serotec Protein. MVD was determined by counting the number of CD31-positive vessels in 10 random HPFs (×100).
Statistics.
For microarray analyses of the expression and prognostic significance of endothelin axis genes, 3 publicly available datasets were used. The first dataset, designated “Sanchez-Carbayo et al.,” encompassed a total of 157 Affymetrix HG-U133A arrays run on cystectomy samples of NMI bladder cancers, MI bladder cancers, and adjacent histologically normal urothelium (30). Normalized data were downloaded from the supplementary information for that article, and duplicate arrays for individual patients’ tumors were averaged to provide a total of 26 NMIs and 65 MIs for analysis. A second dataset, “UVA-Den,” that we have published previously (29) includes 36 NMIs and 24 MIs from combination of two published studies from the University of Virginia and the Molecular Diagnostics Laboratory of Aarhus University Hospital, Denmark (62), also from the HG-U133A platform. A third dataset, GSE13507 (31), from the Illumina HG 6 version 2 platform, was downloaded from NCBI GEO (63), and processed data were used for analysis. In cases of multiple probesets for a single gene of interest, Spearman correlation of probes was performed, and the probe with the highest median expression intensity among significantly correlated probes was used for analysis. Thus, Affymetrix probes used were 218995_s_at for EDN1/ET1, 201749_at for ECE1, 204464_s_at for EDNAR/ETAR, 206701_x_at for EDNBR/ETBR, 206758_at for EDN2/ET2, 217154_s_at for EDN3/ET3, 206728_at for ECE2. Illumina probes used were ILMN_1682775 for EDN1/ET1, ILMN_1796629 for EDNAR/ETAR, ILMN_1658044 for EDNBR/ETBR, ILMN_1672174 for ECE1, ILMN_1730925 for EDN2/ET2, ILMN_1703205 for EDN3/ET3, and ILMN_1762883 for ECE2. Dot plots of standardized (z-scored) logged (base 2) expression of probes comparing NMI and MI tumors were plotted in Prism 5.0 (GraphPad Software) and differences in distributions tested by the Mann-Whitney U test. For Kaplan-Meier analysis of the relationship between expression of the genes and DSS, log-rank tests of differences between DSSs by gene expression class (high or low expressors) were performed in Matlab (The MathWorks) and plotted in Prism 5.0, while cutoffs for high versus low expression of indicated genes that optimally stratified by survival were selected from the interquartile range of sorted expression values across the population of the Sanchez-Carbayo et al. and GSE13507 studies. For correlation analysis, the same probe for EDN1/ET1 was used, as well as 216598_s_at for CCL2 (MCP-1), 203936_s_at for MMP9, 201069_at for MMP2, 204748_at for PTGS2 (COX2), and 205207_at for IL6. Expression values from the Sanchez-Carbayo et al. and UVA-Den studies were logged (base 2) and z-scored for scatter plotting in Microsoft Excel on standardized axes, while correlation values were calculated by rank-based Spearman methodology in Matlab.
Bioinformatic analysis of TMAs.
The consensus value of the 3 or 4 representative cores from each tumor sample arrayed was used for statistical analyses. The association of the expression of ET-1 and COX2 with histopathologic stage and tumor grade was evaluated using the nonparametric Wilcoxon-Mann-Whitney and Kruskal-Wallis tests (59, 60). ET-1 and COX2 expression was evaluated as continuous variable based on the number of cells expressing the protein in the cytoplasm. The intensity of the staining was categorized from negative (–) to low (+), intermediate (++), and high (+++). The cutoffs of expression for prognostic evaluation were selected based on the median values of expression among the groups under analysis. The associations of these proteins with disease-specific overall survival, progression, and overall survival were also evaluated using the log-rank test in those cases for which follow-up information was available. Disease-specific overall survival time was defined as the months elapsed between transurethral resection or cystectomy and death from disease (DSS, or the last follow-up date). Survival curves were plotted using standard Kaplan-Meier methodology, and statistical analyses were performed using the SPSS statistical package (version 18.0). Unless otherwise specified, all other data were analyzed by 2-tailed Student’s t test, 1-way ANOVA, Fisher exact test, χ2 test, Pearson’s correlations, and Kaplan-Meier curves using Microsoft Excel 7.0 and GraphPad Prism 5.0. Differences were considered significant at P < 0.05.
Supplementary Material
Acknowledgments
This study was supported by NIH grant CA143971 to D. Theodorescu. The authors wish to thank Sharon Birdsall, Marya Dunlap-Brown, John Sanders, and Marie Acquafondata for technical help with experiments.
Footnotes
Conflict of interest: The University of Virginia MAPS Core facility received research support from AstraZeneca, makers of ZD4054 (zibotentan) used in this study.
Citation for this article: J Clin Invest. 2011;121(1):132–147. doi:10.1172/JCI42912.
References
- 1.Jemal A, Siegel R, Xu J, Ward E. Cancer statistics. CA Cancer J Clin. 2010;60(5):277–300. doi: 10.3322/caac.20073. [DOI] [PubMed] [Google Scholar]
- 2.Wu XR. Urothelial tumorigenesis: a tale of divergent pathways. Nat Rev Cancer. 2005;5(9):713–725. doi: 10.1038/nrc1697. [DOI] [PubMed] [Google Scholar]
- 3.Titus B, et al. Endothelin axis is a target of the lung metastasis suppressor gene RhoGDI2. Cancer Res. 2005;65(16):7320–7327. doi: 10.1158/0008-5472.CAN-05-1403. [DOI] [PubMed] [Google Scholar]
- 4.Herrmann E, et al. Endothelin-A-receptor antagonism with atrasentan exhibits limited activity on the KU-19-19 bladder cancer cell line in a mouse model. J Cancer Res Clin Oncol. 2009;135(10):1455–1462. doi: 10.1007/s00432-009-0593-5. [DOI] [PMC free article] [PubMed] [Google Scholar]
- 5.Itoh Y, et al. Cloning and sequence analysis of cDNA encoding the precursor of a human endothelium-derived vasoconstrictor peptide, endothelin: identity of human and porcine endothelin. FEBS Lett. 1988;231(2):440–444. doi: 10.1016/0014-5793(88)80867-6. [DOI] [PubMed] [Google Scholar]
- 6.Yanagisawa M, et al. Primary structure, synthesis, and biological activity of rat endothelin, an endothelium-derived vasoconstrictor peptide. Proc Natl Acad Sci U S A. 1988;85(18):6964–6967. doi: 10.1073/pnas.85.18.6964. [DOI] [PMC free article] [PubMed] [Google Scholar]
- 7.Yanagisawa M, et al. A novel potent vasoconstrictor peptide produced by vascular endothelial cells. Nature. 1988;332(6163):411–415. doi: 10.1038/332411a0. [DOI] [PubMed] [Google Scholar]
- 8.Kedzierski RM, Yanagisawa M. Endothelin system: the double-edged sword in health and disease. Annu Rev Pharmacol Toxicol. 2001;41:851–876. doi: 10.1146/annurev.pharmtox.41.1.851. [DOI] [PubMed] [Google Scholar]
- 9.Bagnato A, Spinella F, Rosano L. Emerging role of the endothelin axis in ovarian tumor progression. Endocr Relat Cancer. 2005;12(4):761–772. doi: 10.1677/erc.1.01077. [DOI] [PubMed] [Google Scholar]
- 10.Nelson J, Bagnato A, Battistini B, Nisen P. The endothelin axis: emerging role in cancer. Nat Rev Cancer. 2003;3(2):110–116. doi: 10.1038/nrc990. [DOI] [PubMed] [Google Scholar]
- 11.Rosano L, et al. Endothelin-1 induces tumor proteinase activation and invasiveness of ovarian carcinoma cells. Cancer Res. 2001;61(22):8340–8346. [PubMed] [Google Scholar]
- 12.Giaid A, et al. Detection of endothelin immunoreactivity and mRNA in pulmonary tumours. J Pathol. 1990;162(1):15–22. doi: 10.1002/path.1711620105. [DOI] [PubMed] [Google Scholar]
- 13.Kurihara M, Ochi A, Kawaguchi T, Niwa M, Kataoka Y, Mori K. Localization and characterization of endothelin receptors in human gliomas: a growth factor? Neurosurgery. 1990;27(2):275–281. doi: 10.1097/00006123-199008000-00017. [DOI] [PubMed] [Google Scholar]
- 14.Kusuhara M, et al. Production of endothelin in human cancer cell lines. Cancer Res. 1990;50(11):3257–3261. [PubMed] [Google Scholar]
- 15.Nakagawa K, Nishimura T, Shindo K, Kobayashi H, Hamada T, Yokokawa K. [Measurement of immunoreactive endothelin-1 in plasma of a patient with malignant hemangioendothelioma]. Nippon Hifuka Gakkai Zasshi. 1990;100(14):1453–1456. [PubMed] [Google Scholar]
- 16.Smith SC, Theodorescu D. Learning therapeutic lessons from metastasis suppressor proteins. Nat Rev Cancer. 2009;9(4):253–264. doi: 10.1038/nrc2594. [DOI] [PMC free article] [PubMed] [Google Scholar]
- 17.Grimshaw MJ. Endothelins in breast tumour cell invasion. Cancer Lett. 2005;222(2):129–138. doi: 10.1016/j.canlet.2004.08.029. [DOI] [PubMed] [Google Scholar]
- 18.Grimshaw MJ. Endothelins and hypoxia-inducible factor in cancer. Endocr Relat Cancer. 2007;14(2):233–244. doi: 10.1677/ERC-07-0057. [DOI] [PubMed] [Google Scholar]
- 19.Grimshaw MJ, Hagemann T, Ayhan A, Gillett CE, Binder C, Balkwill FR. A role for endothelin-2 and its receptors in breast tumor cell invasion. Cancer Res. 2004;64(7):2461–2468. doi: 10.1158/0008-5472.CAN-03-1069. [DOI] [PubMed] [Google Scholar]
- 20.Grimshaw MJ, Wilson JL, Balkwill FR. Endothelin-2 is a macrophage chemoattractant: implications for macrophage distribution in tumors. Eur J Immunol. 2002;32(9):2393–2400. doi: 10.1002/1521-4141(200209)32:9<2393::AID-IMMU2393>3.0.CO;2-4. [DOI] [PubMed] [Google Scholar]
- 21.Spinella F, et al. Antitumor effect of green tea polyphenol epigallocatechin-3-gallate in ovarian carcinoma cells: evidence for the endothelin-1 as a potential target. Exp Biol Med (Maywood). 2006;231(6):1123–1127. [PubMed] [Google Scholar]
- 22.Spinella F, et al. Endothelin-1 and Endothelin-3 Promote Invasive Behavior via Hypoxia-Inducible Factor-1{alpha} in Human Melanoma Cells. Cancer Res. 2007;67(4):1725–1734. doi: 10.1158/0008-5472.CAN-06-2606. [DOI] [PubMed] [Google Scholar]
- 23.Spinella F, Rosano L, Di Castro, V, Natali PG, Bagnato A. Endothelin-1-induced prostaglandin E2-EP2, EP4 signaling regulates vascular endothelial growth factor production and ovarian carcinoma cell invasion. J Biol Chem. 2004;279(45):46700–46705. doi: 10.1074/jbc.M408584200. [DOI] [PubMed] [Google Scholar]
- 24.Spinella F, Rosano L, Di Castro, V, Nicotra MR, Natali PG, Bagnato A. Inhibition of cyclooxygenase-1 and -2 expression by targeting the endothelin a receptor in human ovarian carcinoma cells. Clin Cancer Res. 2004;10(14):4670–4679. doi: 10.1158/1078-0432.CCR-04-0315. [DOI] [PubMed] [Google Scholar]
- 25.Buckanovich RJ, et al. Endothelin B receptor mediates the endothelial barrier to T cell homing to tumors and disables immune therapy. Nat Med. 2008;14(1):28–36. doi: 10.1038/nm1699. [DOI] [PubMed] [Google Scholar]
- 26.Kandalaft LE, Facciabene A, Buckanovich RJ, Coukos G. Endothelin B receptor, a new target in cancer immune therapy. Clin Cancer Res. 2009;15(14):4521–4528. doi: 10.1158/1078-0432.CCR-08-0543. [DOI] [PMC free article] [PubMed] [Google Scholar]
- 27.Browatzki M, Pfeiffer CA, Schmidt J, Kranzhofer R. Endothelin-1 induces functionally active CD40 protein via nuclear factor-kappaB in human vascular smooth muscle cells. Eur J Med Res. 2007;12(3):129–133. [PubMed] [Google Scholar]
- 28.Sutcliffe AM, Clarke DL, Bradbury DA, Corbett LM, Patel JA, Knox AJ. Transcriptional regulation of monocyte chemotactic protein-1 release by endothelin-1 in human airway smooth muscle cells involves NF-kappaB and AP-1. Br J Pharmacol. 2009;157(3):436–450. doi: 10.1111/j.1476-5381.2009.00143.x. [DOI] [PMC free article] [PubMed] [Google Scholar]
- 29.Smith SC, et al. Profiling bladder cancer organ site-specific metastasis identifies LAMC2 as a novel biomarker of hematogenous dissemination. Am J Pathol. 2009;174(2):371–379. doi: 10.2353/ajpath.2009.080538. [DOI] [PMC free article] [PubMed] [Google Scholar]
- 30.Sanchez-Carbayo M, Socci ND, Lozano J, Saint F, Cordon-Cardo C. Defining molecular profiles of poor outcome in patients with invasive bladder cancer using oligonucleotide microarrays. J Clin Oncol. 2006;24(5):778–789. doi: 10.1200/JCO.2005.03.2375. [DOI] [PubMed] [Google Scholar]
- 31.Kim WJ, et al. Predictive value of progression-related gene classifier in primary non-muscle invasive bladder cancer. Mol Cancer. 2010;9:3. doi: 10.1186/1476-4598-9-3. [DOI] [PMC free article] [PubMed] [Google Scholar]
- 32.Gildea JJ, Golden WL, Harding MA, Theodorescu D. Genetic and phenotypic changes associated with the acquisition of tumorigenicity in human bladder cancer. Genes Chromosomes Cancer. 2000;27(3):252–263. doi: 10.1002/(SICI)1098-2264(200003)27:3<252::AID-GCC5>3.0.CO;2-9. [DOI] [PubMed] [Google Scholar]
- 33.Hagemann T, et al. Macrophages induce invasiveness of epithelial cancer cells via NF-kappa B and JNK. J Immunol. 2005;175(2):1197–1205. doi: 10.4049/jimmunol.175.2.1197. [DOI] [PubMed] [Google Scholar]
- 34.Rosano L, et al. Combined targeting of endothelin a receptor and epidermal growth factor receptor in ovarian cancer shows enhanced antitumor activity. Cancer Res. 2007;67(13):6351–6359. doi: 10.1158/0008-5472.CAN-07-0883. [DOI] [PubMed] [Google Scholar]
- 35.Naugler WE, Karin M. NF-kappaB and cancer-identifying targets and mechanisms. Curr Opin Genet Dev. 2008;18(1):19–26. doi: 10.1016/j.gde.2008.01.020. [DOI] [PMC free article] [PubMed] [Google Scholar]
- 36.Nardin A, Abastado JP. Macrophages and cancer. Front Biosci. 2008;13:3494–3505. doi: 10.2741/2944. [DOI] [PubMed] [Google Scholar]
- 37.Solinas G, Germano G, Mantovani A, Allavena P. Tumor-associated macrophages (TAM) as major players of the cancer-related inflammation. J Leukoc Biol. 2009;86(5):1065–1073. doi: 10.1189/jlb.0609385. [DOI] [PubMed] [Google Scholar]
- 38.Koren HS, Anderson SJ, Larrick JW. In vitro activation of a human macrophage-like cell line. Nature. 1979;279(5711):328–331. doi: 10.1038/279328a0. [DOI] [PubMed] [Google Scholar]
- 39.Bugelski PJ, Kirsh RL, Sowinski JM, Poste G. Changes in the macrophage content of lung metastases at different stages in tumor growth. Am J Pathol. 1985;118(3):419–424. [PMC free article] [PubMed] [Google Scholar]
- 40.Qian B, et al. A distinct macrophage population mediates metastatic breast cancer cell extravasation, establishment and growth. PLoS One. 2009;4(8):e6562. doi: 10.1371/journal.pone.0006562. [DOI] [PMC free article] [PubMed] [Google Scholar]
- 41.Nicholson BE, et al. Profiling the evolution of human metastatic bladder cancer. Cancer Res. 2004;64(21):7813–7821. doi: 10.1158/0008-5472.CAN-04-0826. [DOI] [PubMed] [Google Scholar]
- 42.Summerhayes IC, Franks LM. Effects of donor age on neoplastic transformation of adult mouse bladder epithelium in vitro. J Natl Cancer Inst. 1979;62(4):1017–1023. [PubMed] [Google Scholar]
- 43.Loskog A, Ninalga C, Hedlund T, Alimohammadi M, Malmstrom PU, Totterman TH. Optimization of the MB49 mouse bladder cancer model for adenoviral gene therapy. Lab Anim. 2005;39(4):384–393. doi: 10.1258/002367705774286475. [DOI] [PubMed] [Google Scholar]
- 44.Gupta GP, Massague J. Cancer metastasis: building a framework. Cell. 2006;127(4):679–695. doi: 10.1016/j.cell.2006.11.001. [DOI] [PubMed] [Google Scholar]
- 45.Gupta GP, et al. Mediators of vascular remodelling co-opted for sequential steps in lung metastasis. Nature. 2007;446(7137):765–770. doi: 10.1038/nature05760. [DOI] [PubMed] [Google Scholar]
- 46.Minn AJ, et al. Genes that mediate breast cancer metastasis to lung. Nature. 2005;436(7050):518–524. doi: 10.1038/nature03799. [DOI] [PMC free article] [PubMed] [Google Scholar]
- 47.Nakao S, et al. Infiltration of COX-2-expressing macrophages is a prerequisite for IL-1 beta-induced neovascularization and tumor growth. J Clin Invest. 2005;115(11):2979–2991. doi: 10.1172/JCI23298. [DOI] [PMC free article] [PubMed] [Google Scholar]
- 48.Nokihara H, et al. Monocyte chemoattractant protein-1 gene modification of multidrug-resistant human lung cancer enhances antimetastatic effect of therapy with anti-P-glycoprotein antibody in SCID mice. Int J Cancer. 1999;80(5):773–780. doi: 10.1002/(SICI)1097-0215(19990301)80:5<773::AID-IJC23>3.0.CO;2-E. [DOI] [PubMed] [Google Scholar]
- 49.Joyce JA, Pollard JW. Microenvironmental regulation of metastasis. Nat Rev Cancer. 2009;9(4):239–252. doi: 10.1038/nrc2618. [DOI] [PMC free article] [PubMed] [Google Scholar]
- 50.Hagemann T, Balkwill F, Lawrence T. Inflammation and cancer: a double-edged sword. Cancer Cell. 2007;12(4):300–301. doi: 10.1016/j.ccr.2007.10.005. [DOI] [PMC free article] [PubMed] [Google Scholar]
- 51.Hagemann T, Biswas SK, Lawrence T, Sica A, Lewis CE. Regulation of macrophage function in tumors: the multifaceted role of NF-kappaB. Blood. 2009;113(14):3139–3146. doi: 10.1182/blood-2008-12-172825. [DOI] [PMC free article] [PubMed] [Google Scholar]
- 52.Kaplan RN, Rafii S, Lyden D. Preparing the “soil”: the premetastatic niche. Cancer Res. 2006;66(23):11089–11093. doi: 10.1158/0008-5472.CAN-06-2407. [DOI] [PMC free article] [PubMed] [Google Scholar]
- 53.Karin M. The IkappaB kinase - a bridge between inflammation and cancer. Cell Res. 2008;18(3):334–342. doi: 10.1038/cr.2008.30. [DOI] [PubMed] [Google Scholar]
- 54.Hedley BD, Chambers AF. Tumor dormancy and metastasis. Adv Cancer Res. 2009;102:67–101. doi: 10.1016/S0065-230X(09)02003-X. [DOI] [PubMed] [Google Scholar]
- 55.Steeg PS, Theodorescu D. Metastasis: a therapeutic target for cancer. Nat Clin Pract Oncol. 2008;5(4):206–219. doi: 10.1038/ncponc1066. [DOI] [PMC free article] [PubMed] [Google Scholar]
- 56.Said N, Motamed K. Absence of host-secreted protein acidic and rich in cysteine (SPARC) augments peritoneal ovarian carcinomatosis. Am J Pathol. 2005;167(6):1739–1752. doi: 10.1016/S0002-9440(10)61255-2. [DOI] [PMC free article] [PubMed] [Google Scholar]
- 57.Said NA, Elmarakby AA, Imig JD, Fulton DJ, Motamed K. SPARC ameliorates ovarian cancer-associated inflammation. Neoplasia. 2008;10(10):1092–1104. doi: 10.1593/neo.08672. [DOI] [PMC free article] [PubMed] [Google Scholar]
- 58.Kim MY, et al. Tumor self-seeding by circulating cancer cells. Cell. 2009;139(7):1315–1326. doi: 10.1016/j.cell.2009.11.025. [DOI] [PMC free article] [PubMed] [Google Scholar]
- 59.Orenes-Pinero E, et al. Serum and tissue profiling in bladder cancer combining protein and tissue arrays. J Proteome Res. 2010;9(1):164–173. doi: 10.1021/pr900273u. [DOI] [PubMed] [Google Scholar]
- 60.Ruppen I, et al. Differential protein expression profiling by iTRAQ-2DLC-MS/MS of human bladder cancer EJ138 cells transfected with the metastasis suppressor KiSS-1 gene. Mol Cell Proteomics. 2010;9(10):2276–2291. doi: 10.1074/mcp.M900255-MCP200. [DOI] [PMC free article] [PubMed] [Google Scholar]
- 61.Reuter VE. The pathology of bladder cancer. Urology. 2006;67(3 suppl 1):11–17. doi: 10.1016/j.urology.2006.01.037. [DOI] [PubMed] [Google Scholar]
- 62.Dyrskjot L, et al. Gene expression in the urinary bladder: a common carcinoma in situ gene expression signature exists disregarding histopathological classification. Cancer Res. 2004;64(11):4040–4048. doi: 10.1158/0008-5472.CAN-03-3620. [DOI] [PubMed] [Google Scholar]
- 63.Barrett T, et al. NCBI GEO: mining millions of expression profiles — database and tools. Nucleic Acids Res. 2005;33(Database issue):D562–D566. doi: 10.1093/nar/gki022. [DOI] [PMC free article] [PubMed] [Google Scholar]
Associated Data
This section collects any data citations, data availability statements, or supplementary materials included in this article.


