Abstract
Type 1A diabetes (T1D) is an autoimmune disease characterized by leukocyte infiltration of the pancreatic islets of Langerhans. A major impediment to advances in understanding, preventing, and curing T1D has been the inability to “see” the disease initiate, progress, or regress, especially during the occult phase. Here, we report the development of a noninvasive method to visualize T1D at the target organ level in patients with active insulitis. Specifically, we visualized islet inflammation, manifest by microvascular changes and monocyte/macrophage recruitment and activation, using magnetic resonance imaging of magnetic nanoparticles (MNPs). As a proof of principle for this approach, imaging of infused ferumoxtran-10 nanoparticles permitted effective visualization of the pancreas and distinction of recent-onset diabetes patients from nondiabetic controls. The observation that MNPs accumulate in the pancreas of T1D patients opens the door to exploiting this noninvasive imaging method to follow T1D progression and monitoring the ability of immunomodulatory agents to clear insulitis.
Introduction
Given the clinical crypticity of insulitis, type 1A diabetes (T1D) is not usually diagnosed until very late in the disease course, when most of the causal events have already played out and options for therapeutic intervention are constrained. Another consequence of the inability to directly monitor insulitis is that intervention trials generally weigh success according to measures of β cell function, such as stimulated C-peptide levels or insulin requirements. Unfortunately, reliance on downstream measures such as these often results in long, expensive trials with limited opportunities for optimizing regimens.
Instead, focusing on insulitis might permit identification of individuals at highest risk of disease progression and provide an earlier marker of response to therapy, allowing for more cost-effective study designs. Insulitis in humans can be detected by pancreas biopsy/resection or indirectly via assays of circulating autoantibodies (autoAbs) or T cells (1–3). However, high sampling error, poor reflection of events in the pancreas, or the need for an invasive diagnostic procedure renders these techniques unacceptable for longitudinal clinical use. Moreover, these approaches are unable to differentiate between beneficial and ineffectual therapies.
We chose to explore an MRI–magnetic nanoparticle (MRI-MNP) approach because of extensive prior validation in mouse models of T1D in which initiation of insulitis is accompanied by pancreatic microvasculature changes typical of inflammation — in particular, vessel leakiness (4, 5). This can be detected using long-circulating, phagotropic nanoparticles that extravasate from the leaky vessels into the surrounding tissue and are engulfed by infiltrating cells, particularly macrophages (6). MRI quantification of MNP accumulation was capable of distinguishing major disease landmarks, of reading out disease aggressiveness, and of signaling, early on, responses to immunomodulatory agents (6, 7) — without ionizing radiation.
Results and Discussion
The MNP ferumoxtran-10 has a dextran coating and size characteristics similar to those of the MNPs used in the earlier animal experiments. It is readily taken up by macrophages, while not provoking activation or inducing proinflammatory cytokines or superoxide anions, is not chemotactic, and does not interfere with Fc-receptor–mediated phagocytosis (8). It has been used in the noninvasive detection of clinically occult cancer metastatic to lymph nodes (9). Two “training sets” were used to develop a protocol capable of differentiating individuals recently diagnosed with diabetes from controls, varying parameters such as MRI sequence and timing of MNP infusion; these are detailed in Supplemental Table 1 (supplemental material available online with this article; doi: 10.1172/JCI44339DS1).
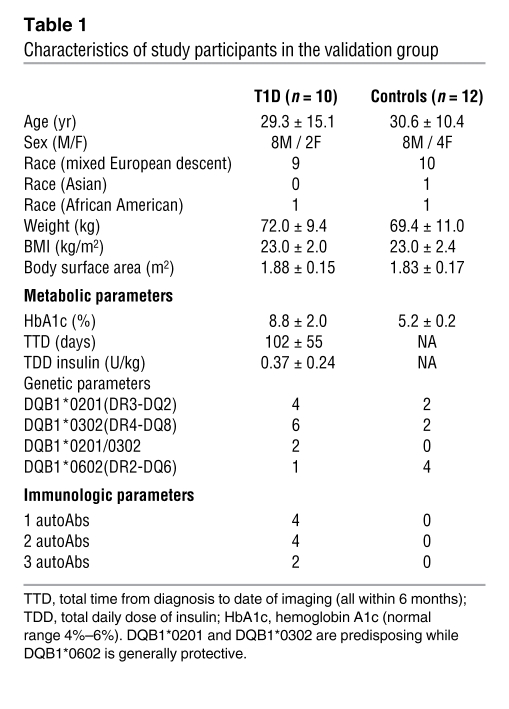
This protocol was then applied to a “validation set,” consisting of an additional 10 T1D patients within 6 months of diagnosis and 12 nondiabetic controls. The T1D and control groups were similar in age, sex, weight, BMI, and body-surface area (Table 1). As expected, there were significant differences in metabolic and immunologic parameters (notably HbA1c, P < 0.0005, and autoAb titers, P < 0.00005); in addition, diabetes-promoting HLA alleles were more highly represented in the patients, while diabetes-protective alleles were enriched in the controls (Supplemental Table 2). All participants underwent, at a minimum, 3 MRI scans: a pre-MNP series, which yields baseline signal values; an immediate post-MNP series, an indicator of vascular volume and useful for pancreas volume estimates; and a delayed post-MNP series, which likely reflects leakage of MNPs and retention by phagocytic cells.
Table 1 .
Characteristics of study participants in the validation group
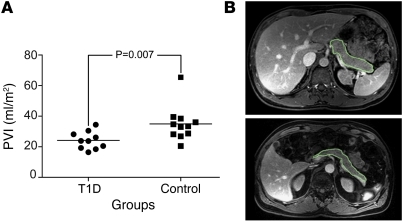
While our primary focus was on indicators of vascular integrity and leukocyte infiltration, we also measured pancreas volume, given that pancreatic atrophy is a characteristic observation in long-standing T1D, as evidenced by examination of pancreas volume at autopsy, by ultrasound, by CT, or via MRI (10–13). To control for the influences of body build on pancreatic volume, we calculated a pancreatic volume index (PVI) by dividing the pancreatic volume by body-surface area (12, 14). Mean PVI of the patients was 31% less than that of the controls (Figure 1). Since one of the controls was an outlier from the normal distribution, sensitivity analysis was performed excluding this outlier and the 2 groups were still significantly different (P = 0.008). We did not find a correlation between PVI and daily insulin requirement, time since diagnosis, age, or autoAb titers, but there was a trend toward association with poor glycemic control (HbA1c, P = 0.08, r = 0.57).
Figure 1. Pancreas volume index (PVI) of recently diagnosed diabetes patients is less than that of controls.
(A) PVI, calculated by dividing pancreas volume by body-surface area, of patients with recent onset T1D (n = 10, circles) is less than that of nondiabetic controls (n = 11, squares). The bars indicate mean values (T1D 24.1 ± 5.7 ml/m2, controls 35.0 ± 11.5 ml/m2; Mann-Whitney U test, P = 0.007). (B) Representative single MR-VIBE slices at the level of the body/tail of the pancreas are shown with the pancreas outlined in green. The control subject (upper panel) and the individual with recent onset T1D (lower panel) have total estimated pancreas volumes of 119 ml and 50 ml respectively.
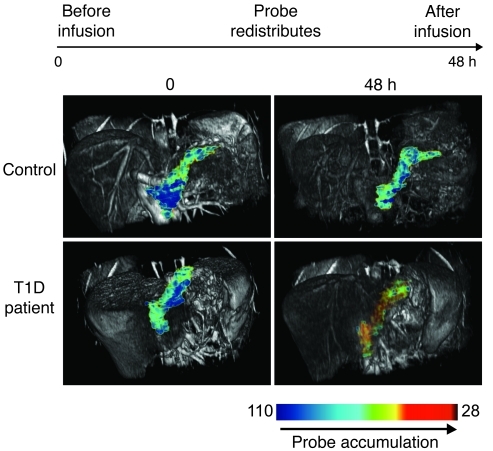
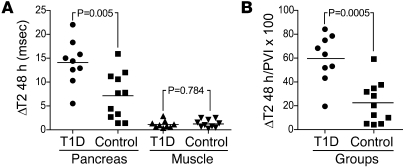
Since MNPs are negative T2 contrast agents, we used local changes in T2 as a surrogate for vascular leak/macrophage uptake. Of the 22 individuals enrolled in this part of the study, 1 T1D and 1 control subject were excluded, based on a priori criteria, after possible contrast-related reactions (see Supplemental Methods for details and sensitivity analysis). We imaged participants before and 48 hours after ferumoxtran-10 infusion, with concentration-related signal intensity loss calculated based on T2-weighted sequences. Illustrative 3D reconstructions for a patient and a control showing T2 pseudocolor in the pancreas region overlaid on anatomic T1 images are presented in Figure 2. The lower T2 (more red coloration) within the pancreas at 48 hours suggests higher retention of MNP in the patient than the control. The patient also had more heterogeneity in T2 throughout the pancreas with a greater change in T2 (and potentially more active insulitis) in the head and body than the tail of the pancreas. The ΔT2 was calculated by subtracting matched region of interest (ROI) 48 hours after contrast T2 from the precontrast T2 values. Comparing ΔT2 of patients and controls, there was a significant difference in pancreas but not the paraspinous muscle internal control (Figure 3A). We did not find a correlation between the pancreas ΔT2 in patients and daily insulin requirement, time since diagnosis, age, HbA1c, or autoAb titers.
Figure 2. Insulitis may be visualized by MRI.
Shown are T2-pseudocolor reconstructions of the pancreas overlaid on 3D-VIBE images, measured before and 48 hours after MNP infusion. T2 values in the pancreas are similar between the patient and control subjects before infusion but different after infusion.
Figure 3. MRI-MNP may be used for the noninvasive quantification of pancreatic changes associated with the development of diabetes.
(A) ΔT2 was measured inside matching ROIs before and 48 hours after infusion of MNPs, reflecting local accumulation of MNPs. Comparing recent-onset T1D patients (n = 9) and controls (n = 11), there was a significant difference in ΔT2 within the pancreas (T1D 14.1 ± 4.7 msec, controls 7.1 ± 4.9 msec) but not within paraspinous muscle (T1D 1.28 ± 0.78 msec, controls 1.23 ± 0.90 msec). (B) A composite index was computed using the formula 100 × (ΔT2pancreas/PVI); (T1D 59.7 ± 20.1, controls 22.5 ± 17.5).
Inferring from our prior animal experiments and others’ autopsy series, it is likely that MNP accumulation, as measured by ΔT2, is a measure of the aggressiveness of ongoing islet inflammation, while the PVI reflects more the integration of prior disease. If these different underlying etiologies are correct, it is unsurprising that there was no correlation between these 2 measurements in the T1D patients (P = 0.31, r = 0.38; and Supplemental Figure 1). We therefore sought to combine the 2 values into a composite index (Figure 3B). Applying the formula 100 × (ΔT2/PVI) yielded significantly different values between patients and controls, with a receiver operator curve AUC of 0.91. This composite index was developed post hoc and will require further validation; more sophisticated models will likely be possible with additional observations.
Two findings from this study are worth highlighting. First, the PVIs of T1D patients were only about two-thirds those of controls. Other groups have noted small pancreas volumes with long-standing T1D (11–13), but to our knowledge none this early in clinical disease. Although we cannot exclude the possibility that the T1D subjects had lower PVIs unrelated to insulitis, a more likely explanation is that there is a reduction in PVI with loss of trophic factors, including insulin, delivered by centrifugal flow from endocrine to exocrine pancreas (15) during insulitis. Supporting this, specimens from those who died soon after T1D diagnosis demonstrate exocrine atrophy restricted to areas adjacent to insulin-deficient islets (16). Interestingly, HNF1A maturity-onset diabetes of the young (MODY3) patients generally are partially insulin insufficient with intermediate pancreas volumes between T1D patients and controls (14). Although we did not find a statistically significant relationship between duration of clinical diabetes and pancreas volume, such a relationship has been proposed for children with longer-standing disease (11).
Second, T1D patients showed heterogeneity in MNP accumulation. Although not testable in this small study, one could posit that such differences reflect heterogeneity in the disease itself. For example, we identified a patient with the HLA allele DQB1*0602, who had the second lowest ΔT2 (overlapping with controls) and the highest daily insulin requirement (0.8 U/kg). Although merely hypothesis generating at this point, this finding is consistent with previously published data that DQB1*0602 may be associated with insulin resistance in a mixed type 1/type 2 diabetes phenotype (17). A similar appreciation for the heterogeneity of T1D is also starting to emerge from histological examinations of cadaveric pancreata (18). Our T1D study group was predominantly male and all at least 18 years old, which may have influenced the results. Since there is age-dependent variation in disease progression, with older age at diagnosis associated with less compromised insulin secretory capacity and less rapid deterioration (19), children with T1D could potentially have even more pronounced ΔT2. Studies on many more individuals would be needed to probe the genetic, sex-related, age-dependent, environmental, and mechanistic underpinnings of such differences.
What biological features does MNP accumulation represent in this particular context? The data on using MRI-MNP in animal models of T1D are clear: the MRI signal is glycemia independent, reflecting MNP leakage from the vasculature coupled with uptake by macrophages (6, 7). An inflammatory infiltrate similar to that in rodents has been observed via histology from individuals with T1D (2, 20). In addition, increased vascular permeability of the pancreatic capillaries may be inferred from enhanced leakage of polyclonal immunoglobulin within the pancreas in T1D (21). Other pancreatic diseases associated with inflammation, such as pancreatitis and pancreatic adenocarcinoma, can be easily differentiated from T1D based on imaging criteria and biochemical features. As concerns our objective, the particular biological features being reflected by pancreatic MRI-MNP may not be so important: the critical point is that we have described a noninvasive biomarker for insulitis in T1D patients.
We anticipate that with further development, this technique will have many uses, including aiding in difficult diagnoses (e.g., type 1B diabetes or individuals with latent autoimmune diabetes of the adult), identifying individuals at highest risk of converting from cryptic insulitis to overt diabetes, and helping to monitor patients’ early responses to immunomodulatory interventions. These last 2 points, already modeled in NOD mice (7), should serve to reduce several of the existing barriers to more rapid development and implementation of successful therapies for T1D.
Methods
Study participants.
Informed consent was obtained from all participants after the nature and possible consequences of the studies were explained. All participants were 18 years of age or older. Individuals in the recent-onset T1D group were within 6 months of disease diagnosis. Controls did not have either T1D or a family history of T1D and in the validation group had normal oral glucose tolerance without anti-insulin, anti-GAD, or anti-IA2 autoAbs. The protocols were approved by Joslin Diabetes Center Committee on Human Studies and Massachusetts General Hospital Institutional Review Board (ClinicalTrials.gov NCT00585936). Two mild, possible contrast-related reactions were noted during the validation study; see Supplemental Methods for further details.
MRI and analyses.
Ferumoxtran-10 (Combidex; AMAG Pharmaceuticals Inc.) was diluted in 100 ml of normal saline and infused at a dose of 2.6 mg of iron per kilogram of body weight over a period of 30 minutes. GE and Siemens 1.5T systems were used during the training phase, while a Siemens 1.5T system, equipped with TIM technology using an 8-channel phased-array torso body coil, was used for the validation cohort. The protocol included a modified, breath-hold, mono-polar, multi-echo gradient echo (GE) sequence with equally spaced echoes (n = 6, TE = 4.8–24.8, Tr = 333 ms, thickness = 4 mm) for T2* quantification and a modified turbo spin echo (SE) T2 weighted sequence TE/TR ([48, 86, 144]/2200 ms) for T2 quantification. For volume estimation, the post-MNP T1-weighted 3D-volumetric interpolated breath-hold examination (VIBE) sequences with fat selective prepulse were used (a GE sequence, 256 × 192 encoding matrix, asymmetric field of view 30 × 24, TE/TR 2.4/5 ms, and voxel size 1.17 × 1.17 × 2.5 mm). The pancreatic area on each slice was estimated based on freehand annotation and pancreatic volume calculated by summation over the volume intervals.
Image analysis was performed using OsiriX (OsiriX Imaging Software) software with custom-made plug-ins for monoexponential fit of T2 or T2*. All images were masked prior to analysis, with the readers unaware of the disease status of the study subjects. ROIs for analysis were defined manually on the pancreas or paraspinal muscles on 3 consecutive slices, with only the central slice used for measurement to minimize volume averaging from adjacent nonpancreas tissues.
Laboratory analyses.
HLA typing was performed using the Roche Diagnostics T1D linear array assay. AutoAbs for insulin, GAD, and IA2 were measured via radioimmunoassays.
Statistics.
Results for continuous variables are expressed as mean ± SD. An unpaired 2-tailed t test with Welch’s correction for unequal variance or Mann-Whitney U test was used for comparisons depending on whether distributions conformed to normality as assessed by the Shapiro-Wilk normality test. Correlation was evaluated using Spearman’s rank correlation coefficient. Inter-observer variation was analyzed by linear regression. Analysis was performed using GraphPad Prism 5 (GraphPad Software). P ≤ 0.05 was considered statistically significant.
Supplementary Material
Acknowledgments
This work was supported by US National Institute of Allergy and Infectious Disease grant P01-A1-054904 and in part by U01-HL080731, P50-CA86355, U54-CA119349, and U24-CA092782 for technology development. Additional support was provided by Harvard Catalyst: Harvard Clinical and Translational Science Center (NIH Award UL1-RR025758 and contributions from Harvard University and affiliated academic health care centers). The content is solely the responsibility of the authors and does not necessarily represent the official views of Harvard Catalyst, Harvard University and its affiliated academic health care centers, the National Center for Research Resources, or the NIH. This study utilized the Joslin Clinical Research Center, which receives financial support from philanthropic donors. J.L. Gaglia acknowledges support from Irvington Institute/Dana Foundation Fellowship of the Cancer Research Institute and Clinical Investigator Training Program: Harvard/MIT Health Sciences and Technology — Beth Israel Deaconess Medical Center, in collaboration with Pfizer Inc. and Merck & Co. A.R. Guimaraes acknowledges support from the RSNA Research and Education Foundation Scholar Award. We thank R. Phillips for study subject coordination, R. Betensky for statistical assistance, and T. Orban for measuring autoAbs. Ferumoxtran-10 (Combidex) was provided by AMAG Pharmaceuticals Inc.
Footnotes
Conflict of interest: Diane Mathis, Ralph Weissleder, and Christophe Benoist are co-inventors on a patent application covering methods of imaging inflammation in pancreatic islets.
Citation for this article: J Clin Invest. 2011;121(1):442–445. doi:10.1172/JCI44339.
Stuart E. Turvey’s present address is: Division of Infectious and Immunological Diseases, British Columbia Children’s Hospital, Vancouver, British Columbia, Canada.
References
- 1.Foulis AK, Liddle CN, Farquharson MA, Richmond JA, Weir RS. The histopathology of the pancreas in type 1 (insulin-dependent) diabetes mellitus: a 25-year review of deaths in patients under 20 years of age in the United Kingdom. Diabetologia. 1986;29(5):267–274. doi: 10.1007/BF00452061. [DOI] [PubMed] [Google Scholar]
- 2.Itoh N, et al. Mononuclear cell infiltration and its relation to the expression of major histocompatibility complex antigens and adhesion moleucles in pancreas biospy speciments from newly diagnosed insulin-dependent diabetes mellitus patients. J Clin Invest. 1993;92(5):2313–2322. doi: 10.1172/JCI116835. [DOI] [PMC free article] [PubMed] [Google Scholar]
- 3.Lieberman SM, DiLorenzo TP. A comprehensive guide to antibody and T-cell responses in type 1 diabetes. Tissue Antigens. 2003;62(5):359–377. doi: 10.1034/j.1399-0039.2003.00152.x. [DOI] [PubMed] [Google Scholar]
- 4.Papaccio G. Insulitis and islet microvasculature in type 1 diabetes. Histol Histopathol. 1993;8(4):751–759. [PubMed] [Google Scholar]
- 5.De Paepe ME, Corriveau M, Tannous WN, Seemayer TA, Colle E. Increased vascular permeability in pancreas of diabetic rats: detection with high resolution protein A-gold cytochemistry. Diabetologia. 1992;35(12):1118–1124. doi: 10.1007/BF00401364. [DOI] [PubMed] [Google Scholar]
- 6.Denis MC, Mahmood U, Benoist C, Mathis D, Weissleder R. Imaging inflammation of the pancreatic islets in type 1 diabetes. Proc Natl Acad Sci U S A. 2004;101(34):12634–12639. doi: 10.1073/pnas.0404307101. [DOI] [PMC free article] [PubMed] [Google Scholar]
- 7.Turvey SE, et al. Noninvasive imaging of pancreatic inflammation and its reversal in type 1 diabetes. . J Clin Invest. 2005;115(9):2454–2461. doi: 10.1172/JCI25048. [DOI] [PMC free article] [PubMed] [Google Scholar]
- 8.Muller K, et al. Effect of ultrasmall superparamagnetic iron oxide nanoparticles (Ferumoxtran-10) on human monocyte-macrophages in vitro. Biomaterials. 2007;28(9):1629–1642. doi: 10.1016/j.biomaterials.2006.12.003. [DOI] [PubMed] [Google Scholar]
- 9.Harisinghani MG, et al. Noninvasive detection of clinically occult lymph-node metastases in prostate cancer. N Engl J Med. 2003;348(25):2491–2499. doi: 10.1056/NEJMoa022749. [DOI] [PubMed] [Google Scholar]
- 10.Lohr M, Kloppel G. Residual insulin positivity and pancreatic atrophy in relation to duration of chronic type 1 (insulin-dependent) diabetes mellitus and microangiopathy. Diabetologia. 1987;30(10):757–762. doi: 10.1007/BF00275740. [DOI] [PubMed] [Google Scholar]
- 11.Altobelli E, Blasetti A, Verrotti A, Di Giandomenico, V, Bonomo L, Chiarelli F. Size of pancreas in children and adolescents with type I (insulin-dependent) diabetes. J Clin Ultrasound. 1998;26(8):391–395. doi: 10.1002/(SICI)1097-0096(199810)26:8<391::AID-JCU3>3.0.CO;2-D. [DOI] [PubMed] [Google Scholar]
- 12.Goda K, Sasaki E, Nagata K, Fukai M, Ohsawa N, Hahafusa T. Pancreatic volume in type 1 and type 2 diabetes mellitus. Acta Diabetol. 2001;38(3):145–149. doi: 10.1007/s005920170012. [DOI] [PubMed] [Google Scholar]
- 13.Williams AJ, Chau W, Callaway MP, Dayan CM. Magnetic resonance imaging: a reliable method for measuring pancreatic volume in Type 1 diabetes. Diabet Med. 2007;24(1):35–40. doi: 10.1111/j.1464-5491.2007.02027.x. [DOI] [PubMed] [Google Scholar]
- 14.Vesterhus M, Haldorsen IS, Raeder H, Molven A, Njolstad PR. Reduced pancreatic volume in hepatocyte nuclear factor 1A-maturity-onset diabetes of the young. J Clin Endocrinol Metab. 2008;93(9):3505–3509. doi: 10.1210/jc.2008-0340. [DOI] [PubMed] [Google Scholar]
- 15.Henderson JR, Daniel PM, Fraser PA. The pancreas as a single organ: the influence of the endocrine upon the exocrine part of the gland. Gut. 1981;22(2):158–167. doi: 10.1136/gut.22.2.158. [DOI] [PMC free article] [PubMed] [Google Scholar]
- 16.Foulis AK, Stewart JA. The pancreas in recent-onset type 1 (insulin-dependent) diabetes mellitus: insulin content of islets, insulitis and associated changes in the exocrine acinar tissue. Diabetologia. 1984;26(6):456–461. doi: 10.1007/BF00262221. [DOI] [PubMed] [Google Scholar]
- 17.Greenbaum CJ, et al. High frequency of abnormal glucose tolerance in DQA1*0102/DQB1*0602 relatives identified as part of the Diabetes Prevention Trial--Type 1 Diabetes. Diabetologia. 2005;48(1):68–74. doi: 10.1007/s00125-004-1608-z. [DOI] [PubMed] [Google Scholar]
- 18.Gianani R, et al. Dimorphic histopathology of long-standing childhood-onset diabetes. Diabetologia. 2010;53(4):690–698. doi: 10.1007/s00125-009-1642-y. [DOI] [PubMed] [Google Scholar]
- 19.Leslie RD, Delli CM. Age-dependent influences on the origins of autoimmune diabetes: evidence and implications. Diabetes. 2004;53(12):3033–3040. doi: 10.2337/diabetes.53.12.3033. [DOI] [PubMed] [Google Scholar]
- 20.Hanninen A, Jalkanen S, Salmi M, Toikkanen S, Nikolakaros G, Simell O. Macrophages, T cell receptor usage, and endothelial cell activation in the pancreas at the onset of insulin-dependent diabetes mellitus. J Clin Invest. 1992;90(5):1901–1910. doi: 10.1172/JCI116067. [DOI] [PMC free article] [PubMed] [Google Scholar]
- 21.Signore A, et al. In vivo measurement of immunoglobulin accumulation in the pancreas of recent onset type 1 diabetic patients. Clin Exp Rheumatol. 1996;14 suppl 15:S41–S45. [PubMed] [Google Scholar]
Associated Data
This section collects any data citations, data availability statements, or supplementary materials included in this article.


