Abstract
Recent data have suggested that insulin resistance may be associated with a diminished ability of skeletal muscle to undergo hypertrophy (Paturi S, Gutta AK, Kakarla SK, Katta A, Arnold EC, Wu M, Rice KM, Blough ER. J Appl Physiol 108: 7–13, 2010). Here we examine the effects of insulin resistance using the obese Zucker (OZ) rat with increased muscle loading on the regulation of the mammalian target of rapamycin (mTOR) and its downstream signaling intermediates 70-kDa ribosomal protein S6 kinase (p70S6k), ribosomal protein S6 (rpS6), eukaryotic elongation factor 2 (eEF2), and eukaryotic initiation factor 4E-binding protein 1 (4E-BP1). Compared with that observed in lean Zucker (LZ) rats, the degree of soleus muscle hypertrophy as assessed by changes in muscle wet weight (LZ: 35% vs. OZ: 16%) was significantly less in the OZ rats after 3 wk of muscle overload (P < 0.05). This diminished growth in the OZ rats was accompanied by significant impairments in the ability of the soleus to undergo phosphorylation of mTOR (Ser2448), p70S6k (Thr389), rpS6 (Ser235/236), and protein kinase B (Akt) (Ser473 and Thr308) (P < 0.05). Taken together, these data suggest that impaired overload-induced hypertrophy in insulin-resistant skeletal muscle may be related to decreases in the ability of the muscle to undergo mTOR-related signaling.
Keywords: ribosomal protein S6, eukaryotic initiation factor 4E-binding protein 1, eukaryotic elongation factor 2, myogenin
the obese zucker (fa/fa) rat (OZ) is commonly used as an animal model for the investigation of metabolic syndrome given its proclivity to exhibit severe skeletal muscle insulin resistance, hyperglycemia, and hyperlipidemia (43). Previous data from our laboratory have suggested that the capacity of the OZ soleus muscle to undergo hypertrophy in response to increased loading is diminished compared with that observed in the lean Zucker (LZ) rat. Why metabolic syndrome may affect the hypertrophic response of muscle is not clear although we and others have noted that insulin resistance is associated with differences in the ability of skeletal muscle to activate intracellular signaling cascades in response to alterations in contractile activity (14, 19, 20, 34).
It is well accepted that increases in protein synthesis precede skeletal muscle growth (22, 40). One critical signaling pathway that has been shown to play a role in controlling protein synthesis following increased muscle loading is the mammalian target of rapamycin (mTOR) (5, 29). The regulation of mTOR signaling is complex and is likely influenced by several upstream molecules and pathways, since previous data have suggested the participation of phosphoinositide 3-kinase (PI 3-kinase), phosphatase and tensin homologue deleted on chromosome 10 (PTEN), protein kinase B/Akt, TSC2/Tuberin, and raptor (5, 16, 21, 36, 37, 42). The mTOR functions to regulate several physiological functions, such as gene transcription, protein metabolism, cell cycle control, and cytoskeleton organization (18, 38). When active (phosphorylated), mTOR is thought to promote protein translation by controlling the activity of several downstream effectors, including the 70-kDa ribosomal protein S6 kinase (p70S6k), ribosomal protein S6 (rpS6), eukaryotic initiation factor 4E-binding protein 1 (4E-BP1), and eukaryotic elongation factor 2 (eEF2) (23, 30).
The primary purpose of this study was to determine whether insulin resistance affects the ability of skeletal muscle to activate mTOR signaling in response to increased loading. The second purpose was to examine the time course of mTOR signaling during the initial and latter phases of muscle adaptation. We hypothesized that overload-induced mTOR signaling would differ between normal and insulin-resistant muscle. Our data suggest that insulin resistance or other comorbidities may be associated with decreases in the ability of skeletal muscle to activate mTOR signaling. Whether these changes alone or in combination with other factors may explain why insulin resistance may lead to differences in the capacity of skeletal muscle to undergo growth are currently unclear.
MATERIALS AND METHODS
Animal care.
All procedures were performed as outlined in the Guide for the Care and Use of Laboratory Animals as approved by the Council of the American Physiological Society and the institutional animal use review board of Marshall University. Young male LZ (n = 12) and OZ (n = 12) rats were obtained from the Charles River Laboratories. All animals were 12 wk of age at completion of this study. Rats were housed two per cage in an American Association for the Accreditation of Laboratory Animal Care-approved vivarium. Housing conditions consisted of a 12:12-h dark-light cycle, and temperature was maintained at 22 ± 2°C. Animals were provided food and water ad libitum and allowed to recover from shipment for at least 2 wk before experimentation. During this time, the animals were carefully observed and weighed weekly to ensure none exhibited signs of failure to thrive, such as precipitous weight loss, disinterest in the environment, or unexpected gait alterations.
Synergist ablation procedure.
Unilateral overload of the soleus muscle for 1 and 3 wk was achieved through the surgical ablation of the medial and the proximal two-thirds of the lateral head of the gastrocnemius (4). The unilateral ablation model allows within-animal comparisons, thus eliminating bias due to systemic factors. Rats were anesthetized with a ketamine-xylazine (4:1) cocktail (50 mg/kg ip), and the distal two-thirds of the gastrocnemius muscle was surgically removed from the left hindlimb as previously described (4). A sham (control) operation was performed on the right hindlimb. The sham procedure consisted of an incision through the skin, followed by blunt isolation of the Achilles tendon and gastrocnemius muscle before closure. Animals were active immediately after recovering from anesthesia and were checked two times daily during the 7-day postoperative period. No signs of postoperative complications (such as infection or undue distress) were observed.
Measurement of blood glucose and serum insulin.
Animals were fasted for 14 h, and blood samples were collected directly just before animal death. Blood samples were immediately centrifuged at 2,000 g for 10 min, and the supernatant serum was stored at −80°C until use. Serum insulin concentration was determined using a rat/mouse insulin ELISA kit (Linco Research, St. Charles, MO) as outlined by the manufacturer. Blood glucose was measured using a blood glucose meter (Bayer Contour; Bayer HealthCare, Tarrytown, NY).
Tissue collection.
The soleus muscles were collected 7 days (n = 6 LZ and n = 6 OZ) or 21 days (n = 6 LZ and n = 6 OZ) after the synergist ablation. The animals were 12 wk old at the time of tissue collection. Rats were anesthetized with a ketamine-xylazine (4:1) cocktail (50 mg/kg ip) and supplemented as necessary for reflexive response before tissue collections. The soleus muscles from both legs were quickly removed, trimmed of excess connective tissue, weighed on an analytical balance, frozen in liquid nitrogen, and stored at −80°C until further analysis.
Tissue homogenization and determination of protein concentration.
Muscles were homogenized in Pierce Tissue Protein Extraction Reagent (10 ml/g tissue; Rockford) that contained protease inhibitors (P8340; Sigma-Aldrich, St. Louis, MO) and phosphatase inhibitors (P5726; Sigma-Aldrich). After incubation on ice for 30 min, the homogenate was collected by centrifuging at 12,000 g for 5 min at 4°C. The protein concentration of homogenates was determined via the Bradford method (Fisher Scientific, Rockford, IL). Homogenate samples were boiled in a Laemmli 2× sample buffer (Sigma-Aldrich) for 5 min.
SDS-PAGE and immunoblotting.
Total protein from each sample (40 μg) was separated on a 10% PAGEr Gold Precast gel (Lonza, Rockland, ME) and then transferred to a nitrocellulose membrane. Visual verification of transfer and equal protein loading among lanes were accomplished by Ponceau S staining of the membranes. For immunodetection, membranes were blocked for 1 h at room temperature in blocking buffer [5% nonfat dry milk in 20 mM Tris-base, 150 mM NaCl, and 0.05% Tween 20 (TBS-T), pH 7.6], serially washed in TBS-T at room temperature, and then probed with antibodies for the detection of Akt (no. 9272), phospho-Akt (Ser473) (no. 9271), phospho-Akt (Thr308) (no. 9275), mTOR (no. 2972), phospho-mTOR (Ser2448) (no. 2971), p70S6k (no. 9202), phospho-p70S6k (Thr389) (no. 9205), phospho-p70S6k (Thr421/Ser424) (no. 9204), rpS6 (no. 2217), phospho-rpS6 (Ser235/236) (no. 4858), 4E-BP1 (no. 9452), phospho 4E-BP1 (Thr37/46) (no. 9459), eEF2 (no. 2332), phospho-eEF2 (Thr56) (no. 2331), Raptor (no. 2280), Tuberin/TSC2 (no. 3612), phospho-Tuberin/TSC2 (Thr1462) (no. 3617), PTEN (no. 9552), phospho-PTEN (Ser380/Thr382/383) (no. 9552), PI 3-kinase (no. 4257), glyceraldehyde-3-phosphate dehydrogenase (GAPDH) (no. 2118) (from Cell Signaling Technology, Beverly, MA), and myogenin (M-225) (sc-576) and myo-D (C-20) (sc-304) (from Santa Cruz Biotechnology, Santa Cruz, CA). Membranes were incubated overnight at 4°C in primary antibody buffer (5% BSA in TBS-T, pH 7.6, primary antibody diluted 1:1,000), followed by washing in TBS-T (3 × 5 min each), and incubation with horseradish peroxidase-conjugated secondary antibody [anti-rabbit (no. 7074) or anti-mouse (no. 7076); Cell Signaling Technology, Danvers, MA] in blocking buffer for 1 h. After removal of the secondary antibody, membranes were washed (3 × 5 min each) in TBS-T, and protein bands were visualized on reaction with ECL reagent (Amersham ECL Western Blotting reagent RPN 2106; GE Healthcare Bio-Sciences, Piscataway, NJ). Target protein levels were quantified by AlphaEaseFC image analysis software (Alpha Innotech, San Leandro, CA) and normalized to GAPDH.
Statistical analysis.
Results are presented as means ± SE. Data were analyzed using the Sigma Stat 3.5 statistical program. The effects of insulin resistance on protein phosphorylation were analyzed using a two-way ANOVA followed by the Student-Newman-Keuls post hoc testing where appropriate. Differences were considered significant at P < 0.05.
RESULTS
Insulin resistance is associated with skeletal muscle atrophy.
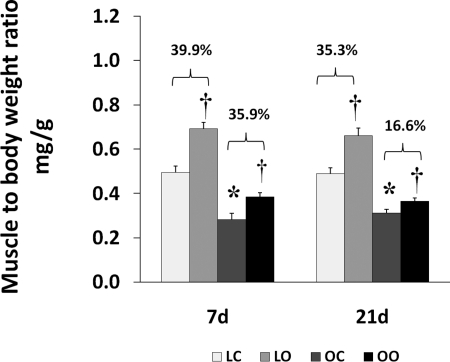
All of the animals were 12 wk of age at the end of the study. The OZ animals had significantly higher serum levels of insulin (1.75 ± .05 vs. 0.48 ± .03 ng/ml; 3.64-fold) and blood glucose (226 ± 11 vs. 121 ± 10 mg/dl; 1.85-fold) compared with their lean counterparts. These results are consistent with the notion that the OZ rats were hyperglycemic and hyperinsulinemic [Supplemental Fig. 1 (Supplemental data for this article may be found on the American Journal of Physiology: Regulatory, Integrative and Comparative Physiology website)]. The OZ rats exhibited a significantly higher body weight than the LZ at both 7 and 14 days of observation (464 ± 12 vs. 302 ± 3 g at 7 days; P < 0.05; 460 ± 26 vs. 289 ± 10 g at 21 days; P < 0.05). Soleus muscle wet weights were significantly lower in the OZ compared with the LZ (128 ± 11 vs. 150 ± 6 mg at 7 days; P < 0.05; 128.0 ± 6.5 vs. 141.0 ± 8.3 mg at 21 days; P < 0.05; Fig. 1).
Fig. 1.
Muscle wet weight-to-body weight ratios in control and loaded (7 or 21 days) soleus muscles of lean Zucker and obese Zucker rats; n = 6. P < 0.05, significantly different from lean control value (*) and significantly different from contralateral control (†). 7d, 7 days of loading; 21d, 21 days of loading; LC, lean control; LO, lean overload; OC, obese control; OO, obese overload.
Insulin resistance is associated with a diminished hypertrophic response that is characterized by decreases in the activation of mTOR-related signaling.
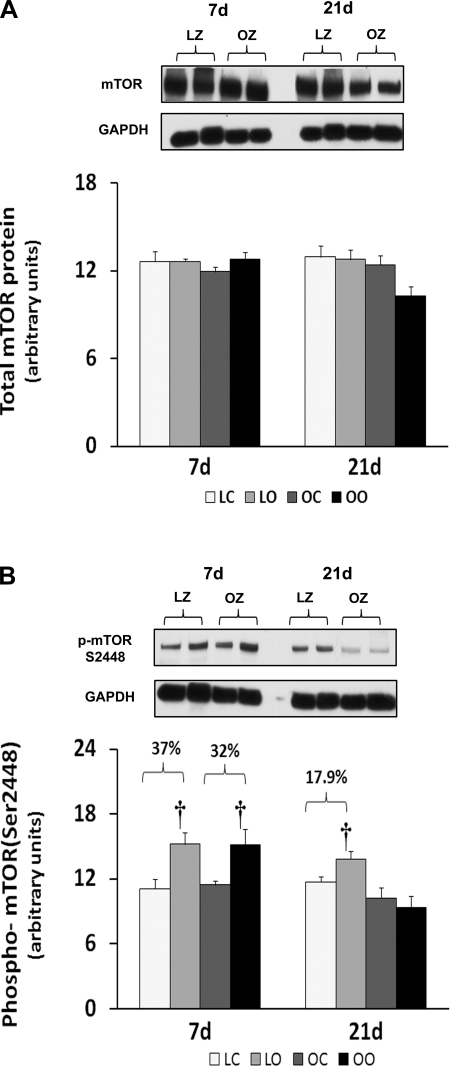
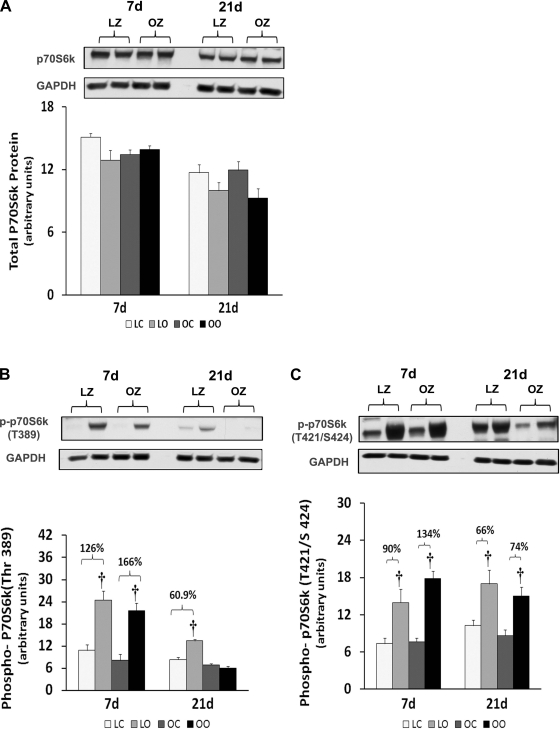
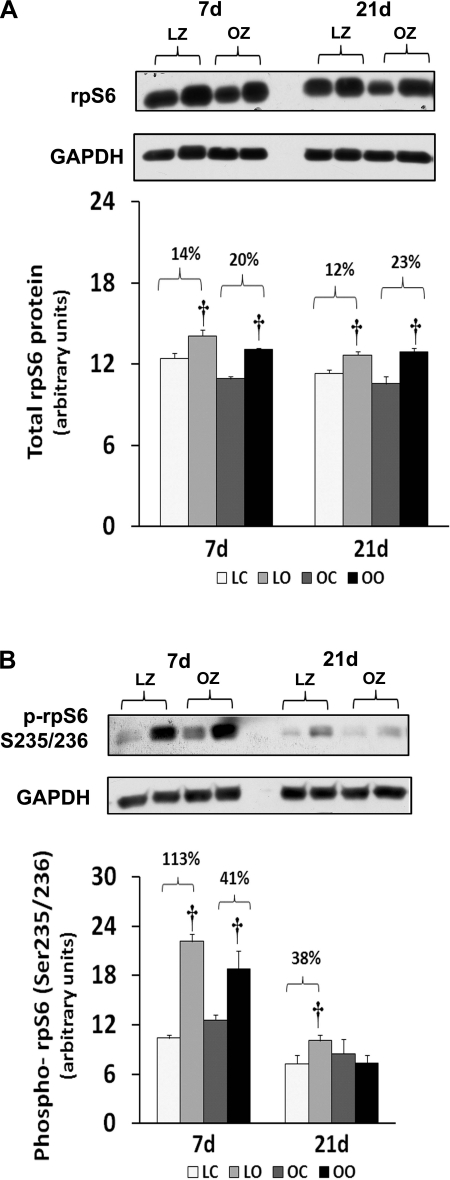
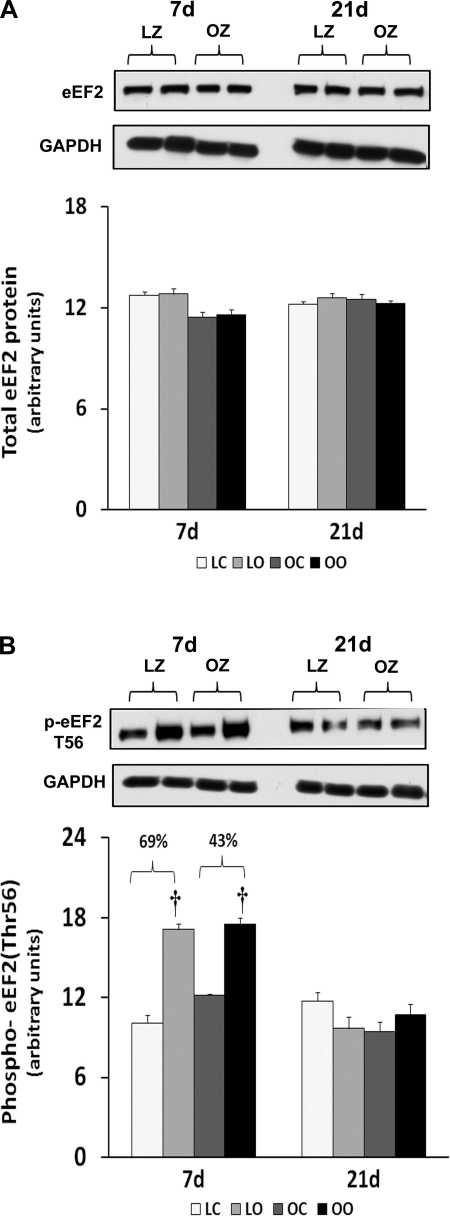
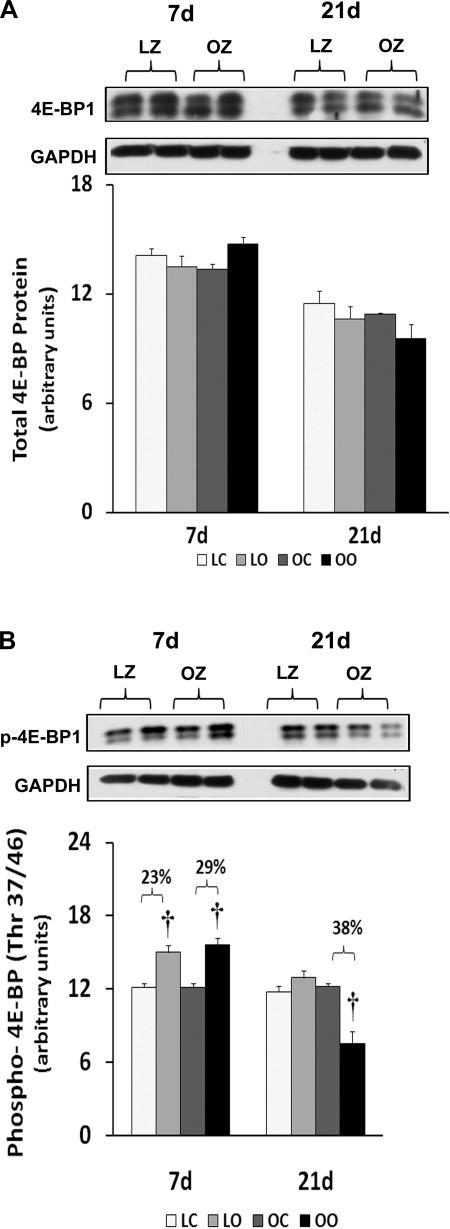
Muscle overload increased soleus muscle mass to a similar extent in the LZ and OZ animals at 7 days (39 vs. 36%), but the degree of overload-induced muscle growth at 21 days was greater in the LZ compared with OZ animals (35 vs. 16%; P < 0.05; Fig. 1). According to our immunoblot analysis, the phosphorylation of mTOR (Ser2448) and p70S6k (Thr389) in overloaded muscles was elevated relative to the contralateral control after 7 and 21 days of overload in the LZ rats and after 7 days of overload in the OZ rats (P < 0.05; Figs. 2B and 3B). The phosphorylation of p70S6k (Thr421/Ser424) was significantly higher in overloaded muscles of both LZ and OZ rats after 7 and 21 days (P < 0.05; Fig. 3C). Overload increased the amount of rpS6 protein in both the LZ and OZ rats at 7 and 21 days of observation (P < 0.05; Fig. 4A). Conversely, the phosphorylation of rpS6 (Ser235/236) in overloaded muscles was elevated after 7 and 21 days of overload in LZ animals but only at the 7-day time point in the OZ rats (P < 0.05; Fig. 4B). The phosphorylation eEF2 (Thr56) was higher in both the LZ and OZ rats after 7 days of overload (P < 0.05) (Fig. 5B). Overload did not alter the amount of phosphorylated 4E-BP1 in either the LZ or OZ animals (Fig. 6B).
Fig. 2.
Immunoblot analysis of the mammalian target of rapamycin (mTOR) protein content (A) and phosphorylation (B) at Ser2448 in control and overloaded soleus muscles of lean Zucker (LZ) and obese Zucker (OZ) rats. Data are expressed as integrated optical density (IOD) × band area and expressed in arbitrary units relative to the amount of glyceraldehyde-3-phosphate dehydrogenase (GAPDH); n = 6. †Significantly different from contralateral control muscle, P < 0.05.
Fig. 3.
Immunoblot analysis of the 70-kDa ribosomal protein S6 kinase (p70S6k) protein content (A), phosphorylation at Thr389 (B), and phosphorylation at Thr421/Ser424 (C) in control and overloaded soleus muscles of LZ and OZ rats. Data are expressed as IOD × band area and expressed in arbitrary units relative to the amount of GAPDH; n = 6. †Significantly different from contralateral control muscle, P < 0.05.
Fig. 4.
Immunoblot analysis of the ribosomal protein S6 (rpS6) protein content (A) and phosphorylation (B) at Ser235/236 in control and loaded soleus muscles of LZ and OZ rats. Data are expressed as IOD × band area and expressed in arbitrary units relative to the amount of GAPDH; n = 6. †Significantly different from contralateral control muscle, P < 0.05.
Fig. 5.
Immunoblot analysis of the eukaryotic elongation factor 2 (eEF2) protein content (A) and phosphorylation (B) at Thr56 in control and loaded soleus muscles of LZ and OZ rats. Data are expressed as IOD × band area and expressed in arbitrary units relative to the amount of GAPDH; n = 6. †Significantly different from contralateral control muscle, P < 0.05.
Fig. 6.
Immunoblot analysis of the eukaryotic initiation factor 4E-binding protein 1 (4E-BP1) protein content (A) and phosphorylation (B) at Thr37/46 in control and loaded soleus muscles of LZ and OZ rats. Data are expressed as IOD × band area and expressed in arbitrary units relative to the amount of GAPDH; n = 6. †Significantly different from contralateral control muscle, P < 0.05.
Alterations in regulation of different possible upstream regulators of mTOR signaling in the soleus muscle of OZ with overload.
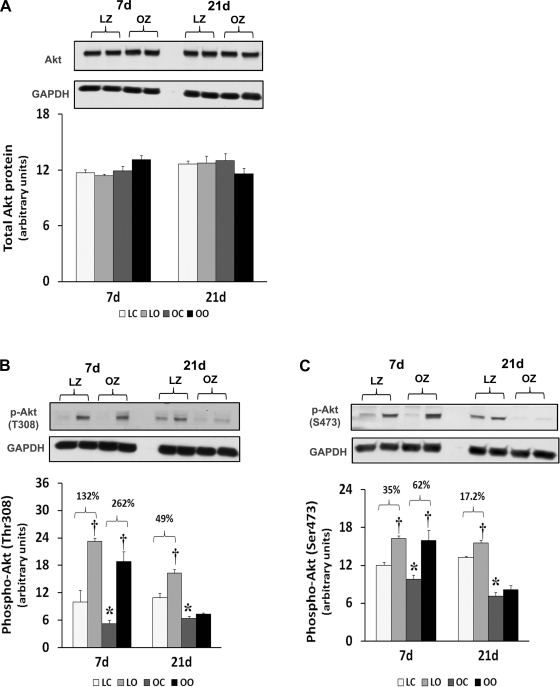
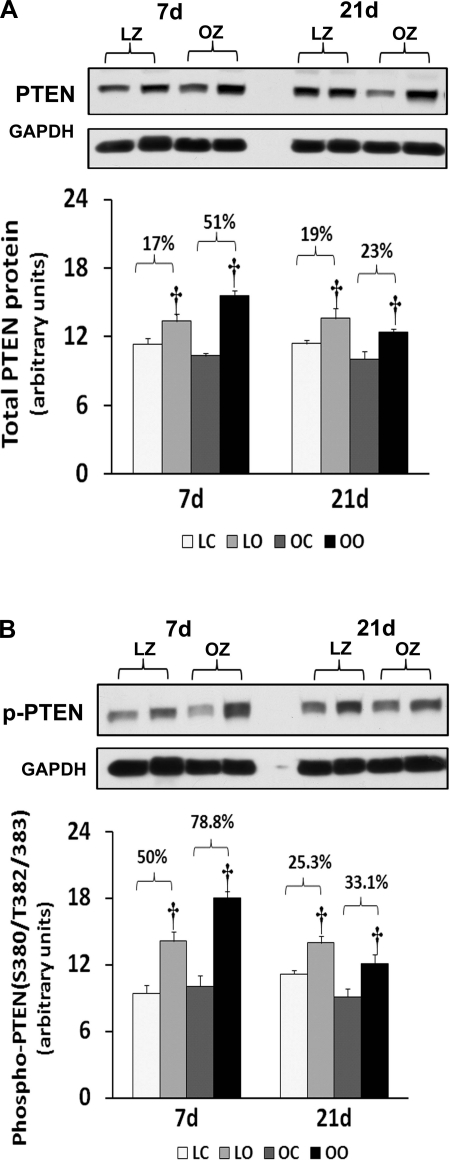
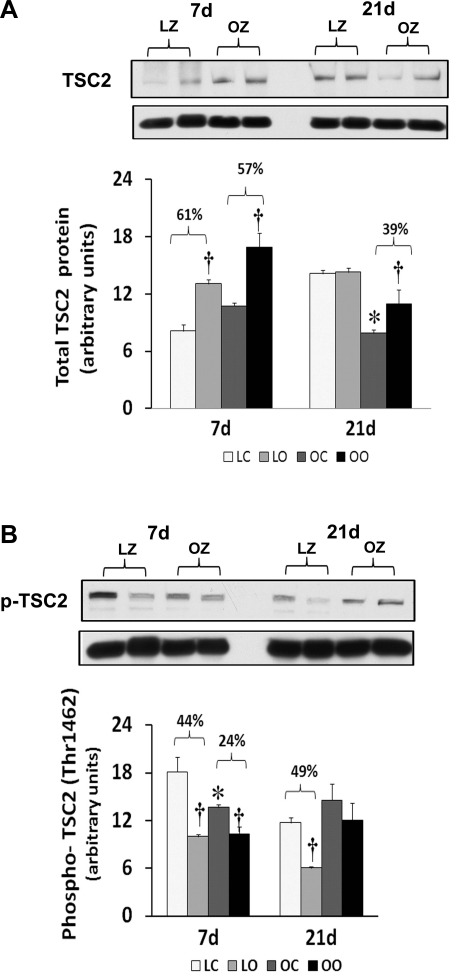
To examine the effect of insulin resistance on the activation of different mTOR regulators with overload, we compared the protein content and phosphorylation of Akt, PTEN, TSC2/Tuberin, and raptor between control and overloaded muscles. Similar to our findings for mTOR, the amount of phosphorylated Akt (Thr308) and Akt (Ser473) was increased at 7 and 21 days of overload in the LZ rats, whereas it was only elevated after 7 days of overload in the OZ rats (P < 0.05; Fig. 7). The muscle content and phosphorylation of PTEN was increased by muscle overload in the LZ and OZ animals at both 7 and 21 days (P < 0.05; Fig. 8). The protein content of Tuberin/TSC2 was higher in LZ and OZ animals after 7 days of overload (P < 0.05) and at 21 days in the OZ rats (P < 0.05; Fig. 9). The phosphorylation of Tuberin/TSC2 (Thr1462) was diminished in LZ arts at 7 and 21 days of overload and in the OZ animals after 7 days of increased loading (P < 0.05; Fig. 9). Muscle loading did not alter the expression of raptor in either the LZ or OZ animals (Supplemental Fig. 2).
Fig. 7.
Immunoblot analysis of the protein kinase B (Akt) protein content (A), phosphorylation at Thr308 (B), and phosphorylation at Ser473 (C) in control and loaded soleus muscles of LZ and OZ rats. Data are expressed as IOD × band area and expressed in arbitrary units relative to the amount of GAPDH; n = 6. P < 0.05, Significant difference from respective LZ control muscle (*) and significantly different from contralateral control muscle (†).
Fig. 8.
Immunoblot analysis of the phosphatase and tensin homolog deleted on chromosome 10 (PTEN) protein content (A) and phosphorylation (B) at Ser380/Thr382/383 in control and loaded soleus muscles of LZ and OZ rats. Data are expressed as IOD × band area and expressed in arbitrary units relative to the amount of GAPDH; n = 6. †Significantly different from contralateral control muscle, P < 0.05.
Fig. 9.
Immunoblot analysis of the Tuberin/TSC2 protein content (A) and phosphorylation (B) at Thr1462 in control and loaded soleus muscles of LZ and OZ rats. Data are expressed as IOD × band area and expressed in arbitrary units relative to the amount of GAPDH; n = 6. P < 0.05, significant difference from respective LZ control muscle (*) and significantly different from contralateral control muscle (†).
Overload did not alter expression of myogenic regulatory factors.
Given the potential role that myogenic regulatory factors may play in the regulation of satellite activation and muscle hypertrophy (17, 34), we next examined the regulation of myogenin and myogenic differentiation 1 (myoD) with overload. Overload of the soleus muscles did not alter the myogenin and myoD expression in either the LZ or OZ rats (Supplemental Fig. 3).
DISCUSSION
Previous work by our laboratory has demonstrated that the degree of soleus muscle hypertrophy following 8 wk of compensatory overload appears to be blunted in the insulin-resistant OZ rat compared with its lean counterpart (33). Here we examine the time course of muscle growth and the activation of mTOR and mTOR-related signaling at 1 and 3 wk of overload in an effort to better understand why muscle hypertrophy may be diminished in the OZ rat. Our data suggest that insulin resistance may affect the ability of slow muscle to maintain activation of mTOR-related signaling after the 1st wk of loading.
mTOR has been suggested to be an important regulator of muscle growth, since studies showing inhibition of mTOR by the drug rapamycin almost completely inhibit the hypertrophic response (5). Here we demonstrated that the phosphorylation (activation) of mTOR appears to be similar after 1 wk of overload but significantly less in the overloaded OZ rat compared with the LZ rat after 3 wk of overload (Fig. 2). This latter finding is consistent with our data demonstrating that the insulin-resistant soleus exhibits a reduced ability to undergo hypertrophy following 8 wk of mechanical overload (33). To examine how this defect in mTOR signaling might affect the regulation of molecules thought to be involved in controlling protein translation, we next examined how insulin resistance affected the phosphorylation of 4E-BP1 and p70S6k in response to increased muscle loading. As expected from our mTOR data, the phosphorylation of the mTOR substrates 4E-BP1 and p70S6k was significantly less in the OZ rat compared with that observed in the LZ rat (Figs. 3 and 6). How these differences in the activation (phosphorylation) of 4E-BP1 and p70S6k may affect the hypertrophic response of the insulin-resistant soleus is currently unclear; however, other work has demonstrated convincingly that the phosphorylation of these molecules is highly correlated with the degree of muscle hypertrophy (2, 12). The underlying molecular mechanisms for these alterations remain unclear. However, it is interesting to note that other studies have demonstrated that the phosphorylation of p70S6k in response to insulin (11, 13, 26) and increased muscle loading (19) may be altered in the diabetic rat model.
To confirm these data, we also examined the regulation of rpS6, which is a substrate of p70s6k (24). It has been shown that phosphorylation of rpS6 by p70S6k correlates with an increase in translation, particularly of mRNAs with an oligopyrimidine tract in their 5′-untranslated regions (35). Consistent with our findings for p70S6k, we found that the degree of rpS6 phosphorylation at Ser235/236 following 3 wk of overload was diminished in the OZ compared with their lean counterparts (Fig. 4). Furthermore, we examined the regulation of eEF2, which is a GTP-binding protein that functions to repress the translocation step of elongation when in its nonphosphorylated state (8). We found similar changes in the expression and phosphorylation of eEF2 following overload in both lean and obese animals (Fig. 5). These data suggest that the attenuation of hypertrophy in insulin-resistant muscle may not be because of differences in the regulation of the elongation phase of the protein translation process.
Like mTOR and p70S6k, the activation of protein kinase B/Akt is thought to be required for muscle hypertrophy, since the overexpression of a constitutively active Akt results in increased p70S6k phosphorylation, glycogen accumulation, and muscle fiber hypertrophy (9). Previous data have demonstrated that phosphorylation of serine and threonine residues within the carboxyl terminal hydrophobic domain (Ser473) and catalytic domain (Thr308) is necessary for full activation of Akt kinase activity (1). Compared with that seen in the LZ, the ability of the soleus to activate (phosphorylation at both Ser473 and Thr308) Akt in the OZ appears to be diminished (Fig. 7). How this might affect the activation of other signaling molecules is currently unclear; however, it is likely that Akt can influence the activity of mTOR through its ability to phosphorylate the product of the tuberous sclerosis complex TSC2 gene, also termed tuberin. Tuberin is a tumor suppressor that inhibits mTOR when unphosphorylated and is involved in the regulation of cell proliferation and tumor development (16, 36). Here we demonstrate that the Akt-dependent phosphorylation of tuberin (Thr1462) is diminished in the LZ rat while it is unaltered in the OZ rat following 3 wk of overload (Fig. 9). Because decreased tuberin phosphorylation should lead to a decrease in mTOR activity, it is likely that the differences in mTOR phosphorylation we see between models is not because of alterations with TSC2 regulation. Similar to tuberin, raptor is also thought to interact with mTOR where it acts to increase the phosphorylation of p70S6k and 4E-BP1 (31). Unlike tuberin, we did not observe any difference in the amount of raptor between models or with overload (Supplemental Fig. 1), suggesting that the attenuation of mTOR activity in insulin-resistant muscle may not be because of differences in raptor regulation.
The activity of PI 3-kinase/Akt/mTOR signaling is thought to be negatively regulated by the tumor suppressor protein PTEN (42). Like our findings for raptor, we found similar increases in the amount of PTEN phosphorylation following overload in both the lean and obese rats (Fig. 8). This finding is quite interesting, since it suggests that PTEN is unlikely to play a role in explaining why insulin-resistant muscle exhibits differences in its ability to activate Akt and mTOR following increased muscle loading. Why the magnitude of load-induced mTOR signaling may differ with insulin resistance is not clear. In addition to Akt, raptor, and TSC2, the activity of mTOR is also influenced by a myriad of other molecules, including AMP-activated protein kinase (AMPK), rictor, regulated in development and DNA damage response 2, phospholipase D, and possibly others (3, 10, 15, 25, 27, 32). Recent in vitro and in vivo data have suggested that AMPK may inhibit protein synthesis through its ability to suppress mTOR activation (5, 6, 41). Consistent with this finding, work by Thomson and Gordon (39) has demonstrated that the diminished overload-induced hypertrophy seen in aged skeletal muscle is associated with AMPK hyperphosphorylation. Further experiments to investigate whether a similar relationship between AMPK activation and the degree of muscle growth is present in insulin-resistant muscle will likely add to our understanding of what role this molecule may play in modulating muscle growth. In an effort to explore other possible mechanisms for the attenuated hypertrophy we observe in the OZ animals, we next examined if muscle overload was associated with alterations in the amount of myogenic regulatory factors MyoD and myogenin, which have been posited to be involved in regulating satellite cell activation. Consistent with previous work examining the myogenin and myoD levels in rat soleus muscle after 4 wk of surgical overload (28), we observed no changes in the amount of myogenin and myoD with overload in either the LZ and OZ animals (Supplemental Fig. 3). It is also possible that differences in the degree of animal activity may also have played a role in the differential hypertrophic response between the LZ and OZ rats. Because the hypertrophy stimulus in the synergistic ablation model is dependent, at least in part, on animal activity, it is possible that the soleus muscles of the less active obese animals (7) were loaded to a lesser degree than their lean counterparts. Whether this was actually the case cannot be determined from our data. Nonetheless, it is also worthy to point out that the greater body mass of the OZ rats likely produced a greater overload stimulus for muscle growth on the weight-bearing muscles. To address these possibilities, future studies employing other animal models that do not differ in their amount of activity or body weight may be warranted.
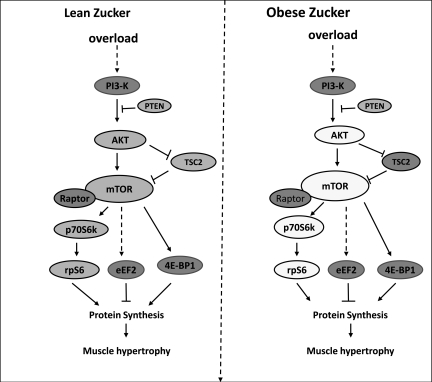
In summary, the data of the present study suggest that insulin resistance may be associated with a decrease in the ability of the soleus muscle to undergo muscle hypertrophy and that this finding may be related to differences in mTOR, p70S6k, Akt, and rpS6 signaling (Fig. 10). These findings are novel, since they are the first to demonstrate impaired mTOR-related signaling in direct conjunction with attenuated overload-induced hypertrophy in insulin-resistant skeletal muscle. Additional studies designed to directly inhibit or activate these signaling molecules, as well as to explore the other possible mechanism(s), e.g., AMPK signaling during muscle adaptation, will be needed to increase our understanding of the exact mechanism(s) involved and the clinical ramifications for an ever-increasing diabetic population.
Fig. 10.
Schematic summarizing the differences in load-induced signaling between the lean and obese Zucker rats after 21 days of overload. Molecules shown in the dark-shaded, medium-shaded, and empty circles represent no change, complete activation or inactivation, and differences in activation between animal models, respectively. Impaired hypertrophy in obese Zucker rats is associated with an attenuated activation of Akt, mTOR, p70S6k, and rpS6.
GRANTS
This study was supported by National Institute on Aging Grant AG-027103-1 to E. R. Blough.
DISCLOSURES
No conflicts of interest are declared by the authors.
Supplementary Material
REFERENCES
- 1.Alessi DR, James SR, Downes CP, Holmes AB, Gaffney PR, Reese CB, Cohen P. Characterization of a 3-phosphoinositide-dependent protein kinase which phosphorylates and activates protein kinase Balpha. Curr Biol 7: 261–269, 1997 [DOI] [PubMed] [Google Scholar]
- 2.Baar K, Esser K. Phosphorylation of p70(S6k) correlates with increased skeletal muscle mass following resistance exercise. Am J Physiol Cell Physiol 276: C120–C127, 1999 [DOI] [PubMed] [Google Scholar]
- 3.Balasubramanian S, Johnston RK, Moschella PC, Mani SK, Tuxworth WJ, Jr, Kuppuswamy D. mTOR in growth and protection of hypertrophying myocardium. Cardiovasc Hematol Agents Med Chem 7: 52–63, 2009 [DOI] [PMC free article] [PubMed] [Google Scholar]
- 4.Blough ER, Linderman JK. Lack of skeletal muscle hypertrophy in very aged male Fischer 344 × Brown Norway rats. J Appl Physiol 88: 1265–1270, 2000 [DOI] [PubMed] [Google Scholar]
- 5.Bodine SC, Stitt TN, Gonzalez M, Kline WO, Stover GL, Bauerlein R, Zlotchenko E, Scrimgeour A, Lawrence JC, Glass DJ, Yancopoulos GD. Akt/mTOR pathway is a crucial regulator of skeletal muscle hypertrophy and can prevent muscle atrophy in vivo. Nat Cell Biol 3: 1014–1019, 2001 [DOI] [PubMed] [Google Scholar]
- 6.Bolster DR, Crozier SJ, Kimball SR, Jefferson LS. AMP-activated protein kinase suppresses protein synthesis in rat skeletal muscle through down-regulated mammalian target of rapamycin (mTOR) signaling. J Biol Chem 277: 23977–23980, 2002 [DOI] [PubMed] [Google Scholar]
- 7.Bray GA. The Zucker-fatty rat: a review. Fed Proc 36: 148–153, 1977 [PubMed] [Google Scholar]
- 8.Chan AY, Soltys CL, Young ME, Proud CG, Dyck JR. Activation of AMP-activated protein kinase inhibits protein synthesis associated with hypertrophy in the cardiac myocyte. J Biol Chem 279: 32771–32779, 2004 [DOI] [PubMed] [Google Scholar]
- 9.Cleasby ME, Reinten TA, Cooney GJ, James DE, Kraegen EW. Functional studies of Akt isoform specificity in skeletal muscle in vivo; maintained insulin sensitivity despite reduced insulin receptor substrate-1 expression. Mol Endocrinol 21: 215–228, 2007 [DOI] [PubMed] [Google Scholar]
- 10.Das F, Ghosh-Choudhury N, Mahimainathan L, Venkatesan B, Feliers D, Riley DJ, Kasinath BS, Choudhury GG. Raptor-rictor axis in TGFbeta-induced protein synthesis. Cell Signal 20: 409–423, 2008 [DOI] [PubMed] [Google Scholar]
- 11.Fluckey JD, Pohnert SC, Boyd SG, Cortright RN, Trappe TA, Dohm GL. Insulin stimulation of muscle protein synthesis in obese Zucker rats is not via a rapamycin-sensitive pathway. Am J Physiol Endocrinol Metab 279: E182–E187, 2000 [DOI] [PubMed] [Google Scholar]
- 12.Gingras AC, Gygi SP, Raught B, Polakiewicz RD, Abraham RT, Hoekstra MF, Aebersold R, Sonenberg N. Regulation of 4E-BP1 phosphorylation: a novel two-step mechanism. Genes Dev 13: 1422–1437, 1999 [DOI] [PMC free article] [PubMed] [Google Scholar]
- 13.Hei YJ, Chen X, Pelech SL, Diamond J, McNeill JH. Skeletal muscle mitogen-activated protein kinases and ribosomal S6 kinases. Suppression in chronic diabetic rats and reversal by vanadium. Diabetes 44: 1147–1155, 1995. [DOI] [PubMed] [Google Scholar]
- 14.Hernandez-Alvarez MI, Thabit H, Burns N, Shah S, Brema I, Hatunic M, Finucane F, Liesa M, Chiellini C, Naon D, Zorzano A, Nolan JJ. Subjects with early-onset type 2 diabetes show defective activation of the skeletal muscle PGC-1α/Mitofusin-2 regulatory pathway in response to physical activity. Diabetes Care 33: 645–651 [DOI] [PMC free article] [PubMed] [Google Scholar]
- 15.Hornberger TA, Chu WK, Mak YW, Hsiung JW, Huang SA, Chien S. The role of phospholipase D and phosphatidic acid in the mechanical activation of mTOR signaling in skeletal muscle. Proc Natl Acad Sci USA 103: 4741–4746, 2006 [DOI] [PMC free article] [PubMed] [Google Scholar]
- 16.Inoki K, Li Y, Zhu T, Wu J, Guan KL. TSC2 is phosphorylated and inhibited by Akt and suppresses mTOR signalling. Nat Cell Biol 4: 648–657, 2002 [DOI] [PubMed] [Google Scholar]
- 17.Ishido M, Kami K, Masuhara M. Localization of MyoD, myogenin and cell cycle regulatory factors in hypertrophying rat skeletal muscles. Acta Physiol Scand 180: 281–289, 2004 [DOI] [PubMed] [Google Scholar]
- 18.Kahn BB, Myers MG., Jr mTOR tells the brain that the body is hungry. Nat Med 12: 615–617, 2006 [DOI] [PubMed] [Google Scholar]
- 19.Katta A, Karkala SK, Wu M, Meduru S, Desai DH, Rice KM, Blough ER. Lean and obese Zucker rats exhibit different patterns of p70s6 kinase regulation in the tibialis anterior muscle in response to high-force muscle contraction. Muscle Nerve 39: 503–511, 2009 [DOI] [PMC free article] [PubMed] [Google Scholar]
- 20.Katta A, Preston DL, Karkala SK, Asano S, Meduru S, Mupparaju SP, Yokochi E, Rice KM, Desai DH, Blough ER. Diabetes alters contraction-induced mitogen activated protein kinase activation in the rat soleus and plantaris (Abstract). Exp Diabetes Res 2008: 738101, 2008 [DOI] [PMC free article] [PubMed] [Google Scholar]
- 21.Kim DH, Sarbassov DD, Ali SM, King JE, Latek RR, Erdjument-Bromage H, Tempst P, Sabatini DM. mTOR interacts with raptor to form a nutrient-sensitive complex that signals to the cell growth machinery. Cell 110: 163–175, 2002 [DOI] [PubMed] [Google Scholar]
- 22.Kimball SR, Farrell PA, Jefferson LS. Invited Review: Role of insulin in translational control of protein synthesis in skeletal muscle by amino acids or exercise. J Appl Physiol 93: 1168–1180, 2002 [DOI] [PubMed] [Google Scholar]
- 23.Kimball SR, Horetsky RL, Jefferson LS. Signal transduction pathways involved in the regulation of protein synthesis by insulin in L6 myoblasts. Am J Physiol Cell Physiol 274: C221–C228, 1998 [DOI] [PubMed] [Google Scholar]
- 24.Kleijn M, Scheper GC, Voorma HO, Thomas AA. Regulation of translation initiation factors by signal transduction. Eur J Biochem 253: 531–544, 1998 [DOI] [PubMed] [Google Scholar]
- 25.Lamas L, Aoki MS, Ugrinowitsch C, Campos GE, Regazzini M, Moriscot AS, Tricoli V. Expression of genes related to muscle plasticity after strength and power training regimens. Scand J Med Sci Sports 20: 216–225, 2010 [DOI] [PubMed] [Google Scholar]
- 26.Markuns JF, Napoli R, Hirshman MF, Davalli AM, Cheatham B, Goodyear LJ. Effects of streptozocin-induced diabetes and islet cell transplantation on insulin signaling in rat skeletal muscle. Endocrinology 140: 106–111, 1999 [DOI] [PubMed] [Google Scholar]
- 27.Miyazaki M, Esser KA. REDD2 is enriched in skeletal muscle and inhibits mTOR signaling in response to leucine and stretch. Am J Physiol Cell Physiol 296: C583–C592, 2009 [DOI] [PMC free article] [PubMed] [Google Scholar]
- 28.Mozdziak PE, Greaser ML, Schultz E. Myogenin, MyoD, and myosin expression after pharmacologically and surgically induced hypertrophy. J Appl Physiol 84: 1359–1364, 1998 [DOI] [PubMed] [Google Scholar]
- 29.Nader GA, Esser KA. Intracellular signaling specificity in skeletal muscle in response to different modes of exercise. J Appl Physiol 90: 1936–1942, 2001 [DOI] [PubMed] [Google Scholar]
- 30.Nader GA, Hornberger TA, Esser KA. Translational control: implications for skeletal muscle hypertrophy. Clin Orthop 403: S178–S187, 2002 [DOI] [PubMed] [Google Scholar]
- 31.Nojima H, Tokunaga C, Eguchi S, Oshiro N, Hidayat S, Yoshino K, Hara K, Tanaka N, Avruch J, Yonezawa K. The mammalian target of rapamycin (mTOR) partner, raptor, binds the mTOR substrates p70 S6 kinase and 4E-BP1 through their TOR signaling (TOS) motif. J Biol Chem 278: 15461–15464, 2003 [DOI] [PubMed] [Google Scholar]
- 32.O'Neil TK, Duffy LR, Frey JW, Hornberger TA. The role of phosphoinositide 3-kinase and phosphatidic acid in the regulation of mammalian target of rapamycin following eccentric contractions. J Physiol 587: 3691–3701, 2009 [DOI] [PMC free article] [PubMed] [Google Scholar]
- 33.Paturi S, Gutta AK, Kakarla SK, Katta A, Arnold EC, Wu M, Rice KM, Blough ER. Impaired overload-induced hypertrophy in Obese Zucker rat slow-twitch skeletal muscle. J Appl Physiol 108: 7–13, 2010 [DOI] [PubMed] [Google Scholar]
- 34.Peterson JM, Bryner RW, Alway SE. Satellite cell proliferation is reduced in muscles of obese Zucker rats but restored with loading. Am J Physiol Cell Physiol 295: C521–C528, 2008 [DOI] [PMC free article] [PubMed] [Google Scholar]
- 35.Peterson RT, Schreiber SL. Translation control: connecting mitogens and the ribosome. Curr Biol 8: R248–R250, 1998 [DOI] [PubMed] [Google Scholar]
- 36.Potter CJ, Pedraza LG, Xu T. Akt regulates growth by directly phosphorylating Tsc2. Nat Cell Biol 4: 658–665, 2002 [DOI] [PubMed] [Google Scholar]
- 37.Sakamoto K, Hirshman MF, Aschenbach WG, Goodyear LJ. Contraction regulation of Akt in rat skeletal muscle. J Biol Chem 277: 11910–11917, 2002 [DOI] [PubMed] [Google Scholar]
- 38.Schmelzle T, Hall MN. TOR, a central controller of cell growth. Cell 103: 253–262, 2000 [DOI] [PubMed] [Google Scholar]
- 39.Thomson DM, Gordon SE. Diminished overload-induced hypertrophy in aged fast-twitch skeletal muscle is associated with AMPK hyperphosphorylation. J Appl Physiol 98: 557–564, 2005 [DOI] [PubMed] [Google Scholar]
- 40.Tipton KD, Wolfe RR. Exercise, protein metabolism, and muscle growth. Int J Sport Nutr Exerc Metab 11: 109–132, 2001 [DOI] [PubMed] [Google Scholar]
- 41.Wullschleger S, Loewith R, Hall MN. TOR signaling in growth and metabolism. Cell 124: 471–484, 2006 [DOI] [PubMed] [Google Scholar]
- 42.Yamada KM, Araki M. Tumor suppressor PTEN: modulator of cell signaling, growth, migration and apoptosis. J Cell Sci 114: 2375–2382, 2001 [DOI] [PubMed] [Google Scholar]
- 43.Zucker LM. Fat mobilization in vitro and in vivo in the genetically obese Zucker rat “fatty”. J Lipid Res 13: 234–243, 1972 [PubMed] [Google Scholar]
Associated Data
This section collects any data citations, data availability statements, or supplementary materials included in this article.


