

Abstract
A variety of studies have demonstrated enhanced blood oxygenation level dependent responses to auditory and tactile stimuli within occipital cortex as a result of early blindness. However, little is known about the organizational principles that drive this cross-modal plasticity. We compared BOLD responses to a wide variety of auditory and tactile tasks (vs. rest) in early-blind and sighted subjects. As expected, cross-modal responses were larger in blind than in sighted subjects in occipital cortex for all tasks (cross-modal plasticity). Within both blind and sighted subject groups, we found patterns of cross-modal activity that were remarkably similar across tasks: a large proportion of cross-modal responses within occipital cortex are neither task nor stimulus specific. We next examined the mechanisms underlying enhanced BOLD responses within early-blind subjects. We found that the enhancement of cross-modal responses due to early blindness was best described as an additive shift, suggesting that cross-modal plasticity within blind subjects does not originate from either a scaling or unmasking of cross-modal responsivities found in sighted subjects.
INTRODUCTION
A number of studies have demonstrated benefits in behavioral performance and/or enhancement of auditory and tactile responses—“cross-modal plasticity”—in the occipital cortex of blind subjects across a wide range of tasks. For example, within the auditory domain, cross-modal plasticity as a result of blindness has been demonstrated for auditory motion discrimination (Poirier et al. 2006; Saenz et al. 2008), localization (Collignon et al. 2009; Gougoux et al. 2005; Kujala et al. 1992; Leclerc et al. 2000; Voss et al. 2004; Weeks et al. 2000), pitch-change discrimination (Kujala et al. 1997, 2005), and language processing (Amedi et al. 2003; Burton and McLaren 2006; Burton et al. 2002, 2003), among other tasks. Similarly, in the tactile domain, cross-modal plasticity has been demonstrated for the discrimination of simple tactile stimuli (Alary et al. 2009; Goldreich and Kanics 2003, 2006; Van Boven et al. 2000), tactile motion (Ricciardi et al. 2007), three-dimensional (3D) tactile shape and pattern perception (Amedi et al. 2001; Cattaneo et al. 2008; Heller 1989; Heller et al. 1996a,b; Postma et al. 2007; Shimizu et al. 1993; for review see Cattaneo et al. 2008), tactile working memory (Bonino et al. 2008), and Braille reading (Cohen et al. 1997, 1999; Hamilton and Pascual-Leone 1998; Hamilton et al. 2000; Kupers et al. 2007; Liu et al. 2007).
Cross-modal plasticity in blind subjects has been shown to be influenced by the normal visual function of a given area. Visual motion area MT+ shows motion-specific auditory responses in sight recovery and early-blind subjects and tactile motion responses within early-blind subjects (Ricciardi et al. 2007; Saenz et al. 2008). Mahon et al. (2009) showed that overlapping regions of medial ventral occipital cortex show stronger responses while performing a size task for nonliving versus living objects using picture stimuli in sighted subjects and auditory words in the early-blind subjects. The opposite (living > nonliving) pattern of overlapping category preferences between sighted and early-blind subjects was found within a very small region in left lateral occipital cortex. This group also compared cross-modal responses in blind and sighted subjects, as described later in this introduction.
Until recently, it was generally assumed that occipital cortex responses within normally sighted subjects were driven exclusively by vision. However, in recent years it has become clear that occipital cortical responses are modulated by auditory and tactile stimuli even within sighted individuals. For example, lateral occipital cortex can show substantial activation during the tactile recognition of objects by blindfolded sighted individuals (Amedi et al. 2001, 2002; James et al. 2002). Even primary visual cortex can be activated (Merabet et al. 2007) or modulated by information from other senses, especially when this information is congruent with visual stimulation (Calvert et al. 1999; James et al. 2002; Macaluso et al. 2000; Merabet et al. 2007; Shams et al. 2001, 2005; Watkins et al. 2006; for review see Amedi et al. 2005).
It has been suggested by Pascual-Leone and Hamilton (2001) that cross-modal plasticity as a result of short- or long-term visual deprivation may be due to enhancement of existing cross-modal responses that are normally masked by visual input. In support of this, short-term (hours/days) visual deprivation results in enhanced cross-modal responses to tactile and auditory stimuli within the occipital cortex of sighted subjects. Normally sighted subjects that have been briefly blindfolded show both positive and negative occipital responses to tactile tasks (Merabet et al. 2007) and more prolonged blindfolding (5 days) of sighted subjects results in an increase in blood oxygenation level dependent (BOLD) responses to a Braille discrimination task (Merabet et al. 2008). These changes in BOLD response seem to have functional significance: short-term deprived blindfolded subjects perform better than nonblindfolded control subjects in a Braille character-discrimination task (Kauffman et al. 2002) and Braille performance for blindfolded subjects is disrupted by occipital repetitive transcranial magnetic stimulation (Merabet et al. 2008). However, the location of these cross-modal responses within sighted blindfolded subjects has not yet been compared with cross-modal responses within early-blind subjects, making it unclear whether there is a relationship between the cross-modal responses found as a result of short-term blindfolding in adults and the much stronger cross-modal responses that result from prolonged blindness, especially when it occurs early in life.
A few studies have compared response patterns for auditory/tactile stimuli within sighted and early-blind individuals. Auditory (Poirier et al. 2005) and tactile (Ricciardi et al. 2007) motion responses have been reported within an area identified as MT+ in sighted subjects. However, using a region of interest (ROI) approach across individual subjects, Saenz et al. (2008) found that apparent auditory motion responses within MT+ (as found by Poirier et al. 2005) were an artifact of group averaging and that within individual sighted subjects auditory motion responses were in fact restricted to an adjacent nonvisual area that did not overlap with MT+. The location of the tactile motion responses found within sighted subjects by Ricciardi et al. (2007) (who also used a group averaging approach) suggests that a similar mislocalization may have occurred; thus it remains unclear whether tactile-motion responses overlap with MT+ within individual sighted subjects. Mahon et al. (2009) compared responses to size judgments using auditory stimuli in sighted and early-blind subjects. A region within an area of medial ventral occipital cortex previously associated with tactile object recognition within both sighted and blind subjects (Pietrini et al. 2004) showed less suppression for nonliving than for living objects in sighted subjects and more activation for nonliving than for living objects in early-blind subjects. Similarly a very small ROI within left lateral occipital cortex showed less suppression for living than that for nonliving objects in sighted subjects and more activation for living than that for nonliving objects in early-blind subjects. Thus a similar distribution of responses as a function of stimulus category was found for this auditory task within sighted and early-blind subjects. However, it is worth noting that the double dissociation between living versus nonliving responses (on which their argument for shared category specificity between early-blind and sighted subjects rests) relied on a very small living > nonliving ROI in the left hemisphere, defined using a low-threshold false discovery rate [q(FDR) <0.05] and the change in response to living/nonliving categories reported along the medial to lateral direction may primarily reflect a general reduction in response to both living and nonliving categories rather than a change in selectivity.
Here we further examine how cross-modal plasticity in early-blind subjects is related to the cross-modal responses that exist within the occipital cortex of normally sighted individuals. A variety of models of cross-modal plasticity are plausible, with different predictions for whether the pattern of responses found as a result of early blindness should resemble sighted cross-modal responses. For example, a simple “scaling” hypothesis would be that cross-modal plasticity in early-blind subjects is driven by a (e.g., multiplicative) scaling of the cross-modal responses that exist within sighted subjects. According to this model it is those regions that show reasonably strong cross-modal responses in sighted individuals that would be expected to show a further enhancement of response within early-blind subjects, whereas the responses of regions that show weak or negative cross-modal responses would remain unenhanced.
A second “suppression unmasking” or “homeostatic regulation of neural sensitivity” hypothesis makes the opposite prediction: the largest amount of plasticity should be found within those areas that show the weakest cross-modal response in sighted subjects. According to a suppression unmasking hypothesis, all regions have “latent” cross-modal responses that vary in the extent to which they are suppressed by vision. Regions that are most suppressed (i.e., show the weakest cross-modal responses in sighted subjects) will show the largest enhancement of response as a result of loss of visual input. The homeostatic regulation of neural sensitivity interpretation of this explanation makes a similar prediction: more purely visual areas suffer a greater loss of afferent input, which in turn leads to a greater shift in sensitivity that “amplifies” preexisting cross-modal responses. At the neuronal level it has been shown that synaptic strengths are globally scaled up or down as a result of short- or long-term deprivation to stabilize firing rates within the visual cortex (Carmignoto and Vicini 1992; Desai et al. 2002; Gu 2003; Herrero et al. 2008; Kirkwood et al. 1996; Morales et al. 2002; Tropeat et al. 2009).
Finally, it is possible that cross-modal plasticity as a result of early blindness is the result of processes very different from those that govern cross-modal responses in sighted or temporarily blindfolded subjects. As described earlier, there is evidence that early blindness leads to the development of cross-modal responses that seem analogous to the normal visual functional specialization of that cortical region (Mahon et al. 2009; Pietrini et al. 2004; Ricciardi et al. 2007; Saenz et al. 2008). It is also possible that cross-modal plasticity as a result of early blindness is mediated by different patterns of anatomical connectivity (Ghazanfar and Schroeder 2006). In normally sighted infant animals, there are connections from auditory/temporal areas to visual cortex (Dehay et al. 1984, 1988; Ghazanfar and Schroeder 2006; Innocenti and Clarke 1984; Innocenti et al. 1988) and from somatosensory and frontoparietal cortex to visual cortex (Clarke and Innocenti 1986). During normal visual development a large proportion of these cross-modal connections are “pruned” (Innocenti and Clarke 1984; Rodman and Consuelos 1994). However, reduced visual experience may lead to abnormal pruning, such that excess connectivity remains between areas that usually subserve different modalities: in the bilaterally enucleated opossum abnormal connections projecting to visual cortex have been noted from both the auditory and somatosensory thalamus (Kahn and Krubitzer 2002; Karlen et al. 2006) as well as from auditory and somatosensory cortex (Kahn and Krubitzer 2002; Karlen et al. 2006). If cross-modal plasticity is determined by patterns of anatomical connectivity that differ substantially from those found in sighted subjects, then cross-modal responses in early-blind subjects might not be systematically related to the occipital cross-modal responses found in sighted subjects.
Because we were interested in the effects of loss of visual input rather than the cognitive demands of being blind, we limited our analysis to the occipital lobe. Although extensive cross-modal plasticity has been found outside the occipital cortex, within parietal (Bonino et al. 2008; Ricciardi et al. 2006; Sadato et al. 1998; Vanlierde et al. 2003), temporal (Burton et al. 2006; Noppeney et al. 2003), and frontal cortices (Noppeney et al. 2003; Sadato et al. 1998), it seems likely that much of the plasticity within these multimodal or auditory/language areas is driven by the cognitive demands of being blind, such as increased reliance on auditory and tactile information and increased memory demands, rather than the loss of visual input per se.
Within occipital cortex, we compared BOLD responses to a wide variety of auditory and tactile tasks across early-blind and normally sighted subjects to determine whether those regions that showed the greatest enhancement of response within blind subjects were those that showed strong or weak cross-modal responses in sighted subjects. Within both blind and sighted subject groups, we found patterns of cross-modal activity that were remarkably similar across tasks: a large proportion of cross-modal responsivity within occipital cortex was not task-specific. We also found that the enhancement of responses as a result of early blindness were best described as an additive shift, suggesting that cross-modal plasticity within blind subjects does not originate from either a scaling or an unmasking of cross-modal responsivities found in sighted subjects.
METHODS
Subjects
This study included seven early-blind subjects (EB: age range: 32–56 yr, mean = 47.0 yr, SE = 3.3 yr; four men; five right-handed) and six normally sighted control subjects (C: age range: 26–55 yr, mean = 36.3 yr, SE = 4.3 yr; three men; five right-handed). Details of blind subjects can be found in Table 1. All sighted subjects had normal or corrected-to-normal vision. All subjects reported no neurological or psychiatric problems and no current use of any psychoactive medications. No screening was carried out for endocrinological disorders, hypertension, or other medications.
Table 1.
Details of blind subjects
| Gender | Age, yr | Age of Blindness Onset | Handedness | Reason for Blindness | Full-term or Premature | Visual Acuity |
|---|---|---|---|---|---|---|
| M | 32 | Birth | Right | Leber's disease | Full-term | LP |
| F | 38 | Birth | Right | ROP | Premature, 2 mo | LP |
| F | 48 | Birth | Left | Anophthalmia (RE), microphthalmia (LE) | Full-term | NLP |
| M | 54 | Birth | Left | ROP | Premature, 1.75 mo | NLP/LP |
| M | 50 | 0–18 mo | Right | Retinoblastoma, enucleation at 12–18 mo | Full-term | NLP |
| M | 56 | 6 mo | Right | Fever, 6 mo | Full-term | NLP |
| F | 51 | Birth | Right | ROP | Premature, 2.5 mo | NLP/LP |
NLP, no light perception; LP, light perception; ROP, retinopathy of prematurity.
All subjects gave written, informed consent. Data from one additional sighted control subject were excluded from analysis due to significant head motion artifacts. Experimental procedures were approved by the California Institute of Technology Committee for the Protection of Human Subjects and the University of California, San Diego Human Research Protections Program in accordance with the Code of Ethics of the World Medical Association (Declaration of Helsinki).
Magnetic resonance image scanning
BOLD functional imaging was performed with a 3 Tesla Siemens (Erlangen, Germany) TRIO scanner at California Institute of Technology (3 × 3 × 4 mm voxels; repetition time [TR], 12 s; echo time, 30; flip angle, 90°; field of view, 192; matrix size, 64 × 64; 30 slices; slice acquisition order, sequential). Slices were obliquely oriented for optimal coverage of visual, auditory, and somatosensory cortices. The first volume of every scan was discarded. Three-dimensional (3D) anatomical images were acquired using a 1 × 1 × 1 mm T1-weighted magnetization-prepared rapid gradient echo sequence.
A sparse echo planar imaging pulse sequence was used in all experiments to allow the presentation of stimuli uninterrupted by scanner noise (Hall et al. 1999). Each 2-s volume acquisition was preceded by a 10-s quiet delay (TR = 12-s) during which visual, auditory, or tactile stimuli were presented. Due to the hemodynamic delay (∼5-s to peak response; Boynton et al. 1996), each volume acquisition therefore measured the BOLD response to stimulation during the middle of the stimulus period, with relatively little contribution from the auditory noise of the previous acquisition. It is worth noting that the longer delay between acquisitions (which allows for more time to restore magnetic equilibrium) results in a higher signal-to-noise ratio for each individual acquisition, which partially compensates for the reduced number of acquisitions (Hall et al. 1999).
Stimuli and task
Each block consisted of a 10-s stimulation period followed by a 2-s data acquisition period. All trials in a given 10-s stimulation period always consisted of the same task. Tasks presented during the stimulation period included a control task (key-press), three auditory tasks (auditory letters [AL], auditory motion [AM], and auditory frequency [AF]), and three tactile tasks (tactile letters [TL], tactile animals [TA], and tactile orientation [TO]). For sighted subjects, task conditions consisted of the same control task (key-press) and six auditory and tactile tasks as blind subjects, as well as an additional four visual tasks (visual letters, visual animals, visual orientation, and visual motion) that were not included in these analyses.
All tasks consisted of a two-alternative forced choice judgment (see Fig. 1). For most tasks we used a structure containing two stimulus presentation intervals, followed by a response period. At the beginning of each response period, there was a brief auditory “click,” which was presented as a reminder to the subject that it was time to press a key.
Fig. 1.

The arrangement of trials in a 10-s stimulation period for each task. Gray shading represents the response period.
For all auditory tasks (AL, AM, and AF) and all letter tasks (AL and TL), each of the two intervals was 1 s in length and the response period was 0.5 s, for a total of four trials per 10-s stimulation period. For the TO and TA tasks, we found we had to allow more time per trial. The TO task contained a single 2-s interval and a 0.5-s response period, also resulting in a total of four trials per 10-s stimulation period. The TA task contained two 4.75-s intervals and a 0.5-s response interval, resulting in a single trial in a 10-s stimulation period. The control task (key-press) had four trials/key-presses per 10-s stimulation period.
Our goal was to choose a broad set of tasks that spanned a range between simple “low-level” discrimination tasks and more complex “object recognition” tasks, as well as including tasks (such as Braille reading) that play an important behavioral role in people who are blind. As a result, our tasks varied widely in nature, including both active “exploratory” tasks such as the TA and TL tasks and tasks where the stimuli were passively presented (note that a discrimination response was always required) such as our auditory tasks and the TO task. The timing of the tasks also differed significantly. Although some attempt was made to match difficulty across tasks and subject groups, these six tasks should in no way be considered “balanced” in terms of task demands. To ensure that subjects understood all of the tasks, every subject was given a short practice session (10–20 min) before entering the scanner, where they were given instructions and several practice trials for each of the tasks. If the subject seemed uncertain about a particular task the instructions and practice trials were repeated for that task. Tasks were informally controlled for task difficulty based on pilot data, but the nature of the tasks and the complexity of the experimental design made it impossible to run individual staircases for each subject/task and performance did differ across tasks (see Fig. 2). As a result, it is likely that attentional demands varied across tasks.
Fig. 2.

Behavioral performance for blind and sighted subjects including and excluding late/lost trials. AL, auditory letters; AM, auditory motion; AF, auditory frequency; TL, tactile letters; TA, tactile animals; TO, tactile orientation. Error bars represent SE.
Because it was technically not feasible (and would be confusing to the subject) to present all tasks within a single scan, we presented a pseudorandom subset of three tasks per scan, plus the key-press control task, for a total of four tasks per scan. These three tasks per scan could consist of any combination of auditory and tactile (or visual in the case of sighted subjects) tasks. During each scan, each sequence of four tasks was repeated eight times (each scan therefore contained 32 blocks in total, for a total scan duration of 6 min 24 s). Although it is possible that in sighted subjects a preceding visual block might affect responses within an auditory/tactile block it should be noted that our sparse design, which measures BOLD responses only within the middle of each block, probably minimized such effects.
Each task was included within six scans for each subject. For each task we therefore collected data from 48 block repetitions in total. Scan order was randomized across subjects. Subjects were typically able to complete 6–7 scans per 1-h session. Blind subjects carried out 12 scans in total across two 1-h sessions, whereas sighted subjects carried out 18–21 scans in total across three 1-h sessions (sighted subjects were required to carry out more scans because of the extra visual conditions). Because the key-press task was included in every scan, in blind subjects we collected 96 block repetitions in total for that task and in sighted subjects we collected 144–168 block repetitions in total for that task.
Stimulus presentation
Auditory stimuli were generated using MATLAB (The MathWorks, Natick, MA) and Psychophysics Toolbox (www.psychtoolbox.org) (Brainard 1997; Pelli 1997) and were delivered to the subject via MRI-compatible stereo headphones (MRCONFON). A separate computer used MATLAB to deliver auditory cues to an experimenter's headphones; these auditory cues cued the experimenter for presenting tactile stimuli (i.e., when to present and withdraw each tactile stimulus).
KEY-PRESS TASK.
The key-press task was included as a baseline to which other tasks could be compared. This stimulus contained no task or stimulus besides key-pressing timed to match most of the other tasks in the study. After 2-s of no auditory or tactile stimulation, the standard “click” sound was presented and subjects had a 0.5-s response period during which to press a key. Subjects were asked to alternate between pressing each of the two possible response keys across the four trials within each 10-s block.
AUDITORY TASKS.
There were three auditory tasks: “auditory letters” (AL), “auditory motion” (AM), and “auditory frequency” (AF). The AL stimulus consisted of two sets of three letters (trigrams), produced via a computer-generated voice that orally pronounced sets of letters. Each set of letters was randomly generated from the alphabet (excluding the letter “O”), with the exception of one letter in either the first or second set of letters, which was randomly selected and replaced with the target letter “O.” In each AL trial, each set of letters was presented for a duration of 1-s and both sets of letters were followed by a 0.5-s response period (for a total of 2.5 s per trial, with four trials per 10 s stimulus block). The subject's task was to indicate via key-press whether the letter “O” was contained in the first or second set of letters.
The AM stimulus was created by linearly ramping (between 0 and maximum [max] intensity) the volume of a 600-Hz tone in opposite directions between the left and right speakers, creating the vivid percept of a sound source moving horizontally from one side of the head to the other. Maximum auditory intensity was about 50 dB and was adjusted to a comfortable level for individual subjects. In each AM trial, this stimulus was presented twice, for a duration of 1-s per presentation, and both presentations were followed by a 0.5-s response period (for a total of 2.5-s per trial, with four trials per 10-s stimulus block). For a given presentation, the direction of auditory motion was equally likely to be from left to right or from right to left. Subjects performed a “same–different” task, indicating via key-press whether the auditory motion was in the same direction during both presentations or in different directions.
The AF stimulus was a 580-, 600-, or 620-Hz tone with equal intensity (0.5 of max intensity) in the two speakers, creating the percept of a centrally located stationary sound source. In each AF trial, this stimulus was presented twice, for a duration of 0.9-s per presentation, with an interstimulus interval of 0.2-s and both presentations were followed by a 0.5-s response period (for a total of 2.5-s per trial, with four trials per 10-s stimulus block). For a given set of presentations, the frequency of the auditory tone was equally likely to be 600 Hz in both presentations or 580 Hz in one presentation and 620 Hz in the other presentation (accordingly, the frequency was always centered around 600 Hz). Subjects performed a “same–different” task, indicating via key-press whether the two auditory tones were the same or different frequencies.
TACTILE TASKS.
There were three tactile tasks: “tactile letters” (TL), “tactile animals” (TA), and “tactile orientation” (TO). All tactile stimuli were applied to the subject's hand manually by the experimenter, who stood as still as possible just outside the scanner, near where the subject's hand rested on a firm piece of cardboard placed on his or her lap.
For blind subjects, the TL stimulus consisted of two sets of three letters (trigrams). Each set of letters contained three Braille letters, produced via a Braille labeler, embossed onto tape, and placed in a row (with a space between each pair of sets) on an index card. As with the AL task, each distractor letter was randomly generated from the alphabet (excluding the letter “O”), with the exception of one letter in either the first or second set of letters, which was randomly selected and replaced with the target letter “O.” The subject had 1-s to read both sets of letters, followed by a 0.5-s response period (for a total of 2.5-s per trial, with four trials per 10 s stimulus block). The subject's task was to indicate whether the letter “O” was contained in the first or second set of letters. To reduce subject motion in the scanner, we arranged each index card with four rows of trials, so that each card contained all the trials for a given stimulus block. Accordingly, unlike the other tasks in this study, the TL task was necessarily self-paced by the subject. For sighted subjects (since they did not read Braille), we created a modified TL stimulus. The stimulus and procedure were as described earlier, except that instead of embossed Braille letters, we used the embossed Roman letter “I” for every distractor and the Roman letter “O” as the target. Despite it being difficult, if not impossible, to equate a Braille reading task across blind and sighted subjects (see discussion), given that we were trying to select tasks that best represented the plasticity induced by blindness, we felt it was important to include Braille reading in our selection of tasks.
The TA stimulus consisted of a collection of toy plastic animals, with equal numbers of mammals (pig, goat, bear, gorilla, giraffe, elephant) and nonmammals (snake, insect, lizard, turtle, crab, shark). During each of two (4.75-s) intervals, a plastic animal was placed into the subject's hand by the experimenter and the subject was encouraged to actively feel the object with the hand (while minimizing movement of the arm). Mammals and nonmammals were presented with equal frequency and the probability of their belonging to the same category was 50%. This was followed by a 0.5-s response period, for a total of 10-s per trial, and one trial per 10-s stimulus block. Subjects performed a “same–different” task, indicating via key-press whether both animals belonged to the same mammal/nonmammal category.
For the TO task, the experimenter applied a JVP dome (2.0 mm; Stoelting, Wood Dale, IL) tactile grating to the index finger of the subject by slowly “swiping” it along the fingertip. Similar methods using JVP domes have been used by others (e.g., Sathian and Zangaladze 2002; Zhang et al. 2005). Each “swipe” was oriented such that the indentations of the JVP dome ran parallel to the length of the finger (“vertical”) or across the width of the finger (“horizontal”). Each swipe was presented over a duration of about 2-s and was followed by a 0.5-s response period (for a total of 2.5-s per trial, with four trials per 10-s stimulus block). The subject's task was to indicate via key-press whether the orientation of the grating had been vertical or horizontal.
Comparison of eyes-open/eyes-closed responses
Because of the interleaving of visual conditions in the main experiment, sighted subjects were asked to fixate a 0.27° white or gray central circle (rather than close their eyes) during each scanning session.
In a control experiment we compared responses in two sighted subjects with eyes open versus eyes closed in the AF and AL tasks. A single session was run for each subject containing three eyes-open runs and two or three eyes-closed runs (a single run was lost due to a computer crash). Within each run subjects performed 11 repeats of an interleaved key-press, AF, and AL tasks for 22–33 block repetitions in total for each task under both the eyes-open and the eyes-closed conditions. In addition, pilot data collected using AM stimuli suggest similar occipital cross-modal responses in sighted subjects between eyes-open and eyes-closed conditions (although see Merabet et al. 2007).
These data were analyzed using a subtraction analysis (eyes-open − eyes-closed) fixed-effects general linear model (GLM) analysis corrected for multiple comparisons using the false discovery rate (FDR) method (Genovese et al. 2002) (see the following text). Neither subject showed any regions of cortex that showed significant differences (P > 0.05) between eyes-open and eyes-closed conditions for either task.
BOLD data analysis
Brain Voyager QX (Brain Innovation, Maastricht, The Netherlands) and MATLAB (MathWorks) were used for data analysis. Data preprocessing included linear trend removal, temporal high-pass filtering, and motion correction.
GLM ANALYSES.
For GLM analyses, using Brain Voyager, individual 3D anatomical images were transformed into Talairach space and segmented at the gray/white matter boundary. This allowed for cortical surface reconstruction of each individual subject's brain hemispheres. Cortex-based alignment was applied to further improve intersubject alignment beyond Talairach correspondence. The reconstructed cortical surfaces were each transformed into a spherical representation that was subjected to nonrigid alignment to a selected target brain sphere based on the gyral/sulcal folding pattern (Fischl et al. 1999). fMRI data were aligned to same-session anatomical volumes and transformed into the cortical surface-based aligned coordinate space. Using a common space based on gyral/sulcal folding patterns allowed us to compare patterns of responses across subjects' occipital cortices relative to their own gyral and sulcal landmarks and this technique has been shown to outperform linear and nonlinear volume-based registration methods at aligning functionally defined visual areas (Fischl et al. 1999; Hinds et al. 2008, 2009). However, it should be noted that cortical folding patterns may differ between early-blind and sighted subjects (Dehay et al. 1989, 1996).
The GLM used for subtraction analyses contained only data from the auditory, tactile, and the key-press tasks for blind and sighted subjects (because no effects of handedness were noticed in the occipital lobe, data were collapsed across right- and left-handed subjects), with all visual conditions manually removed. This GLM was used within Brain Voyager for subtraction analyses using a fixed-effects GLM analysis corrected for multiple comparisons using the FDR method (Genovese et al. 2002) because we did not have a sufficient number of subjects for a random-effects analysis.
Data for each vertex (from the cortical surface-based coordinate space) for each scan were then exported from Brain Voyager to custom software in MATLAB for correlational analyses.
ROI DEFINITION.
Definition of ROIs (see Fig. 3) was done by hand on the cortical surface-based coordinate space using a combination of functional (informal inspection of the responses to visual conditions in sighted subjects and cross-modal responses in blind and sighted subjects) and anatomical criteria. A main occipital ROI and five subregion ROIs were defined by an author naïve to the results of the correlational analyses. Identification of the regions likely to be included in each ROI is based on descriptions by Wandell et al. (2007), although it should be noted that the organization of many extrastriate visual areas remains a matter of discussion.
Fig. 3.

Anatomical landmarks on the target anatomy. Regions of interest (ROIs) were drawn by hand using anatomical landmarks, as described in the text. CaS, calcarine sulcus; CS, collateral sulcus; FuG, fusiform gyrus; IPS, intraparietal sulcus; ITG, inferior temporal gyrus; LG, lingual gyrus; LOS, lateral occipital sulcus; POS, parietooccipital sulcus.
Occipital ROI.
A combination of responses to visual conditions in sighted subjects as well as sulcal and gyral landmarks were used to help define the boundaries of the occipital ROI, although it should be noted that activity to visual conditions was seen outside the occipital ROI, particularly for the visual animals and visual letters conditions. This ROI was likely to include foveal and peripheral early visual areas as well as substantial extrastriate areas.
Foveal confluence ROI.
The foveal confluence ROI was selected based on anatomical criteria. This ROI was drawn on the medial surface along the calcarine sulcus and was centered on the occipital pole. This ROI was likely to include the foveal confluence of early (retinotopically organized) visual areas (V1–V4).
Peripheral early visual areas ROI.
The peripheral early visual areas ROI was selected, using anatomical criteria, to be anterior to the foveal confluence ROI along the medial surface. Although the size of early visual areas differs substantially across subjects (Dougherty et al. 2003; Duncan and Boynton 2003), these changes generally seem to align with anatomical folding patterns within occipital cortex, making it possible to roughly localize early visual areas based on cortical landmarks (Hinds et al. 2008). This ROI was likely to primarily consist of regions of cortex that normally represent nonfoveal V1–V2, although it is possible that in some subjects regions of V3 were also included.
Dorsal/parietal ROI.
The dorsal/parietal ROI was defined based on anatomical criteria and cross-modal responses in blind subjects to include dorsal regions along the intraparietal sulcus that would, in normally sighted observers, be likely to include dorsal portions of V3, V3A, V3B, and early intraparietal areas including IPS-0–2 and possibly IPS-3–4 in some observers (Wandell et al. 2007).
Ventral ROI.
The ventral ROI was chosen, based on anatomical criteria, to include ventral regions anterior to the posterior fusiform gyrus along the lateral bank of the collateral sulcus. In normally sighted observers this ROI would be likely to include hV4 and ventral occipital areas including VO-1 and VO-2 (Wandell et al. 2007).
Lateral ROI.
The lateral ROI was chosen on the basis of anatomical criteria and cross-modal responses in blind subjects, to include regions along the lateral occipital sulcus that in normally sighted observers are likely to include LO-1 and LO-2 and possibly, in some subjects, portions of V3A and MT+ (Wandell et al. 2007).
CORRELATIONAL ANALYSES.
The analyses described here were carried out using custom software written in MATLAB. As described earlier, data from all subjects were transformed into a cortical-surface-based aligned coordinate space. This results in a common number of vertices/surface voxels per subject (aligned relative to each subject's gyral and sulcal landmarks).
We calculated response amplitudes (percentage BOLD signal change) for each task in each vertex by calculating the difference between the response to that task and the key- press task, divided by the response to the key-press task
| (1) |
where X̄task is the mean activation for each task and X̄key-press is the mean activation for the key-press task (our sparse design made it inappropriate to fit the full hemodynamic response function). Percentage BOLD signal change for each task was then calculated as the mean of each of these ratios across all scans.
The pattern of responses to two conditions was calculated as the Pearson correlation of the amplitudes across vertices. For example, to determine whether sighted subjects showed a similar pattern of responses to AL and AF tasks across the occipital cortical surface, the correlation coefficient was computed as follows
| (2) |
where i = 1, 2, …, n; n is the number of vertices; xi is the mean response to the AL task averaged across all sighted subjects in a given vertex; yi is the mean response to the AF task averaged across all sighted subjects in that vertex; x̄ and ȳ are the mean responses for AL and AF, respectively, averaged across all vertices in all sighted subjects; and sx and sy are the SDs of the mean responses across all vertices in all sighted subjects for the two tasks, respectively. A positive correlation would imply that a similar pattern of cortical regions is activated (and deactivated) across the two tasks. A negative correlation would imply that those regions that showed positive responses in the AF task had negative responses in the AL task and vice versa.
RESULTS
Behavioral performance
Due to technical problems at the scanner, behavioral data for 11 of the 133 scans were lost. Subjects were unaware of the technical problems and so presumably performed the tasks as usual while in the scanner. Additionally, due to a technical glitch in the MRI-compatible button box, about 10% of responses were not recorded. Unfortunately, these responses were not distinguishable from subjects failing to respond within the allotted response interval. Analyses were carried out both including and excluding late/lost responses. The pattern of results was similar for both analyses.
Late/lost responses classified as incorrect responses
A two-way mixed ANOVA (subject group × task) indicated that although there was no effect of subject group [F(1,11) = 2.63, P = 0.13] and no interaction effect [F(5,55) = 0.78, P = 0.57; data corrected for lack of sphericity], there was a main effect of task [F(5,55) = 13.90, P < 0.0001; data corrected for lack of sphericity]. Individual t-tests confirmed that task performance was not significantly different between blind versus sighted subjects for any task or averaged across all tasks (see Table 2 and Fig. 2).
Table 2.
Behavioral performance for blind and sighted subjects
| Late/Lost Responses | Blind, % | Sighted, % | P Value | |
|---|---|---|---|---|
| Averaged across all tasks | Included as incorrect | 73.8 | 70.2 | P = 0.36 |
| Excluded | 94.3 | 94.6 | P = 0.86 | |
| Late/lost responses | 21.8 | 25.7 | P = 0.32 | |
| AL | Included as incorrect | 86.7 | 72.2 | P = 0.09 |
| Excluded | 96.5 | 96.8 | P = 0.84 | |
| Late/lost responses | 10.3 | 25.5 | P = 0.08 | |
| AM | Included as incorrect | 83.6 | 75.7 | P = 0.42 |
| Excluded | 90.0 | 94.8 | P = 0.19 | |
| Late/lost responses | 7.0 | 21.0 | P = 0.13 | |
| AF | Included as incorrect | 91.1 | 81.4 | P = 0.34 |
| Excluded | 99.7 | 94.9 | P = 0.13 | |
| Late/lost responses | 8.6 | 15.4 | P = 0.44 | |
| TL | Included as incorrect | 43.1 | 32.1 | P = 0.18 |
| Excluded | 89.1 | 67.5 | P = 0.01 | |
| Late/lost responses | 51.1 | 52.0 | P = 0.92 | |
| TA | Included as incorrect | 45.5 | 36.0 | P = 0.57 |
| Excluded | 91.7 | 92.9 | P = 0.84 | |
| Late/lost responses | 50.9 | 57.6 | P = 0.73 | |
| TO | Included as incorrect | 62.7 | 76.0 | P = 0.36 |
| Excluded | 94.0 | 95.8 | P = 0.72 | |
| Late/lost responses | 33.5 | 21.8 | P = 0.40 |
Significant task differences between blind and sighted subjects are shown in bold.
The main effect of task is explained by t-test across subject groups; performance for both TL and TA was significantly worse than performance for all three auditory tasks (P < 0.01 for all comparisons). Performance for TO was significantly worse than performance for AF (P < 0.05), and significantly better than performance for TL and TA (P < 0.01 for both comparisons). Performance for AF was significantly better than performance for AM (P < 0.02).
Late/lost responses excluded
When late/lost responses were excluded, a two-way mixed ANOVA (subject group × task) indicated that although there was no effect of subject group [F(1,11) = 1.72, P = 0.22], there was again a main effect of task [F(5,55) = 11.29, P < 0.0001; data corrected for lack of sphericity] and an interaction effect [F(5,55) = 5.29, P < 0.01; data corrected for lack of sphericity]. Individual t-tests confirmed that task performance was not significantly different between blind versus sighted subjects, with the exception of TL (see Table 2).
For blind subjects, although performance was close to 90% in the TA and the TL tasks when late/lost trials were excluded, a high proportion of late/lost trials meant that performance was poor for both tasks when late/lost trials were included; providing a response within the allotted response interval was challenging for both these tasks.
The main effect of task is explained by t-tests across subject groups; performance for TL was significantly worse than performance for all other auditory and tactile tasks (P < 0.02 for all comparisons). Performance for TA was significantly worse than performance for AF (P < 0.03). Performance for AL and AF was significantly better than performance for AM (P < 0.03 for both comparisons).
The interaction effect is explained by t-tests comparing each task within each subject group: in sighted subjects performance for TL was significantly worse than performance for all other auditory and tactile tasks (P < 0.01 for all comparisons). It is perhaps not surprising that sighted subjects performed more poorly on TL than blind subjects, since not only were they unable to read Braille, but they were also not used to reading Roman letters tactilely.
In blind subjects performance for AL was significantly better than performance for AM and TL (P < 0.05 for both comparisons), performance for AF was significantly better than performance for AL, AM, and TL (P < 0.02 for all comparisons), and performance for TL was significantly worse than performance for TO (P < 0.05).
Analysis of late/lost responses
A two-way mixed ANOVA (subject group × task) on percentage of late/lost responses indicated that although there was no effect of subject group [F(1,11) = 1.58, P = 0.23] and no interaction effect [F(5,55) = 0.68, P = 0.63; data corrected for lack of sphericity], there was a main effect of task [F(5,55) = 10.03, P < 0.001; data corrected for lack of sphericity]. Individual t-tests confirmed that the percentage of late/lost responses did not significantly differ between blind and sighted subjects for any task (see Table 2). The main effect of task is explained by t-tests across subject groups; the percentage of late/lost responses for both TL and TA was significantly greater than percentage of late/lost responses for all other auditory and tactile tasks (P < 0.02 for all comparisons) and the percentage of late/lost responses for TO was significantly greater than the percentage of late/lost responses for AF (P < 0.05). These findings suggest that it was generally more difficult for subjects to respond within the allotted time period to tactile than to auditory tasks.
BOLD results
Figures 4 to 6 show group averages of sighted, blind, and blind–sighted responses to each cross-modal task versus the key-press task. Data are masked by the occipital ROI shown in yellow on the inset to each figure. In Figs. 4 and 5 warm colors represent greater BOLD responses to the given task than to the key-press task in blind and sighted subjects. In Fig. 6 warm colors represent greater BOLD responses to the given task than to the key-press task in blind than in sighted subjects. Across all conditions there was a “hole” in activation near the occipital pole. Analysis of activation within the foveal confluence ROI in individual subjects (Table 3 and Supplemental data)1 suggests that this “hole” in activation is due to small misalignments across subjects near the occipital pole rather than being a genuine lack of response within the foveal confluence.
Fig. 4.

Sighted blood oxygenation level dependent (BOLD) responses for each cross-modal task vs. the key-press task. Medial views are presented on the left for each hemisphere, whereas views from behind the occipital pole are presented on the right for each hemisphere. LH, left hemisphere; RH, right hemisphere. Insets show the anatomically defined ROIs that were used to mask the data. Warm colors represent greater BOLD response in the auditory/tactile task than the key-press condition. Data are thresholded at q(FDR) <0.05. [Patterns of activation were similar in magnitude for much higher thresholds such as q(FDR) <0.003; data not shown.] A: auditory letters (AL) vs. key-press task. B: auditory motion (AM) vs. key-press task. C: auditory frequency (AF) vs. key-press task. D: tactile letters (TL) vs. key-press task. E: tactile animals (TA) vs. key-press task. F: tactile orientation (TO) vs. key-press task. FDR, false discovery rate.
Fig. 6.

Blind–Sighted group averages of cross-modal BOLD response for each cross-modal task vs. the key-press task. Medial views are presented on the left for each hemisphere, whereas views from behind the occipital pole are presented on the right for each hemisphere. LH, left hemisphere; RH, right hemisphere. Insets show the anatomically defined ROIs that were used to mask the data. Warm colors represent greater BOLD response in blind than sighted subjects (cross-modal plasticity); cool colors represent greater BOLD response in sighted than blind subjects. Data are thresholded at q(FDR) <0.05. [Patterns of cross-modal activation were similar in magnitude for much stricter thresholds such as q(FDR) <0.003; data not shown.] A: auditory letters (AL) vs. key-press task. B: auditory motion (AM) vs. key-press task. C: auditory frequency (AF) vs. key-press task. D: tactile letters (TL) vs. key-press task. E: tactile animals (TA) vs. key-press task. F: tactile orientation (TO) vs. key-press task.
Fig. 5.

Blind BOLD responses for each cross-modal task vs. the key-press task. Medial views are presented on the left for each hemisphere, whereas views from behind the occipital pole are presented on the right for each hemisphere. LH, left hemisphere. RH, right hemisphere. Insets show the anatomically defined ROIs that were used to mask the data. Warm colors represent greater BOLD response in the auditory/tactile task than the key-press condition. Data are thresholded at q(FDR) <0.05. [Patterns of activation were similar in magnitude for much higher thresholds such as q(FDR) <0.003; data not shown.] A: auditory letters (AL) vs. key-press task. B: auditory motion (AM) vs. key-press task. C: auditory frequency (AF) vs. key-press task. D: tactile letters (TL) vs. key-press task. E: tactile animals (TA) vs. key-press task. F: tactile orientation (TO) vs. key-press task.
Table 3.
Summary of BOLD responses within anatomical regions of interest (ROIs)
| ROI | AL | AM | AF | TL | TA | TO |
|---|---|---|---|---|---|---|
| Occipital | ||||||
| Sighted | ||||||
| Blind | ** | *** | ** | ** | *** | ** |
| Blind–sighted | * | ** | *** | ** | * | *** |
| Foveal confluence | ||||||
| Sighted | * | ** | ||||
| Blind | * | *** | ** | ** | ** | |
| Blind–sighted | * | * | ||||
| Peripheral early visual areas | ||||||
| Sighted | * | |||||
| Blind | *** | ** | *** | ** | ** | ** |
| Blind–sighted | ** | ** | * | ** | ||
| Dorsal/parietal | ||||||
| Sighted | * | * | ||||
| Blind | * | ** | ** | *** | *** | *** |
| Blind–sighted | *** | *** | ** | ** | *** | |
| Ventral | ||||||
| Sighted | * | |||||
| Blind | ** | * | * | *** | *** | *** |
| Blind–sighted | * | * | * | *** | *** | |
| Lateral | ||||||
| Sighted | ||||||
| Blind | *** | *** | * | ** | ** | |
| Blind–sighted | *** | ** | ** | * | ** |
A Wilcoxon signed-rank test was used to test whether sighted and blind responses were significantly different from zero. A Wilcoxon rank sum test was used to test whether sighted and blind responses were significantly different.
P < 0.05,
P < 0.01,
P < 0.001. Bold underlining represents significantly negative responses. Because there was no significant difference in BOLD responses across hemispheres for any ROI (two-factor ANOVA, hemisphere × task), data were collapsed across left and right hemispheres. See Supplemental data for corresponding bar graphs.
In sighted subjects (Fig. 4, Table 3, Supplemental data), as previously described (Merabet et al. 2007), we saw a combination of positive and negative BOLD activation across the full occipital ROI. An ROI analysis found no significant overall BOLD response across the full occipital ROI for any task. Significantly positive BOLD responses were seen within the foveal confluence for the AL and AF tasks and within peripheral early visual areas for the TA task. Significantly negative BOLD activity was seen within the dorsal/parietal ROI for the AM task and within both dorsal/parietal and ventral ROIs for the TO task. Bar graphs showing left and right hemisphere responses for each task within each ROI are shown in the Supplemental data.
Blind subjects (Fig. 5) showed extensive positive activation with very little negative activation across most of the occipital ROI. ROI analyses showed significantly positive BOLD activity for ROIs for all tasks with the exception of the TO task within the foveal confluence and the AL tasks within the lateral ROI.
Significant cross-modal plasticity (blind–sighted activation; Fig. 6) was also observed across much of occipital cortex: the occipital ROI showed cross-modal plasticity for all tasks. The foveal confluence showed significant cross-modal plasticity for AM and TO tasks (note that this was a relatively small ROI, which may have limited the power of this analysis). Peripheral visual areas showed cross-modal plasticity for four of the six tasks: AM, AF, TL, and TO. Dorsal/parietal and lateral ROIs showed cross-modal plasticity for all tasks except AL and the ventral ROI showed cross-modal plasticity for all tasks except AF.
It is noticeable that there were strong similarities in the pattern of cross-modal responses across all tasks within both hemispheres for sighted, blind, and blind–sighted responses. As can be seen in Fig. 6, it was even the case that the pattern of cross-modal plasticity found for tactile tasks was remarkably similar to that found for auditory tasks. Indeed subtraction analyses between tasks (e.g., AM − AF) resulted in remarkably few areas that showed significant differences between tasks compared with the overall level of cross-modal plasticity. To quantify this similarity across tasks, we calculated the correlation coefficient (c) between responses for each task across all the vertices in our occipital ROI (collapsed across both left and right hemispheres, since cross-correlation results for each hemisphere were very similar) for blind subjects, sighted subjects, and blind–sighted responses.
If responses across the cortical surface were identical across a pair of tasks, the cross-correlation would be one. Conversely, if there were little correlation across tasks and our failure to find task-specific activation was simply due to low signal-to-noise, we would expect correlation values to be near zero. Note that these correlation values place equal weight on every vertex within the occipital cortex, whereas the activity maps of Figs. 4–6 include only those vertices that show a strong positive or negative response. As a result these correlation values are somewhat more susceptible to noise than the corresponding activity maps.
As shown in Fig. 7, within the occipital ROI for sighted subjects correlations ranged between 0.06 and 0.68, for blind subjects correlations ranged between 0.19 and 0.74, and for blind–sighted subjects correlations ranged between 0.03 and 0.66. Correlations between most tasks were strongly positive and correlations were significantly larger than zero (P < 0.001 for blind, sighted, and blind–sighted comparisons, two-sided Wilcoxon signed-rank test). These results quantify our previous observation that a significant proportion of cross-modal plasticity is relatively unselective for task or modality. Similar high cross-correlations were found for all subregion ROIs, as shown in the Supplemental data.
Fig. 7.
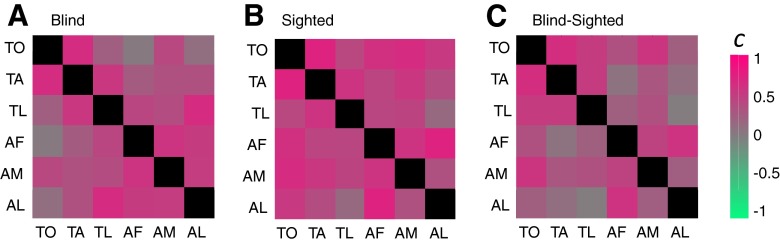
Cross-correlations between cross-modal BOLD percentage signal change across the 6 different cross-modal tasks across the occipital cortical surface for (A) sighted subject responses, (B) blind subject responses, (C) cross-modal plasticity (blind–sighted) responses.
Our next goal was to compare blind and sighted subjects' cross-modal responses within occipital cortex. Figure 8 shows an illustrative scatterplot comparing the mean responses across all sighted subjects to mean responses in blind subjects for the auditory motion task within the left hemisphere occipital ROI.
Fig. 8.

Scatterplot comparing mean responses across all sighted subjects to mean responses across all blind subjects for the auditory motion task in the occipital ROI in the left hemisphere. Each data point represents a single vertex. The black dashed lines show x = 0, y = 0, representing positive BOLD responses or suppression compared with the key-press task. The solid black line represents y = x: if blind and sighted subjects showed identical responses the data should fall along that line. The thick dashed line shows the best-fitting regression slope and the thick dashed-dotted line shows the best-fitting slope corrected for attenuation.
We then examined regression slopes across blind and sighted measurements. In Fig. 8 the thick dashed line shows the best-fitting regression slope and the thick dashed-dotted line shows the best-fitting nonattenuated regression slope. A normal regression slope (β) between x and y is calculated as the correlation between them, multiplied by the ratio of their SDs.
We began by estimating the reliabilities of our measurements of blind and sighted responses using Cronbach's alpha, whereby the lower bound of reliability of mean blind and sighted responses (averaged across all subjects) was estimated as
| (5) |
where r̄ is the mean intersubject correlation within blind or sighted groups (calculated across all possible subject pairings) and N is the number of subjects (7 blind, 6 sighted).
An advantage of Cronbach's alpha is that it provides an explicit measurement of the reliability of measurements that includes the effects of both intersubject variability and the number of subjects included in the measurement. Intuitively it can be thought of as an estimate of the expected mean correlation across voxels/vertices across two experiments with N subjects. Within the occipital ROI for cross-modal responses αblind = 0.45 and αsighted = 0.37. In contrast, for visual responses in sighted subjects αsighted = 0.78. These results imply significantly higher intersubject variability (within both blind and sighted subjects) for cross-modal responses in the occipital lobe than was found for visual responses in sighted subjects.
| (3) |
As a consequence any noise within the measurement of x “attenuates” the estimated regression slope toward zero. The “nonattenuated” correlation relating x and y, rx′y′, is calculated as follows
| (4) |
where rxy is the correlation between x and y and rxx and ryy are the reliabilities of x and y measurements. This “nonattenuated” regression can be substituted into Eq. 3 to obtain an estimate of slope unbiased by measurement error in x (or y).
As described in the introduction, according to a simple “unmasking” hypothesis, the greatest enhancement of cross-modal responses as a result of blindness would be predicted to occur within those regions that show stronger cross-modal responses within sighted subjects. In that case we might expect the correlation between blind and sighted responses to be fit by a line with slope greater than one (multiplicative scaling). If either “suppression unmasking” or “homeostatic scaling of sensitivity” were occurring we would expect the opposite: divisive scaling, with a slope less than one along with an additive shift. If cross-modal responses in blind subjects were unrelated to cross-modal responses in sighted subjects we would expect an additive shift and a nonattenuated slope of zero. Finally, if enhancements of response in early-blind subjects were unrelated to cross-modal responses in sighted subjects, then we would expect an additive shift and a slope of one. In this particular example the best-fitting nonattenuated regression slope had a slope of 1.2 and an intercept of 0.25.
Figure 9 shows histograms representing nonattenuated slope and intercept values for the linear fits describing the relationship between cross-modal responses in sighted and blind subjects within the full occipital ROI within both hemispheres and all six conditions (histograms are therefore based on 12 values in total).
Fig. 9.

Slope and intercept values for the linear fits describing the relationship between cross-modal responses in sighted subjects and cross-modal responses in blind subjects for all 6 tasks and both hemispheres.
As in the illustrative example, intercepts tend to be significantly greater than zero (mean i = 0.28, P < 0.001, Wilcoxon signed-rank test). This additive shift was relatively large: almost half the mean response to high-contrast visual stimuli such as images of animals, gratings, or moving dots within the occipital ROI within sighted subjects (0.53% signal change; data not shown). Similar additive shifts were also seen within subregion ROIs (see Supplemental data).
Mean nonattenuated slopes within the occipital ROI were significantly greater than zero (P < 0.001) and were not significantly different from one (s = 0.95, P = 0.47, two-sided Wilcoxon signed-rank test). Although vertices that showed strong cross-modal responses in sighted subjects tended to show similarly high cross-modal responses in blind subjects, the enhancement of cross-modal responses due to blindness was not correlated either positively or negatively with the strength of cross-modal responses in sighted subjects. Similar slopes were seen within those subregion ROIs for which attenuated slopes could be measured (see Supplemental data).
DISCUSSION
Consistent with a large number of earlier studies (see introduction) we found evidence for cross-modal plasticity across a wide range of tasks and stimuli. It should be noted that these effects of cross-modal plasticity (the difference between blind and sighted subjects' responses) are unlikely to be due to general attention/arousal, given that task performance was similar for blind and sighted subjects for all tasks except the TL condition.
The TL task was surprisingly difficult for our sighted subjects (see Behavioral performance in results). It is of course a confound for this task that blind subjects' to performance was that sighted subjects, even when sighted subjects were given an easier task, and it is likely that very different strategies were used by the two groups. However, it is likely that this would have been the case even if training had been used to minimize differences in performance. Although it has been previously shown that training (especially when blindfolded) on complex tactile tasks does improve performance and increase BOLD responses, the effects of brief training are relatively weak compared with the differences in performance we observed between our blind and sighted subjects (Kauffman et al. 2002; Merabet et al. 2008).
Much of occipital cortex demonstrated cross-modal plasticity, with a larger extent of plasticity than has often been observed (although see Burton 2003). There are likely to be three reasons for this: first, we collected a large amount of data, including a very large number of “off blocks,” on a high-quality scanner. Second, our study had high signal-to-noise as a result of using a sparse pulse sequence that avoided auditory masking. As noted earlier, the long delay between acquisitions (which allows for more time to restore magnetic equilibrium) results in a higher signal-to-noise ratio for each individual acquisition, which partially compensates for the reduced number of acquisitions (Hall et al. 1999). Importantly, we compared a task + stimulus (e.g., auditory frequency discrimination) to a simple key-pressing control, as opposed to using a subtraction paradigm that compares activation patterns across two tasks. Such subtraction comparisons obscure the high baseline amount of unselective cross-modal plasticity revealed by our paradigm.
More surprisingly (although see Burton 2003), the pattern of cross-modal activity showed strong similarities across all tasks within both hemispheres. It was even the case that the pattern of cross-modal activity found for tactile tasks was remarkably similar to that found for auditory tasks. Indeed subtraction analyses between tasks (e.g., AM − AF), analogous to many previous experiments examining cross-modal plasticity (e.g., Amedi et al. 2003; Sadato et al. 1998; Saenz et al. 2008), resulted in remarkably few areas that showed significant differences between tasks compared with the overall level of nontask-specific cross-modal plasticity across much of occipital cortex. It seems that a relatively small amount of task-specific modulation of cross-modal plasticity lies on top of a large baseline response.
This finding of an unselective response component is consistent with positron emission tomography studies showing that although early-blind subjects exhibit similar oxygen-to-glucose metabolic ratios as sighted subjects (De Volder et al. 1997), primary and extrastriate visual cortical areas exhibit greater levels of glucose metabolism and regional cerebral blood flow than sighted subjects both while performing auditory or tactile tasks, and even during rest (De Volder et al. 1997; Uhl et al. 1993; Veraart et al. 1990; Wanet-Defalque et al. 1988). It is not clear what, if any, relationship there is between these nonselective enhancements of BOLD responses and superior tactile/auditory skills in early-blind individuals, given that skill enhancements as a result of early blindness have tended to be relatively specific in nature (Gougoux et al. 2004; Lessard et al. 1998; Roder et al. 1999; Sterr et al. 1998; Van Boven et al. 2000).
As well as being unselective for task, these enhancements of cross-modal responses as a result of early blindness were best modeled as an additive shift. This result suggests that enhancements of cross-modal responses within early-blind subjects do not originate from either a scaling or unmasking of cross-modal responsivities found in sighted subjects. This was true even within ROIs that included regions where earlier studies have suggested a congruence between sighted and early-blind cross-modal responses, such as our lateral (Poirier et al. 2005, 2006) and ventral (Mahon et al. 2009) ROIs (see introduction), though it remains possible that within small subregions of occipital cortex cross-modal plasticity may be influenced by sighted cross-modal responses.
It should be noted that our demonstration of the existence of a relatively unselective BOLD response to any kind of auditory or tactile stimulation across much of occipital cortex as a result of early blindness does not necessarily imply a lack of neural selectivity. Indeed, in normally sighted individuals almost all visual areas show a response to any visual stimulus: stimulus selectivity within specialized areas lies on top of strong generic visual response. Our results suggest that cross-modal responses in those blinded early in life may show a similar organization: as a consequence, studies using specific subtractions that do not measure this nonselective component might be considered to underestimate the extent of reorganization caused by early blindness.
GRANTS
This work was supported by National Eye Institute Grant EY-01645 and a Dana Foundation Award, both to I. Fine.
DISCLOSURES
No conflicts of interest, financial or otherwise, are declared by the author(s).
Supplementary Material
ACKNOWLEDGMENTS
We thank G. Boynton, V. Ciaramitaro, K. Dobkins, S. Murray, and V. van Wassenhove for technical support and comments on this manuscript.
Footnotes
The online version of this article contains supplemental data.
REFERENCES
- Alary et al., 2009. Alary F, Duquette M, Goldstein R, Elaine Chapman C, Voss P, La Buissonniere-Ariza V, Lepore F. Tactile acuity in the blind: a closer look reveals superiority over the sighted in some but not all cutaneous tasks. Neuropsychologia 47: 2037–2043, 2009 [DOI] [PubMed] [Google Scholar]
- Amedi et al., 2002. Amedi A, Jacobson G, Hendler T, Malach R, Zohary E. Convergence of visual and tactile shape processing in the human lateral occipital complex. Cereb Cortex 12: 1202–1212, 2002 [DOI] [PubMed] [Google Scholar]
- Amedi et al., 2001. Amedi A, Malach R, Hendler T, Peled S, Zohary E. Visuo-haptic object-related activation in the ventral visual pathway. Nat Neurosci 4: 324–330, 2001 [DOI] [PubMed] [Google Scholar]
- Amedi et al., 2005. Amedi A, Merabet LB, Bermpohl F, Pascual-Leone A. The occipital cortex in the blind: lessons about plasticity and vision. Curr Dir Psychol Sci 16: 306–311, 2005 [Google Scholar]
- Amedi et al., 2003. Amedi A, Raz N, Pianka P, Malach R, Zohary E. Early “visual” cortex activation correlates with superior verbal memory performance in the blind. Nat Neurosci 6: 758–766, 2003 [DOI] [PubMed] [Google Scholar]
- Bonino et al., 2008. Bonino D, Ricciardi E, Sani L, Gentili C, Vanello N, Guazzelli M, Vecchi T, Pietrini P. Tactile spatial working memory activates the dorsal extrastriate cortical pathway in congenitally blind individuals. Arch Ital Biol 146: 133–146, 2008 [PubMed] [Google Scholar]
- Boynton et al., 1996. Boynton GM, Engel SA, Glover GH, Heeger DJ. Linear systems analysis of functional magnetic resonance imaging in human V1. J Neurosci 16: 4207–4221, 1996 [DOI] [PMC free article] [PubMed] [Google Scholar]
- Brainard, 1997. Brainard DH. The Psychophysics Toolbox. Spat Vis 10: 433–436, 1997 [PubMed] [Google Scholar]
- Burton, 2003. Burton H. Visual cortex activity in early and late blind people. J Neurosci 23: 4005–4011, 2003 [DOI] [PMC free article] [PubMed] [Google Scholar]
- Burton et al., 2003. Burton H, Diamond JB, McDermott KB. Dissociating cortical regions activated by semantic and phonological tasks: an fMRI study in blind and sighted people. J Neurophysiol 90: 1965–1982, 2003 [DOI] [PMC free article] [PubMed] [Google Scholar]
- Burton and McLaren, 2006. Burton H, McLaren DG. Visual cortex activation in late-onset, Braille naive blind individuals: an fMRI study during semantic and phonological tasks with heard words. Neurosci Lett 392: 38–42, 2006 [DOI] [PMC free article] [PubMed] [Google Scholar]
- Burton et al., 2006. Burton H, McLaren DG, Sinclair RJ. Reading embossed capital letters: an fMRI study in blind and sighted individuals. Hum Brain Mapp 27: 325–339, 2006 [DOI] [PMC free article] [PubMed] [Google Scholar]
- Burton et al., 2002. Burton H, Snyder AZ, Diamond JB, Raichle ME. Adaptive changes in early and late blind: an fMRI study of verb generation to heard nouns. J Neurophysiol 88: 3359–3371, 2002 [DOI] [PMC free article] [PubMed] [Google Scholar]
- Calvert et al., 1999. Calvert GA, Brammer MJ, Bullmore ET, Campbell R, Iversen SD, David AS. Response amplification in sensory-specific cortices during crossmodal binding. Neuroreport 10: 2619–2623, 1999 [DOI] [PubMed] [Google Scholar]
- Carmignoto and Vicini, 1992. Carmignoto G, Vicini S. Activity-dependent decrease in NMDA receptor responses during development of the visual cortex. Science 258: 1007–1011, 1992 [DOI] [PubMed] [Google Scholar]
- Cattaneo et al., 2008. Cattaneo Z, Vecchi T, Cornoldi C, Mammarella I, Bonino D, Ricciardi E, Pietrini P. Imagery and spatial processes in blindness and visual impairment. Neurosci Biobehav Rev 32: 1346–1360, 2008 [DOI] [PubMed] [Google Scholar]
- Clarke and Innocenti, 1986. Clarke S, Innocenti GM. Organization of immature intrahemispheric connections. J Comp Neurol 251: 1–22, 1986 [DOI] [PubMed] [Google Scholar]
- Cohen et al., 1997. Cohen LG, Celnik P, Pascual-Leone A, Corwell B, Falz L, Dambrosia J, Honda M, Sadato N, Gerloff C, Catala MD, Hallett M. Functional relevance of cross-modal plasticity in blind humans. Nature 389: 180–183, 1997 [DOI] [PubMed] [Google Scholar]
- Cohen et al., 1999. Cohen LG, Weeks RA, Sadato N, Celnik P, Ishii K, Hallett M. Period of susceptibility for cross-modal plasticity in the blind. Ann Neurol 45: 451–460, 1999 [DOI] [PubMed] [Google Scholar]
- Collignon et al., 2009. Collignon O, Voss P, Lassonde M, Lepore F. Cross-modal plasticity for the spatial processing of sounds in visually deprived subjects. Exp Brain Res 192: 343–358, 2009 [DOI] [PubMed] [Google Scholar]
- Dehay et al., 1984. Dehay C, Bullier J, Kennedy H. Transient projections from the fronto-parietal and temporal cortex to areas 17, 18 and 19 in the kitten. Exp Brain Res 57: 208–212, 1984 [DOI] [PubMed] [Google Scholar]
- Dehay et al., 1996. Dehay C, Giroud P, Berland M, Killackey H, Kennedy H. Contribution of thalamic input to the specification of cytoarchitectonic cortical fields in the primate: effects of bilateral enucleation in the fetal monkey on the boundaries, dimensions, and gyrification of striate and extrastriate cortex. J Comp Neurol 367: 70–89, 1996 [DOI] [PubMed] [Google Scholar]
- Dehay et al., 1989. Dehay C, Horsburgh G, Berland M, Killackey H, Kennedy H. Maturation and connectivity of the visual cortex in monkey is altered by prenatal removal of retinal input. Nature 337: 265–267, 1989 [DOI] [PubMed] [Google Scholar]
- Dehay et al., 1988. Dehay C, Kennedy H, Bullier J. Characterization of transient cortical projections from auditory, somatosensory, and motor cortices to visual areas 17, 18, and 19 in the kitten. Behav Brain Res 29: 237–244, 1988 [DOI] [PubMed] [Google Scholar]
- Desai et al., 2002. Desai NS, Cudmore RH, Nelson SB, Turrigiano GG. Critical periods for experience-dependent synaptic scaling in visual cortex. Nat Neurosci 5: 783–789, 2002 [DOI] [PubMed] [Google Scholar]
- De Volder et al., 1997. De Volder AG, Bol A, Blin J, Robert A, Arno P, Grandin C, Michel C, Veraart C. Brain energy metabolism in early blind subjects: neural activity in the visual cortex. Brain Res 750: 235–244, 1997 [DOI] [PubMed] [Google Scholar]
- Dougherty et al., 2003. Dougherty RF, Koch VM, Brewer AA, Fischer B, Modersitzki J, Wandell BA. Visual field representations and locations of visual areas V1/2/3 in human visual cortex. J Vis 3: 586–598, 2003 [DOI] [PubMed] [Google Scholar]
- Duncan and Boynton, 2003. Duncan RO, Boynton GM. Cortical magnification within human primary visual cortex correlates with acuity thresholds. Neuron 38: 659–671, 2003 [DOI] [PubMed] [Google Scholar]
- Fischl et al., 1999. Fischl B, Sereno MI, Dale AM. Cortical surface-based analysis. II: Inflation, flattening, and a surface-based coordinate system. NeuroImage 9: 195–207, 1999 [DOI] [PubMed] [Google Scholar]
- Fischl et al., 1999. Fischl B, Sereno MI, Tootell RB, Dale AM. High-resolution intersubject averaging and a coordinate system for the cortical surface. Hum Brain Mapp 8: 272–284, 1999 [DOI] [PMC free article] [PubMed] [Google Scholar]
- Genovese et al., 2002. Genovese CR, Lazar NA, Nichols T. Thresholding of statistical maps in functional neuroimaging using the false discovery rate. NeuroImage 15: 870–878, 2002 [DOI] [PubMed] [Google Scholar]
- Ghazanfar and Schroeder, 2006. Ghazanfar AA, Schroeder CE. Is neocortex essentially multisensory? Trends Cogn Sci 10: 278–285, 2006 [DOI] [PubMed] [Google Scholar]
- Goldreich and Kanics, 2003. Goldreich D, Kanics IM. Tactile acuity is enhanced in blindness. J Neurosci 23: 3439–3445, 2003 [DOI] [PMC free article] [PubMed] [Google Scholar]
- Goldreich and Kanics, 2006. Goldreich D, Kanics IM. Performance of blind and sighted humans on a tactile grating detection task. Percept Psychophys 68: 1363–1371, 2006 [DOI] [PubMed] [Google Scholar]
- Gougoux et al., 2004. Gougoux F, Lepore F, Lassonde M, Voss P, Zatorre RJ, Belin P. Neuropsychology: pitch discrimination in the early blind (Abstract). Nature 430: 309, 2004 [DOI] [PubMed] [Google Scholar]
- Gougoux et al., 2005. Gougoux F, Zatorre RJ, Lassonde M, Voss P, Lepore F. A functional neuroimaging study of sound localization: visual cortex activity predicts performance in early-blind individuals. PLoS Biol 3: e27, 2005 [DOI] [PMC free article] [PubMed] [Google Scholar]
- Gu, 2003. Gu Q. Contribution of acetylcholine to visual cortex plasticity. Neurobiol Learn Mem 80: 291–301, 2003 [DOI] [PubMed] [Google Scholar]
- Hall et al., 1999. Hall DA, Haggard MP, Akeroyd MA, Palmer AR, Summerfield AQ, Elliott MR, Gurney EM, Bowtell RW. “Sparse” temporal sampling in auditory fMRI. Hum Brain Mapp 7: 213–223, 1999 [DOI] [PMC free article] [PubMed] [Google Scholar]
- Hamilton et al., 2000. Hamilton R, Keenan JP, Catala M, Pascual-Leone A. Alexia for Braille following bilateral occipital stroke in an early blind woman. Neuroreport 11: 237–240, 2000 [DOI] [PubMed] [Google Scholar]
- Hamilton and Pascual-Leone, 1998. Hamilton RH, Pascual-Leone A. Cortical plasticity associated with Braille learning. Trends Cogn Sci 2: 168–174, 1998 [DOI] [PubMed] [Google Scholar]
- Heller, 1989. Heller MA. Picture and pattern perception in the sighted and the blind: the advantage of the late blind. Perception 18: 379–389, 1989 [DOI] [PubMed] [Google Scholar]
- Heller et al., 1996. Heller MA, Calcaterra JA, Burson LL, Tyler LA. Tactual picture identification by blind and sighted people: effects of providing categorical information. Percept Psychophys 58: 310–323, 1996 [DOI] [PubMed] [Google Scholar]
- Heller et al., 1996. Heller MA, Calcaterra JA, Tyler LA, Burson LL. Production and interpretation of perspective drawings by blind and sighted people. Perception 25: 321–334, 1996 [DOI] [PubMed] [Google Scholar]
- Herrero et al., 2008. Herrero JL, Roberts MJ, Delicato LS, Gieselmann MA, Dayan P, Thiele A. Acetylcholine contributes through muscarinic receptors to attentional modulation in V1. Nature 454: 1110–1114, 2008 [DOI] [PMC free article] [PubMed] [Google Scholar]
- Hinds et al., 2009. Hinds O, Polimeni JR, Rajendran N, Balasubramanian M, Amunts K, Zilles K, Schwartz EL, Fischl B, Triantafyllou C. Locating the functional and anatomical boundaries of human primary visual cortex. NeuroImage 46: 915–922, 2009 [DOI] [PMC free article] [PubMed] [Google Scholar]
- Hinds et al., 2008. Hinds OP, Rajendran N, Polimeni JR, Augustinack JC, Wiggins G, Wald LL, Diana Rosas H, Potthast A, Schwartz EL, Fischl B. Accurate prediction of V1 location from cortical folds in a surface coordinate system. NeuroImage 39: 1585–1599, 2008 [DOI] [PMC free article] [PubMed] [Google Scholar]
- Innocenti et al., 1988. Innocenti GM, Berbel P, Clarke S. Development of projections from auditory to visual areas in the cat. J Comp Neurol 272: 242–259, 1988 [DOI] [PubMed] [Google Scholar]
- Innocenti and Clarke, 1984. Innocenti GM, Clarke S. Bilateral transitory projection to visual areas from auditory cortex in kittens. Brain Res 316: 143–148, 1984 [DOI] [PubMed] [Google Scholar]
- James et al., 2002. James TW, Humphrey GK, Gati JS, Servos P, Menon RS, Goodale MA. Haptic study of three-dimensional objects activates extrastriate visual areas. Neuropsychologia 40: 1706–1714, 2002 [DOI] [PubMed] [Google Scholar]
- Kahn and Krubitzer, 2002. Kahn DM, Krubitzer L. Massive cross-modal cortical plasticity and the emergence of a new cortical area in developmentally blind mammals. Proc Natl Acad Sci USA 99: 11429–11434, 2002 [DOI] [PMC free article] [PubMed] [Google Scholar]
- Karlen et al., 2006. Karlen SJ, Kahn DM, Krubitzer L. Early blindness results in abnormal corticocortical and thalamocortical connections. Neuroscience 142: 843–858, 2006 [DOI] [PubMed] [Google Scholar]
- Kauffman et al., 2002. Kauffman T, Theoret H, Pascual-Leone A. Braille character discrimination in blindfolded human subjects. Neuroreport 13: 571–574, 2002 [DOI] [PubMed] [Google Scholar]
- Kirkwood et al., 1996. Kirkwood A, Rioult MC, Bear MF. Experience-dependent modification of synaptic plasticity in visual cortex. Nature 381: 526–528, 1996 [DOI] [PubMed] [Google Scholar]
- Kujala et al., 1997. Kujala T, Alho K, Huotilainen M, Ilmoniemi RJ, Lehtokoski A, Leinonen A, Rinne T, Salonen O, Sinkkonen J, Standertskjöld-Nordenstam C-G, Näuäutäunen R. Electrophysiological evidence for cross-modal plasticity in humans with early- and late-onset blindness. Psychophysiology 34: 213–216, 1997 [DOI] [PubMed] [Google Scholar]
- Kujala et al., 1992. Kujala T, Alho K, Paavilainen P, Summala H, Näätänen R. Neural plasticity in processing of sound location by the early blind: an event-related potential study. Electroencephalogr Clin Neurophysiol 84: 469–472, 1992 [DOI] [PubMed] [Google Scholar]
- Kujala et al., 2005. Kujala T, Palva MJ, Salonen O, Alku P, Huotilainen M, Jarvinen A, Naatanen R. The role of blind humans' visual cortex in auditory change detection. Neurosci Lett 379: 127–131, 2005 [DOI] [PubMed] [Google Scholar]
- Kupers et al., 2007. Kupers R, Pappens M, de Noordhout AM, Schoenen J, Ptito M, Fumal A. rTMS of the occipital cortex abolishes Braille reading and repetition priming in blind subjects. Neurology 68: 691–693, 2007 [DOI] [PubMed] [Google Scholar]
- Leclerc et al., 2000. Leclerc C, Saint-Amour D, Lavoie ME, Lassonde M, Lepore F. Brain functional reorganization in early blind humans revealed by auditory event-related potentials. Neuroreport 11: 545–550, 2000 [DOI] [PubMed] [Google Scholar]
- Lessard et al., 1998. Lessard N, Paré M, Lepore F, Lassonde M. Early-blind human subjects localize sound sources better than sighted subjects. Nature 395: 278–280, 1998 [DOI] [PubMed] [Google Scholar]
- Liu et al., 2007. Liu Y, Yu C, Liang M, Li J, Tian L, Zhou Y, Qin W, Li K, Jiang T. Whole brain functional connectivity in the early blind. Brain 130: 2085–2096, 2007 [DOI] [PubMed] [Google Scholar]
- Macaluso et al., 2000. Macaluso E, Frith CD, Driver J. Modulation of human visual cortex by crossmodal spatial attention. Science 289: 1206–1208, 2000 [DOI] [PubMed] [Google Scholar]
- Mahon et al., 2009. Mahon BZ, Anzellotti S, Schwarzbach J, Zampini M, Caramazza A. Category-specific organization in the human brain does not require visual experience. Neuron 63: 397–405, 2009 [DOI] [PMC free article] [PubMed] [Google Scholar]
- Merabet et al., 2008. Merabet LB, Hamilton R, Schlaug G, Swisher JD, Kiriakopoulos ET, Pitskel NB, Kauffman T, Pascual-Leone A. Rapid and reversible recruitment of early visual cortex for touch. PLoS ONE 3: e3046, 2008 [DOI] [PMC free article] [PubMed] [Google Scholar]
- Merabet et al., 2007. Merabet LB, Swisher JD, McMains SA, Halko MA, Amedi A, Pascual-Leone A, Somers DC. Combined activation and deactivation of visual cortex during tactile sensory processing. J Neurophysiol 97: 1633–1641, 2007 [DOI] [PubMed] [Google Scholar]
- Morales et al., 2002. Morales B, Choi SY, Kirkwood A. Dark rearing alters the development of GABAergic transmission in visual cortex. J Neurosci 22: 8084–8090, 2002 [DOI] [PMC free article] [PubMed] [Google Scholar]
- Noppeney et al., 2003. Noppeney U, Friston KJ, Price CJ. Effects of visual deprivation on the organization of the semantic system. Brain 126: 1620–1627, 2003 [DOI] [PubMed] [Google Scholar]
- Pascual-Leone and Hamilton, 2001. Pascual-Leone A, Hamilton R. The metamodal organization of the brain. Prog Brain Res 134: 427–445, 2001 [DOI] [PubMed] [Google Scholar]
- Pelli, 1997. Pelli DG. The VideoToolbox software for visual psychophysics: transforming numbers into movies. Spat Vis 10: 437–442, 1997 [PubMed] [Google Scholar]
- Pietrini et al., 2004. Pietrini P, Furey ML, Ricciardi E, Gobbini MI, Wu WH, Cohen L, Guazzelli M, Haxby JV. Beyond sensory images: object-based representation in the human ventral pathway. Proc Natl Acad Sci USA 101: 5658–5663, 2004 [DOI] [PMC free article] [PubMed] [Google Scholar]
- Poirier et al., 2005. Poirier C, Collignon O, Devolder AG, Renier L, Vanlierde A, Tranduy D, Scheiber C. Specific activation of the V5 brain area by auditory motion processing: an fMRI study. Brain Res Cogn Brain Res 25: 650–658, 2005 [DOI] [PubMed] [Google Scholar]
- Poirier et al., 2006. Poirier C, Collignon O, Scheiber C, Renier L, Vanlierde A, Tranduy D, Veraart C, De Volder AG. Auditory motion perception activates visual motion areas in early blind subjects. NeuroImage 31: 279–285, 2006 [DOI] [PubMed] [Google Scholar]
- Postma et al., 2007. Postma A, Zuidhoek S, Noordzij ML, Kappers AM. Differences between early-blind, late-blind, and blindfolded-sighted people in haptic spatial-configuration learning and resulting memory traces. Perception 36: 1253–1265, 2007 [DOI] [PubMed] [Google Scholar]
- Ricciardi et al., 2006. Ricciardi E, Bonino D, Gentili C, Sani L, Pietrini P, Vecchi T. Neural correlates of spatial working memory in humans: a functional magnetic resonance imaging study comparing visual and tactile processes. Neuroscience 139: 339–349, 2006 [DOI] [PubMed] [Google Scholar]
- Ricciardi et al., 2007. Ricciardi E, Vanello N, Sani L, Gentili C, Scilingo EP, Landini L, Guazzelli M, Bicchi A, Haxby JV, Pietrini P. The effect of visual experience on the development of functional architecture in hMT+. Cereb Cortex 17: 2933–2939, 2007 [DOI] [PubMed] [Google Scholar]
- Roder et al., 1999. Roder B, Teder-Salejarvi W, Sterr A, Rosler F, Hillyard SA, Neville HJ. Improved auditory spatial tuning in blind humans. Nature 400: 162–166, 1999 [DOI] [PubMed] [Google Scholar]
- Rodman and Consuelos, 1994. Rodman HR, Consuelos MJ. Cortical projections to anterior inferior temporal cortex in infant macaque monkeys. Vis Neurosci 11: 119–133, 1994 [DOI] [PubMed] [Google Scholar]
- Sadato et al., 1998. Sadato N, Pascual-Leone A, Grafman J, Deiber MP, Ibanez V, Hallett M. Neural networks for Braille reading by the blind. Brain 121: 1213–1229, 1998 [DOI] [PubMed] [Google Scholar]
- Saenz et al., 2008. Saenz M, Lewis LB, Huth AG, Fine I, Koch C. Visual motion area MT+/V5 responds to auditory motion in human sight-recovery subjects. J Neurosci 28: 5141–5148, 2008 [DOI] [PMC free article] [PubMed] [Google Scholar]
- Sathian and Zangaladze, 2002. Sathian K, Zangaladze A. Feeling with the mind's eye: contribution of visual cortex to tactile perception. Behav Brain Res 135: 127–132, 2002 [DOI] [PubMed] [Google Scholar]
- Shams et al., 2005. Shams L, Iwaki S, Chawla A, Bhattacharya J, Early modulation of visual cortex by sound: an MEG study. Neurosci Lett 378: 76–81, 2005 [DOI] [PubMed] [Google Scholar]
- Shams et al., 2001. Shams L, Kamitani Y, Thompson S, Shimojo S. Sound alters visual evoked potentials in humans. Neuroreport 12: 3849–3852, 2001 [DOI] [PubMed] [Google Scholar]
- Shimizu et al., 1993. Shimizu Y, Saida S, Shimura H. Tactile pattern recognition by graphic display: importance of 3-D information for haptic perception of familiar objects. Percept Psychophys 53: 43–48, 1993 [DOI] [PubMed] [Google Scholar]
- Sterr et al., 1998. Sterr A, Muller MM, Elbert T, Rockstroh B, Pantev C, Taub E. Changed perceptions in Braille readers. Nature 391: 134–135, 1998 [DOI] [PubMed] [Google Scholar]
- Tropea et al., 2009. Tropea D, Van Wart A, Sur M. Molecular mechanisms of experience-dependent plasticity in visual cortex. Philos Trans R Soc Lond B Biol Sci 364: 341–355, 2009 [DOI] [PMC free article] [PubMed] [Google Scholar]
- Uhl et al., 1993. Uhl F, Franzen P, Podreka I, Steiner M, Deecke L. Increased regional cerebral blood flow in inferior occipital cortex and cerebellum of early blind humans. Neurosci Lett 150: 162–164, 1993 [DOI] [PubMed] [Google Scholar]
- Van Boven et al., 2000. Van Boven RW, Hamilton RH, Kauffman T, Keenan JP, Pascual-Leone A. Tactile spatial resolution in blind Braille readers. Neurology 54: 2230–2236, 2000 [DOI] [PubMed] [Google Scholar]
- Vanlierde et al., 2003. Vanlierde A, De Volder AG, Wanet-Defalque MC, Veraart C. Occipito-parietal cortex activation during visuo-spatial imagery in early blind humans. NeuroImage 19: 698–709, 2003 [DOI] [PubMed] [Google Scholar]
- Veraart et al., 1990. Veraart C, De Volder AG, Wanet-Defalque MC, Bol A, Michel C, Goffinet AM. Glucose utilization in human visual cortex is abnormally elevated in blindness of early onset but decreased in blindness of late onset. Brain Res 510: 115–121, 1990 [DOI] [PubMed] [Google Scholar]
- Voss et al., 2004. Voss P, Lassonde M, Gougoux F, Fortin M, Guillemot JP, Lepore F. Early- and late-onset blind individuals show supra- normal auditory abilities in far-space. Curr Biol 14: 1734–1738, 2004 [DOI] [PubMed] [Google Scholar]
- Wandell et al., 2007. Wandell BA, Dumoulin SO, Brewer AA. Visual field maps in human cortex. Neuron 56: 366–383, 2007 [DOI] [PubMed] [Google Scholar]
- Wanet-Defalque et al., 1988. Wanet-Defalque MC, Veraart C, De Volder A, Metz R, Michel C, Dooms G, Goffinet A. High metabolic activity in the visual cortex of early blind human subjects. Brain Res 446: 369–373, 1988 [DOI] [PubMed] [Google Scholar]
- Watkins et al., 2006. Watkins S, Shams L, Tanaka S, Haynes JD, Rees G. Sound alters activity in human V1 in association with illusory visual perception. NeuroImage 31: 1247–1256, 2006 [DOI] [PubMed] [Google Scholar]
- Weeks et al., 2000. Weeks R, Horwitz B, Aziz-Sultan A, Tian B, Wessinger CM, Cohen LG, Hallett M, Rauschecker JP. A positron emission tomographic study of auditory localization in the congenitally blind. J Neurosci 20: 2664–2672, 2000 [DOI] [PMC free article] [PubMed] [Google Scholar]
- Zhang et al., 2005. Zhang M, Mariola E, Stilla R, Stoesz M, Mao H, Hu X, Sathian K. Tactile discrimination of grating orientation: fMRI activation patterns. Hum Brain Mapp 25: 370–377, 2005 [DOI] [PMC free article] [PubMed] [Google Scholar]
Associated Data
This section collects any data citations, data availability statements, or supplementary materials included in this article.