Introduction
In addition to its role as a digestive and absorptive organ, the gut is also a sensing and signaling organ. In order to accomplish this sensing role, the gut uses neural and endocrine pathways to communicate with controllers of energy balance in the hypothalamus and hindbrain [1]. When nutrients are detected within the intestinal lumen, information is sent to the brain via either neural pathway, for example the vagal afferent pathway, or via humoral pathways. The gastrointestinal tract is primarily involved in the short-term factors that regulate food intake such as satiation, the physiological process of meal termination, whereas the long term control of body weight and food intake is a function of the central nervous system [2].
It is well known that dietary fat has a satiating effect [3, 4]. The mechanism by which dietary lipid is detected in the intestine involves the formation and secretion of chylomicrons and apolipoprotein A-IV [5], and subsequent activation of CCK1Rs, likely those expressed on vagal afferents terminating in the gut wall [6, 7]. This leads to lipid-induced inhibition of gastric emptying, gastric acid secretion and inhibition of food intake [8–10]. This feedback system allows the organism to match ingested nutrients with the digestive and absorptive capacity of the small intestine.
It is accepted that there is a positive relationship between the level of fat in the diet and the body weight, possibly contributing in the long-term to obesity [11]. Recent evidence suggests that changes in lipid detection in the gut may contribute to diet-induced obesity. Recently Covasa M. et al. showed that dietary fat sensing within the small intestine was reduced in rats adapted to a high fat, high energy diet [12]. Persistently elevated plasma levels of CCK accompanying long-term HF diet consumption, leads to several adaptive changes such as increased food consumption due to reduced sensitivity to peripheral CCK [13].
Although there is evidence to show rats freely fed a high fat diet result in diet-induced obesity and diminished sensitivity to detection of lipid in the intestine, little is known about how the feeding behavior, in terms of meal patterns changes with adaptation to a high fat diet, nor whether the change is dependent on the increase in body weight and adiposity. The purpose of the present study was to clearly identify whether the response to a high fat diet and its effects on feeding behavior and body weight is due to calorie content or to the dietary fat itself. This was accomplished by developing two precision pellet diets: one high in fat (38% fat/kcal HF), the other low in fat (10% fat/kcal LF), both having the same energy density. The first aim of the present study was to determine the effects of dietary fat on meal patterns. The second aim was to demonstrate how detection of dietary fat changes with sustained stimulation by analyzing meal patterns during long term maintenance on an isocaloric, isonitrogenous high fat diet.
Materials and Methods
Animals
Adult male Sprague Dawley rats weighing 245–320g at the start of the experiments were housed individually in cages and adapted to a 12-h light:dark cycle (lights off at 09:00 am) in a temperature-controlled room. Water was freely available throughout the experiments, and body weight was recorded daily. All experiments were performed in protocols reviewed and approved by the Institutional Animal Care and Use Committee, UC Davis.
Rats were maintained on either a 38% of energy fat diet (high fat diet: HF) or a 10% of energy fat diet (low fat diet: LF). The composition of the diets can be found in Table 1. Note that the LF diet is 263% higher in carbohydrate in the form of corn starch than the HF diet, and that the HF diet is 214% higher in fiber in the form of cellulose than the LF diet. Both diets were isonitrogenous (21% of energy) and isocaloric (3.4 kcal/g). The HF diet was offered ad libitum and LF rats were fed based on HF daily caloric intake.
Food intake analysis
Feeding patterns (number of meals, duration of meal, meal size, inter meal interval) were continuously measured from 09:00 am to 03:00 pm using food intake monitoring cages (The Habitest® System, Coulbourn Instruments) delivering 45 mg pellets (Bioserv Custom Dustless Precision Pellets). The pellet dispensers were controlled by infrared pellet-sensing photo beams. Individual pellets were delivered in response to removal of the previous pellet. Data was recorded and analyzed using Spike2 (version 5.07, Cambridge Electronic Design 1988–2004) and by SigmaStat (version3.11, Systat Software Inc. 2004) and Graph Prism® (version 3.02, GraphPad Software Inc. 1994–2000). A meal was defined as an acquisition of at least 5 pellets within 600s preceded or followed by 10 mins of no feeding. According to the literature Levitsky and Collier, 1968 and Castonguay et al. 1986 [14], 10 min of no interruption of the beam was used to define a meal. In addition, meal size and intermeal interval were optimized by varying the definition of meal size from 3 to 6 pellets per meal and observing the resulting food intake graph. The number of meals calculated by the software was compared to the actual number of meals determined by visually examining the food intake plot. Following each change in meal size and IMI definition, the meal parameters calculated by the analysis program (Spike2, Cambridge Electronic Design, Cambridge, England) was examined and compared to the food intake plot. The parameters were optimized by empirical comparison between the food intake plot and the meal definition criteria.
Body composition
At the end of the experimental period, rats were euthanized using an overdose of sodium pentobarbital (Nembutal, Abott Laboratories; 100mg/kg IP). Epididymal, mesenteric and retroperitoneal fat pads were dissected. Fat-pads weights were measured to 0.01 g.
Experimental Protocols
Experiment 1: Effect of a high fat diet on meal patterns
Rats (n=16) were maintained on the feeding protocol as described above for up to 21 days in order to determine the short-term effects of a high fat diet compared to a low fat diet on meal patterns.
Experiment 2: Effect of a long-term exposure to a high fat diet on meal patterns
Rats (n=16) were maintained on the same feeding protocol as described above for 8 weeks in order to determine the long term effects of a high fat diet on the meal patterns. There was no significant difference in the weight of the LF versus the HF group at the beginning of the experiment (LF: 284 ± 7 g, n=8; HF: 280 ± 8 g, n=8).
A subpopulation of these rats (n=8) were fed the LF diet for 9 days before randomizing them into low fat and high fat groups. Meal patterns were then analyzed according to the method described above. Data was analyzed using a one way-ANOVA with individual rat as an independent variable. After making sure there was no significant difference between rats (data not shown), we randomized the rats into two groups and we subjected the parameters to a one-way ANOVA with the diet as an independent variable.
Measurement of c-Fos protein expression in the NTS
After 8 weeks on the respective diets, rats (HF=5, LF=5), were gavaged with 1.5 mL lipid (Intralipid 20%; Baxter HealthCare Corp., Deenfield). After 90 min, animals were deeply anesthetized with sodium pentobarbital (Nembutal, Abott Laboratories; 100mg/kg IP), heparin was also injected (1 ml/kg IP) and rats transcardially perfused with phosphate buffered saline (PBS) buffer (0.1 M, pH 7.4) followed by 4% paraformaldehyde. The brains were removed, postfixed, and processed for DAB immunocytochemistry for c-Fos protein according to the protocol described by [5].
Free-floating brains sections (100 μm), obtained using a vibratome, were washed 3 times with PBS. Primary antibody (anti c-Fos, Santa Cruz) was applied at a dilution of 1:2,000 with 2% goat normal serum, 0.2% Triton X-100, 0.1% bovine serum albumin in PBS (GS-PBS) for 60 min at room temperature and at 4°C overnight with gentle agitation. The biotinylated secondary antibody (goat anti-rabbit immunoglobulin G; Vector Laboratories, Burlingame, CA) diluted 1:200 into GS-PBS was applied for 120 min at room temperature. Tissue was incubated for 3 hr in ABC solution (Standard Elite Vectastain ABC Kit, Vector Labs, Burlingame, CA, USA). DAB solution (Sigma, St. Louis, MO, USA) was added for a 5 minute incubation and then 50 μL H2O2-PBS (0.1 ml 30% H2O2: 10 mls PBS) was added to catalyze the DAB reaction; the reaction was stopped with a PBS wash. Tissue was thoroughly washed between each incubation period. Images were taken on a Provis microscope and analyzed using Paint Shop Pro, Edition 7. A stereotaxic rat brain atlas was used to determine the location of the NTS in each section of tissue (Paxinos & Franklin, 2001). A region of interest was drawn around the nucleus of the solitary tract (NTS) and the area postrema (AP) and all activated neurons in the NTS region of interest were counted. Neurons were determined to be immunopositive (above threshold) by their color and size. Representative sections were chosen to represent regions of the NTS: caudal NTS (Bregma −14.6 to −14.08 mm), mid-NTS (−14.08 to −13.30 mm) and rostral NTS (−13.30 to −12.80 mm). Three sections were chosen for each region for a total of nine sections per rat. The numbers of labeled neurons per section were averaged for each region for each rat; this value was used in subsequent statistical analyses.
Experiment 3: Relative preference for the low-fat food in rats fed high-fat or low-fat diets
A further group of rats (n=8) was adapted to their respective maintenance diets (HF or LF) for 1 week before preference testing began. Rats were fed ad libitum from 09:00 am to 03:00 pm and food deprived from 03:00 pm to 09:00 am during this period. Total food intake and weight were recorded daily. To prevent neophobia before the initiation of the preference testing, all rats were given access to each of the two diets (HF or LF) on 2 different occasions as previously described [13]. After the last day of diet exposure, 6-h 2-choice preference testing began from 09:00 am to 03:00 pm. For all rats, the 2 different diets were presented in two different cups containing 20 g of each diet during two consecutive days with the position of the diets within the cage (left or right side) randomized and alternated each test day. The food intake was measured at the end of the first, third, fifth and sixth hour.
Statistical Analysis
In Experiment 1, data from day 5 to day 18 were analyzed for the number of meals, the meal size, the eating rate, the inter meal interval, the meal duration and the total food intake per day and per rat; data were averaged for each day and each diet group. The parameters were subjected to a one-way ANOVA, with maintenance diet as independent variable.
In Experiment 2, the parameters from 16 rats fed for 8 weeks were subjected to a two-way ANOVA with maintenance diet and time as independent variables, data were not geometrically connected, and some subjects were missing data for some levels so we could not perform a Two Way Repeated Measures ANOVA. Data were compared between Week 2 and Week 8 in order to show an adaptation. All analyses were conducted using SigmaStat (version 3.11, Systat Software, Inc.) Differences among group means were analyzed using multiple comparison procedures (Holm-Sidak method), with overall significance level P<0.05.
In Experiment 3, we did the preference testing on 8 rats, 4 rats maintained on a HF diet and 4 rats maintained on a LF diet. Mean intakes for each rat were subjected to a two-way ANOVA, with maintenance and exposure diets as independent variables. Paired samples t-test did not reveal any significant side difference for any of the preference test; therefore, the left- and right-side intakes were pooled for further analysis. Mean intake at each time point for each rat was subjected to a two-way ANOVA, with maintenance and exposure diets as independent variables. The relative-preference was determined by the total amount consumed for each diet divided by the total amount of food consumed across all preference tests, multiplied by 100 to yield a percentage.
Results
Experiment 1: Effect of high vs. low fat diet on meal patterns
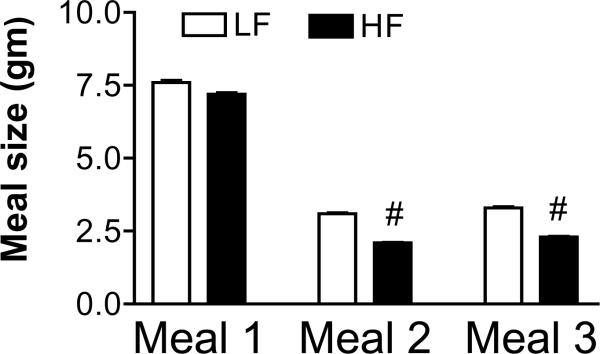
There was no significant difference in the quantity of food ingested in the first meal between the LF and the HF fed groups. However, the size of the 2nd and 3rd meal was significantly 34% and 31% smaller in the HF compared to LF group, respectively (P<0.001) (Fig. 1).
Figure 1.
Effect of isocaloric low and high fat diets on meal size. Rats ingesting the high fat diet were fed for 6 hours each day and rats ingesting the isocaloric low fat diet pair-fed. There was no significant difference in the size of the first meal; however, the size of the second and third meal is significantly reduced in the HF group compared to the LF fed rats. Values are means ± SEM (n=8 animals per group); # p<0.01.
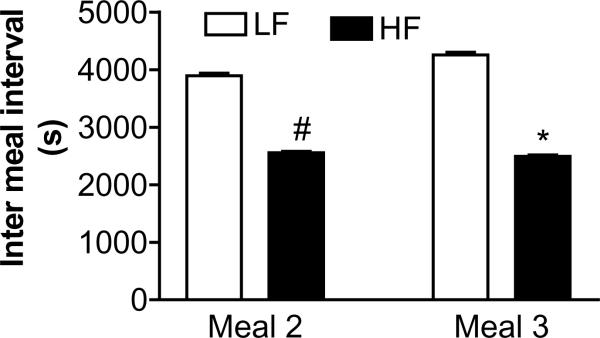
The meal frequency in the HF group was significantly 50% higher compared to the LF group (4 ± 0.2 vs. 6 ± 0.2, P<0.001). This increase in meal frequency was due to a significant shorter inter meal interval which was reduced by 36 % and 41 % for meal 1 and meal 2, respectively, in the HF compared to the LF fed rats (Fig. 2).
Figure 2.
Effect of diet on inter meal interval. The inter meal interval following meal 1 and meal 2 was significantly shorter in the rats ingesting the high fat diet compared to those ingesting the isocaloric low fat diet. Values are means ± SEM (n=8 animals per group) *p<0.05 #p<0.01
Experiment 2: Effect of long term exposure to a high fat diet on body weight, food intake and meal patterns
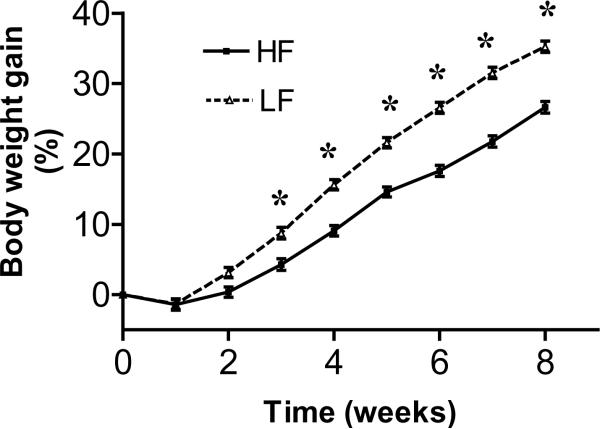
After 2 weeks, rats fed an isocaloric low fat diet gained more weight than rats on the isocaloric high fat diet (P<0.001); the difference was significant from week 2 to week 8 (Fig. 3). There was no significant difference in the adiposity index (calculated as the sum of the peritoneal, mesenteric and epididymal fat pads divided by the body weight) between the two groups at 4 weeks or at 8 weeks (4 weeks: LF: 2.51 ± 0.28 % vs. HF 2.16 ± 0.28%, n=4 in each group, NS; 8 weeks LF: 2.40 ± 0.39 % vs. HF: 2.98 ± 0.39, n=4 in each group, NS). There was a 62% increase in the fecal pellet output in the HF rats compared to the LF rats throughout the experiment (1.2 ± 0.1 vs. 3.2 ± 0.2 g/day, LF vs. HF, n=8 in each group, P <0.001).
Figure 3.
Increase in body weight in rats fed either isocaloric low fat or high fat diets over an 8 week period. Data expressed as the percent of body weight as mean ± SEM (n=8 animals per group, percent of body weight increase compared with body weight at time=0 week). LF vs. HF * p<0.05.
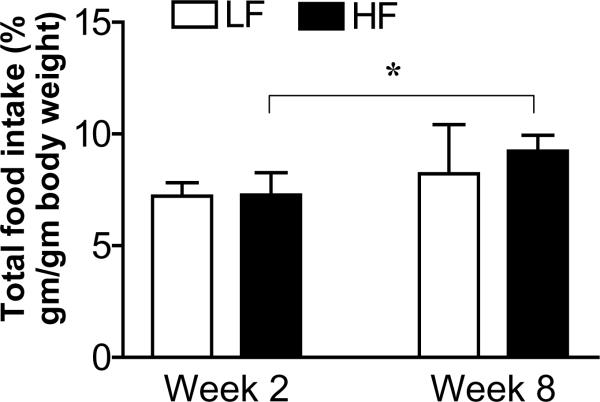
There was no significant difference in food intake (expressed as percent of food intake per g of body weight) between the HF and LF fed rats at week 2. However, after 8 weeks on the LF or HF diet, there was a significant 27% increase in the food intake in HF fed but not in the LF group (p<0.05) (Fig. 4).
Figure 4.
Food intake in isocaloric low and high fat fed rats at week 2 compared to week 8. At week 2, there is no significant difference in the daily food intake in either group of rats. However, after 8 weeks on the two different diets, those rats fed the high fat diet had a significantly increased daily food intake. Data is expressed as percent of total food intake/g body weight. Values are means ± SEM (n=8 animals in each group) *p<0.05.
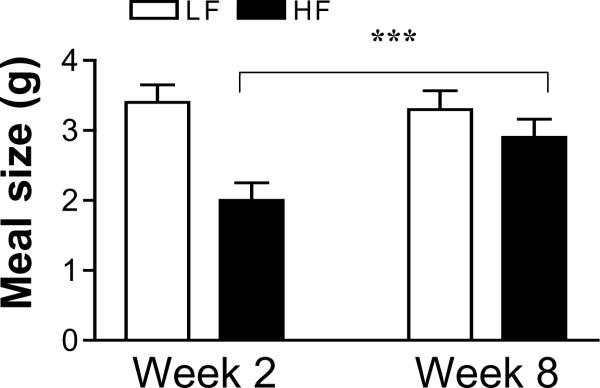
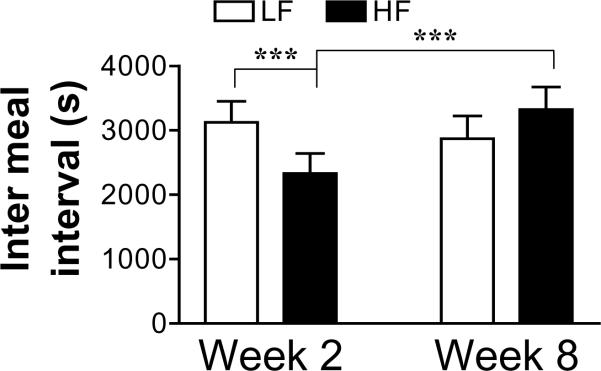
After maintenance on the HF diet for 8 weeks, the size of the meal 2 was significantly increased in the HF group compared to week 2 (P<0.05) (Fig. 5). In addition, there was a significant increase in the IMI after meal 2 in the HF fed rats (P<0.001) (Fig. 6). However, these parameters did not change from week 2 to week 8 in the rats fed the LF diet (Figs 5 and 6).
Figure 5.
The meal size of the second meal in isocaloric high fat and low fat fed rats at week 2 and week 8. The smaller meal size in the high fat fed in the first two weeks on the diet is abolished after 8 weeks on the diet. Values are means ± SEM (n=8 animals per group). *** p<0.001.
Figure 6.
The inter meal interval between meals 2 and 3 is significantly increased in the HF group after 8 weeks on the high fat diet. Values are means ± SEM (n=8 per group). ***p<0.001.
Effect of HF vs. LF diet on lipid-induced c-Fos protein expression in the NTS
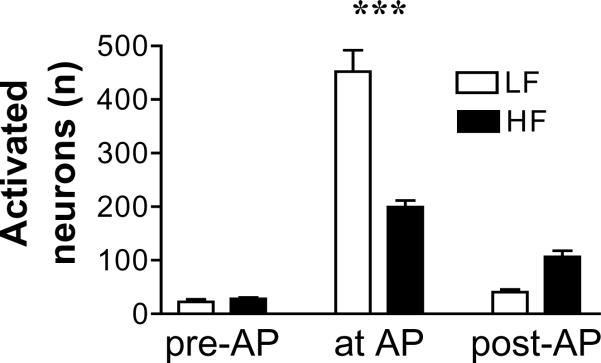
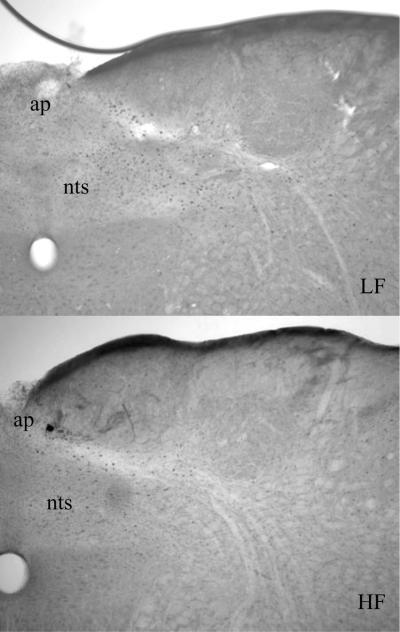
In rats fed the low fat diet for 8 weeks, there is a significant increase in the number of neurons expressing c-Fos in the NTS in response to intragastric gavage with lipid, the region in the brainstem where vagal afferents terminate, as previously described. However, in rats fed the HF diet for 8 weeks, the number of c-Fos immunoreactive in the NTS is significantly decreased compared to the LF fed rats (n=5 in each group, p<0.001) (Fig. 7a and 7b).
Figure 7a.
The number of neurons activated in the NTS by intragastric gavage of lipid is significantly decreased in rats fed a HF diet for 8 weeks than rats fed a LF diet for 8 weeks. ***p<0.001 (n=5 in each group).
Figure 7b.
Sections of the NTS at the Area Postrema demonstrating c-fos immunoreactivity by DAB staining in rats gavaged with intralipid (1.5 mL) after 8 weeks on a LF or a HF diet, 90 min after gavage. The HF group shows a decrease in c-fos immunoreactivity compared to the LF group. ap= area postrema; nts= nucleus tractus solitarius.
Experiment 3: Relative preference for the low-fat food in rats fed high-fat or low-fat diets
During preference testing, rats were presented with the two different diets on two different occasions to test the effect of the position of the food in the cage. There was no significant difference between the two different positions allowing us to pool the food intake between the two days. When LF-maintained rats were presented with the HF and the LF diets at the same time, rats ingested 5.0 ± 2.7 g of the HF diet and 18.9 ± 1.7 g of the LF diet within the 6-h test intake period. Similarly the HF-maintained rats presented with the HF and LF diets at the same time ingested 5.1 ± 3.2 g of the HF diet and 17.6 ± 3.0 g of the LF diet. Only the cumulative 6-h food intake is presented because the relative preference did not differ among the test. Rats both exhibited a significant preference for the LF diet when exposed to both of the diets at the same time. In addition, when exposed to a single diet during the acclimatization period the total food intake did not differ between the two maintained groups. There was even a tendency in the HF group to eat more than the LF group (P = 0.068).
Discussion
The results of the present study show that feeding a high fat diet compared to an isocaloric low fat diet elicits different feeding behavior, characterized by an increase in meal frequency and a decrease in meal size. This is consistent with the higher lipid content of the meal eliciting short-term satiety (smaller and more frequent meals). The results also show the satiating effect of the high fat diet is modified with time and decreases when rats are maintained on the diet. Thus, meal size and IMI increase over the 8 weeks on which the rats are maintained on the high fat diet. In addition, there was a significant increase in the amount of diet eaten in the high fat fed rats. This adaptation occurred in the absence of any change in adiposity or in body weight in the high fat fed group. Taken together, this data suggests that dietary fat is responsible for the changes in the feeding behavior observed with long-term adaptation to a diet of high fat content.
After the first meal, rats on the high fat diet ate smaller and more frequent meals than rats fed the low fat diet. This suggests that a signal generated within the meal involving the detection of dietary fat in the ingested food terminates a meal sooner. However, after the cessation of the meal, this decrease in meal size results in the initiation of the next meal sooner than in the LF fed rats, either due to the more rapid fading of the short-term satiety signal in the HF group or due to another signal that detects the overall calorie content of the prior meal. This finding is in contrast with previous findings where ingestion of a high fat isocaloric diet increased the meal size in rats [15]. However, this study used liquid diets as opposed to the solid diet used in the present study. Our data from the third experiment shows that rats prefer the LF to the HF diet, suggesting that the HF diet is less palatable than the LF diet. In addition, the eating rate was reduced in the HF group compared to the LF, again suggesting a less palatable food [16]. No significant difference was shown when both diets were presented to rats sequentially. There is evidence that the meal patterns of two diets with differing palatability depend upon the method of presentation with differences appearing when the diets are offered simultaneously but not when they are offered sequentially [17]. Therefore it is more likely that the HF diet is not as palatable as the LF diet, but it is unlikely that the rats fed a HF diet are experiencing an aversion to this diet. Thus, the differences in meal patterns observed between the two groups are the result of the interaction of palatability and composition of the diet.
The main differences were observed after the first meal; there was no significant difference in the size of the first meal, presumably due to the overnight fast and a relatively high orexigenic drive in all the rats, regardless of the fat content of the maintenance diet. When we expected that HF rats would be more satiated because they ate more fat and thus would have a longer IMI, they do a shorter IMI. However this shorter IMI was already described in previous experiment [15]. We have done an analysis of pre and post-meal correlation between meal size and IMI and we have not found any type of correlations. Furthermore, in the literature the correlation between meal size and IMI remains controversial. Le Magnen and colleagues consider that there is a correlation between meal size and IMI using long end-of-the-meal definition supporting the depletion-repletion idea of food intake [18]. However, when Castonguay and colleagues used a log-survivorship analysis of different end-of-the-meal definition, they concluded that there is no correlation between meal size and intermeal interval [14]. Differences in dietary fiber between the isocaloric HF and LF diets might not account for the reduced IMI effect as it has been demonstrated in a previous paper; rats fed HF diets, either high or low in fiber content, drank more oil than rats fed the HC diet implying that fiber does not affect postprandial satiety [19]. The fact that the meal size is decreased come together to support the hypothesis that fat by itself modify the meal patterns by increasing satiation but not satiety.
In this study we demonstrate for the first time that fat is not by itself responsible for the increase of body weight, at least for a relatively short time of 8 weeks. In previous studies using high fat, high energy diets ad libitum there is a significant increase in body weight and adiposity in the high fat fed rats. In the present study, we controlled the caloric content and the fat content intake in both groups so that we could separate the effect of fat from that of calories or adiposity. During the 8 weeks period on the diet, the increase in body weight in the HF group is smaller than the LF group. This has been described in a previous paper were rats were fed an isocaloric HF diet [20]. Palatability of the food could also be responsible for the difference between the two groups as palatable food can offset normal appetite regulation and therefore body weight control [21], the high fiber content of the HF food also prevent overeating and excessive weight gain [22] and finally it has been shown that daily fat excretion was greater in high fiber food compared to normal fiber food [23], thus this over excretion of fat in the HF group combined with the higher palatability of the food in the LF group could explain the difference in body weight increase.
The second aim of the study was to demonstrate that feeding behavior can be modified after a long-term exposure to a HF diet. We found that the intrameal satiety or satiation (reduced meal size) of meal 2 and meal 3 was reversed after 8 weeks on the HF diet. In addition, there is no significant difference in the inter meal interval before the third meal between the two groups. This suggests that adaptation to the short term satiety signal has occurred in the absence of any increase in body weight or adiposity compared to the LF fed rats. Thus it would seem that the adaptation occurs solely in response to the level of dietary fat content. It is likely that this adaptive response involves the vagal afferent pathway and CCK, as activation of neurons in the NTS following an intragastric lipid challenge, as revealed by immunoreactivity for c-Fos, is markedly reduced in the HF compared to the LF rats. Thus, although the only variable in these experiments is the level of ingested fat, the adaptation to ingested lipid involves the same deficit as seen in other studies employing high energy high fat diets [24].
It has already been described that maintenance of rats on high-fat diets reduces sensitivity to some satiety peptide signals. Reduced sensitivity to satiety signals might contribute to overeating and obesity often observed when rats are maintained on high-fat diets [25] which is often associated with a decrease sensitivity to CCK [13, 26] or PYY deficiency that would reduce satiety and could thus reinforce obesity [27]. Little evidence has been shown concerning a potential adaptation of the neural center of the control of food intake: the hypothalamus, even though it has been shown that after a long-term exposure there was a reduction in the Apo A-IV mRNA production in the hypothalamus after a lipid-preload [28]. The increase in the IMI had already been described in the hyperphagia of a Sprague-Dawley rat model of chronic diet-induced obesity [29]. This confirms that the changes we see are due to adaptation to the high-fat content of the diet and not the high fiber. Taking these data altogether, it is more likely that the changes we observed with time are due to a decrease in the sensitivity of the vagal-afferent to detect fat in the high fat group by decreased sensitivity to CCK or by a decrease in the release of PYY.
Finally these changes could be due to an adaptation of the digestion or the absorption of the dietary lipid. It has been shown that there is an effect of the amount of fat on the adaptive response of rat pancreatic lipase to dietary fat [30]. Pancreatic lipase activity adapts primarily to the amount of dietary fat and though increases in HF rats but some results indicate that a source of dietary fiber, cellulose, can affect the availability of enzymes and bile acids in the small intestine [31–33]. Although fiber reduces the absorption rate of fat and carbohydrate because it decreases the availability of the enzymes and bile to digest fat there is no significant effect of cellulose on oleic acid absorption [34]. Fat could therefore still be sensed through free fatty acids like oleic acid within the small intestine even though triglycerides are not broken down yet.
In conclusion, this study demonstrates for the first time that fat by itself can signal and trigger satiation by a mechanism not dependent on the caloric content of the food. In addition, this data show that adaptation to dietary fat does not involve an increase in adiposity or body weight. This adaptive response to dietary fat may contribute to altered body weight regulation with a high fat diet.
Table 1.
Composition of the two isocaloric, isonitrogenous Low Fat and High Fat Diets
| Ingredients | Low Fat Diet (g/kg) | High Fat Diet (g/kg) |
|---|---|---|
| Casein | 175 | 175 |
| DL-Met or L-cys | 3 | 3 |
| Corn Starch | 415 | 158 |
| Maltodextrin | 100 | 100 |
| Sucrose | 80 | 80 |
| Cellulose | 136 | 291 |
| Oil (Soy) | 38 | 140 |
| MM TD.79055 Ca-P defic. | 16 | 16 |
| CaHPO4 | 15 | 15 |
| CaCO3 | 7 | 7 |
| Vitamin mix AIN-93G | 12 | 12 |
| Choline Bitatrate | 3 | 3 |
| Total | 1,000 | 1,000 |
Footnotes
Publisher's Disclaimer: This is a PDF file of an unedited manuscript that has been accepted for publication. As a service to our customers we are providing this early version of the manuscript. The manuscript will undergo copyediting, typesetting, and review of the resulting proof before it is published in its final citable form. Please note that during the production process errors may be discovered which could affect the content, and all legal disclaimers that apply to the journal pertain.
Reference List
- 1.Strader AD, Woods SC. Gastrointestinal hormones and food intake. Gastroenterology. 2005;128(1):175–91. doi: 10.1053/j.gastro.2004.10.043. [DOI] [PubMed] [Google Scholar]
- 2.Burton-Freeman B, Gietzen DW, Schneeman BO. Meal pattern analysis to investigate the satiating potential of fat, carbohydrate, and protein in rats. Am J Physiol. 1997;273(6 Pt 2):R1916–22. doi: 10.1152/ajpregu.1997.273.6.R1916. [DOI] [PubMed] [Google Scholar]
- 3.Greenberg D, et al. Differential satiating effects of fats in the small intestine of obesity-resistant and obesity-prone rats. Physiol Behav. 1999;66(4):621–6. doi: 10.1016/s0031-9384(98)00336-9. [DOI] [PubMed] [Google Scholar]
- 4.Lucas F, Sclafani A. Differential reinforcing and satiating effects of intragastric fat and carbohydrate infusions in rats. Physiol Behav. 1999;66(3):381–8. doi: 10.1016/s0031-9384(98)00275-3. [DOI] [PubMed] [Google Scholar]
- 5.Whited KL, et al. Apolipoprotein A-IV is involved in detection of lipid in the rat intestine. J Physiol. 2005;569(Pt 3):949–58. doi: 10.1113/jphysiol.2005.097634. [DOI] [PMC free article] [PubMed] [Google Scholar]
- 6.Moran TH, Ladenheim EE, Schwartz GJ. Within-meal gut feedback signaling. Int J Obes Relat Metab Disord. 2001;25(Suppl 5):S39–41. doi: 10.1038/sj.ijo.0801910. [DOI] [PubMed] [Google Scholar]
- 7.Reidelberger RD, et al. Abdominal vagal mediation of the satiety effects of CCK in rats. Am J Physiol Regul Integr Comp Physiol. 2004;286(6):R1005–12. doi: 10.1152/ajpregu.00646.2003. [DOI] [PubMed] [Google Scholar]
- 8.Glatzle J, et al. Chylomicron components activate duodenal vagal afferents via a cholecystokinin A receptor-mediated pathway to inhibit gastric motor function in the rat. J Physiol. 2003;550(Pt 2):657–64. doi: 10.1113/jphysiol.2003.041673. [DOI] [PMC free article] [PubMed] [Google Scholar]
- 9.Tso P, Liu M, Kalogeris TJ. The role of apolipoprotein A-IV in food intake regulation. J Nutr. 1999;129(8):1503–6. doi: 10.1093/jn/129.8.1503. [DOI] [PubMed] [Google Scholar]
- 10.Whited KL, et al. Targeted disruption of the murine CCK1 receptor gene reduces intestinal lipid-induced feedback inhibition of gastric function. Am J Physiol Gastrointest Liver Physiol. 2006;291(1):G156–62. doi: 10.1152/ajpgi.00569.2005. [DOI] [PubMed] [Google Scholar]
- 11.Lissner L, Heitmann BL. Dietary fat and obesity: evidence from epidemiology. Eur J Clin Nutr. 1995;49(2):79–90. [PubMed] [Google Scholar]
- 12.Covasa M, Ritter RC. Reduced sensitivity to the satiation effect of intestinal oleate in rats adapted to high-fat diet. Am J Physiol. 1999;277(1 Pt 2):R279–85. doi: 10.1152/ajpregu.1999.277.1.R279. [DOI] [PubMed] [Google Scholar]
- 13.Savastano DM, Covasa M. Adaptation to a high-fat diet leads to hyperphagia and diminished sensitivity to cholecystokinin in rats. J Nutr. 2005;135(8):1953–9. doi: 10.1093/jn/135.8.1953. [DOI] [PubMed] [Google Scholar]
- 14.Castonguay TW, Kaiser LL, Stern JS. Meal pattern analysis: artifacts, assumptions and implications. Brain Res Bull. 1986;17(3):439–43. doi: 10.1016/0361-9230(86)90252-2. [DOI] [PubMed] [Google Scholar]
- 15.Warwick ZS, et al. Behavioral components of high-fat diet hyperphagia: meal size and postprandial satiety. Am J Physiol Regul Integr Comp Physiol. 2000;278(1):R196–200. doi: 10.1152/ajpregu.2000.278.1.R196. [DOI] [PubMed] [Google Scholar]
- 16.Swiergiel AH, Cabanac M. Lack of caloric regulation in rats during short-term feeding. Am J Physiol. 1989;256(2 Pt 2):R518–22. doi: 10.1152/ajpregu.1989.256.2.R518. [DOI] [PubMed] [Google Scholar]
- 17.Sunday SR, Sanders SA, Collier G. Palatability and meal patterns. Physiol Behav. 1983;30(6):915–8. doi: 10.1016/0031-9384(83)90257-3. [DOI] [PubMed] [Google Scholar]
- 18.Le Magnen J, Devos M. Meal to meal energy balance in rats. Physiol Behav. 1984;32(1):39–44. doi: 10.1016/0031-9384(84)90067-2. [DOI] [PubMed] [Google Scholar]
- 19.Reed DR, Friedman MI. Diet composition alters the acceptance of fat by rats. Appetite. 1990;14(3):219–30. doi: 10.1016/0195-6663(90)90089-q. [DOI] [PubMed] [Google Scholar]
- 20.Ramirez I, Friedman MI. Dietary hyperphagia in rats: role of fat, carbohydrate, and energy content. Physiol Behav. 1990;47(6):1157–63. doi: 10.1016/0031-9384(90)90367-d. [DOI] [PubMed] [Google Scholar]
- 21.Erlanson-Albertsson C. How palatable food disrupts appetite regulation. Basic Clin Pharmacol Toxicol. 2005;97(2):61–73. doi: 10.1111/j.1742-7843.2005.pto_179.x. [DOI] [PubMed] [Google Scholar]
- 22.Van Itallie TB. Dietary fiber and obesity. Am J Clin Nutr. 1978;31(10 Suppl):S43–52. doi: 10.1093/ajcn/31.10.S43. [DOI] [PubMed] [Google Scholar]
- 23.Munakata A, et al. Effects of dietary fiber on gastrointestinal transit time, fecal properties and fat absorption in rats. Tohoku J Exp Med. 1995;176(4):227–38. doi: 10.1620/tjem.176.227. [DOI] [PubMed] [Google Scholar]
- 24.Covasa M, Grahn J, Ritter RC. Reduced hindbrain and enteric neuronal response to intestinal oleate in rats maintained on high-fat diet. Auton Neurosci. 2000;84(1–2):8–18. doi: 10.1016/S1566-0702(00)00176-4. [DOI] [PubMed] [Google Scholar]
- 25.Covasa M, Ritter RC. Rats maintained on high-fat diets exhibit reduced satiety in response to CCK and bombesin. Peptides. 1998;19(8):1407–15. doi: 10.1016/s0196-9781(98)00096-5. [DOI] [PubMed] [Google Scholar]
- 26.Covasa M, Marcuson JK, Ritter RC. Diminished satiation in rats exposed to elevated levels of endogenous or exogenous cholecystokinin. Am J Physiol Regul Integr Comp Physiol. 2001;280(2):R331–7. doi: 10.1152/ajpregu.2001.280.2.R331. [DOI] [PubMed] [Google Scholar]
- 27.le Roux CW, et al. Attenuated peptide YY release in obese subjects is associated with reduced satiety. Endocrinology. 2006;147(1):3–8. doi: 10.1210/en.2005-0972. [DOI] [PubMed] [Google Scholar]
- 28.Liu M, et al. Obesity induced by a high-fat diet downregulates apolipoprotein A-IV gene expression in rat hypothalamus. Am J Physiol Endocrinol Metab. 2004;287(2):E366–70. doi: 10.1152/ajpendo.00448.2003. [DOI] [PubMed] [Google Scholar]
- 29.Farley C, et al. Meal pattern analysis of diet-induced obesity in susceptible and resistant rats. Obes Res. 2003;11(7):845–51. doi: 10.1038/oby.2003.116. [DOI] [PubMed] [Google Scholar]
- 30.Sabb JE, Godfrey PM, Brannon PM. Adaptive response of rat pancreatic lipase to dietary fat: effects of amount and type of fat. J Nutr. 1986;116(5):892–9. doi: 10.1093/jn/116.5.892. [DOI] [PubMed] [Google Scholar]
- 31.Forman LP, Schneeman BO. Effects of dietary pectin and fat on the small intestinal contents and exocrine pancreas of rats. J Nutr. 1980;110(10):1992–9. doi: 10.1093/jn/110.10.1992. [DOI] [PubMed] [Google Scholar]
- 32.Schneeman BO, Gallaher D. Changes in small intestinal digestive enzyme activity and bile acids with dietary cellulose in rats. J Nutr. 1980;110(3):584–90. doi: 10.1093/jn/110.3.584. [DOI] [PubMed] [Google Scholar]
- 33.Sommer H, Kasper H. Effect of long-term administration of dietary fiber on the exocrine pancreas in the rat. Hepatogastroenterology. 1984;31(4):176–9. [PubMed] [Google Scholar]
- 34.Vahouny GV, et al. Dietary fiber and intestinal adaptation: effects on lipid absorption and lymphatic transport in the rat. Am J Clin Nutr. 1988;47(2):201–6. doi: 10.1093/ajcn/47.2.201. [DOI] [PubMed] [Google Scholar]


