

Abstract
A method has been developed to identify oligonucleotide-peptide heteroconjugates by accurate mass measurements using mass spectrometry. The fractional mass (the decimal fraction mass value following the monoisotopic nominal mass) for peptides and oligonucleotides is different due to their differing molecular compositions. This property has been used to develop the general conditions necessary to differentiate peptides and oligonucleotides from oligonucleotide-peptide heteroconjugates. Peptides and oligonucleotides generated by the theoretical digestion of various proteins and nucleic acids were plotted as nominal mass versus fractional mass. Such plots reveal that three nucleotides cross-linked to a peptide produce enough change in the fractional mass to be recognized from non-crosslinked peptides at the same nominal mass. Experimentally, a cytochrome c digest was spiked with an oligonucleotide-peptide heteroconjugate and conditions for analyzing the sample using liquid chromatography-mass spectrometry were optimized. Upon analysis of this mixture, all detected masses were plotted on a fractional mass plot and the heteroconjugate could be readily distinguished from non-crosslinked peptides. The method developed here can be incorporated into a general proteomics-like scheme for identifying protein-nucleic acid cross-links, and this method is equally applicable to characterizing cross-links generated from protein-DNA and protein-RNA complexes.
Keywords: Fractional mass, mass excess, mass defect, cross-linking, oligonucleotide-peptide heteroconjugate
Nucleic acid and protein complexes play crucial roles in cell functions such as DNA replication, packaging, repair and transcription and RNA maturation, transport and translation.1-3 Biophysical methods such as X-ray crystallography, nuclear magnetic resonance (NMR) and cryo-electron microscopy are typically used to gain insight into the structure and function of these complexes.4-8 While X-ray crystallography and NMR can provide high resolution information, not all nucleic acid-protein complexes are readily characterized by these methods. Cross-linking combined with mass spectrometry (MS) is one alternative approach for structurally characterizing nucleic acid-protein complexes, although sample preparation, analysis and data interpretation are not trivial.9
Cross-links, once identified, impose a distance constraint on the complex and allow one to draw conclusions on the three-dimensional structure of the complex by molecular modeling.10 The combination of cross-linking, MS characterization, and molecular modeling has been called mass spectrometry in three dimensions (MS3D), due to its ability to generate three-dimensional structures of intermediate resolution from mass spectrometric data. This approach has been demonstrated to be particularly useful for molecules that are too large to be determined by NMR or are too flexible for X-ray crystallography.11
Identifying specific sites of cross-linking by mass spectrometry can be difficult due to the low abundance of cross-linked species and the large background of non-cross linked sample. A number of strategies have been developed to facilitate their identification, primarily for structural studies of proteins and multi-protein complexes.12-20 The characterization of nucleic acid-protein cross-links by mass spectrometry is not as common as characterizing protein-protein cross-links primarily due to the differing chemical properties of the two moieties as well as challenges in sample purification and preparation.21 Moreover, bifunctional reagents for cross-linking nucleic acids and proteins are limited compared to the reagents available for protein-protein cross-linking. However, there are a number of traditional biochemical approaches to nucleic acid-protein cross-linking that can be used with mass spectrometry detection. Zero-length cross-linking is a method in which a covalent bond is formed between the interacting partners directly without an intervening linker. This can be advantageous because it is less likely for the structure of the complex to be altered due to the presence of the cross-linker. Chemical reagents such as carbodiimides or UV light by itself can generate zero-length cross-linking. One disadvantage of zero-length cross-linking, when mass spectrometry is used to analyze the products, is the inability to incorporate any isotopes or cleavable linkers that could enhance detectability by mass spectrometry.
As elegantly demonstrated by the work of Urlaub and co-workers, nucleic acid-protein cross-links can be characterized by matrix-assisted laser desorption/ionization mass spectrometry (MALDI-MS) providing appropriate sample preparation and purification strategies are employed.22-24 Originally, extensive chromatographic purification was used to isolate sufficient amounts of cross-links in a form amenable to mass spectrometry. More recently, improvements to MALDI sample preparation have reduced sample requirements from the pmol to the fmol range.22 These researchers have also demonstrated that affinity purification of cross-links is also an effective strategy for subsequent mass spectrometry analysis.25
The mass accuracy of mass spectrometers has improved over time, and exact mass measurements remain an invaluable approach for identifying samples. Another application of accurate mass measurements is the determination of the mass excess for a molecule, which is the difference between the measured mass and nominal mass.26 Fractional mass, which is the mass value following the decimal point, contains information about the molecule that is associated with accurate mass and the following discussion holds for both fractional mass and mass excess. Except for carbon, each element has a mass excess in which the exact mass is higher than the nominal mass (e.g., H, 1.00783 Da; N, 14.00307 Da) or mass deficiency in which the exact mass is less than the nominal mass (e.g., O, 15.99491 Da; S, 31.97207 Da, P, 30.973763 Da). Because the relative percentages of such elements differ in the molecular composition of samples including biomolecules such as carbohydrates, lipids, nucleic acids and proteins, mass excess (or fractional mass) has been used as a means of distinguishing samples among compound classes.27-30
Covalent modification of peptides such as glycosylation, lipidation, and phosphorylation can also change the fractional mass of peptides and has been used for their identification.31-33 Glycosylation and phosphorylation lower the fractional mass of the peptide due to the high percentage of oxygen (glycosylation) or phosphorus (phosphorylation) while lipidation increases the fractional mass due to increased percentage of hydrogen in the modified peptide. Fractional mass increases as the mass of the modification relative to the molecular mass of the peptide increases. Therefore, lower molecular weight peptides have a more pronounced fractional mass change due to the modification and are easier to distinguish than higher molecular weight peptides.
Here, we show that it is possible to distinguish oligonucleotides or peptides from oligonucleotide-peptide cross-links based on fractional mass. The advantage of this approach is that it provides a method that can facilitate identifying cross-links in the presence of a large number of non-cross-links without requiring isotopically labeled or chemically cleaved cross-linking reagents. Moreover, this approach can be used with either MALDI or ESI mass spectrometry and is compatible with prior developments and improvements in nucleic acid-protein cross-link isolation and purification.
EXPERIMENTAL
Theoretical enzymatic digestion of Nucleic Acids and Proteins
Protein and nucleic acid sequences for Escherichia coli K12 (accession number NC_000913) and Mycoplasma genitalium G37 (accession number NC_000908) were obtained from the NCBI database. Protein sequences were enzymatically digested in silico using the MS-Digest tool in ProteinProspector (www.abcc.ncifcrf.gov/prospect.htm). Oxidation of methionine and carbamidomethylation of cysteine were considered as possible modifications. No missed cleavages were allowed for M. genitalium and up to three missed cleavages were allowed for E. coli ribosomal proteins. ESI-FT-ICR was chosen as the instrument type to obtain accurate monoisotopic masses of the theoretical digests. RNA sequences were digested theoretically using the endonuclease options available in the MongoOligo mass calculator (library.med.utah.edu/masspec/mongo.htm). Monoisotopic masses of the digests were obtained and both ends of the sequence were chosen to have free hydroxyls. All theoretical masses were imported to Microsoft EXCEL for further manipulation and generation of plots.
Materials
An oligonucleotide-peptide heteroconjugate containing an 11-amino acid residue peptide conjugated t o a 5-mer oligonucleotide via a hexylaminolinker on the aspartic acid residue (Ac-GARGAD(agcca)RAVLA-NH2) was obtained from BiomerTech (Hayward, CA) and purified as described. Cytochrome c (bovine heart), Fibronectin Adhesion-promoting peptide, Influenza Hemagglutinin peptide and Delta Sleep Inducing peptide were purchased from Sigma-Aldrich (St. Louis, MO) and used as received. HPLC grade acetonitrile (ACN) and water were obtained from TEDIA (Fairfield, OH). Formic acid (FA), acetic acid and triethylamine were obtained from Fisher Scientific (Pittsburgh, PA). Trypsin (sequencing grade) was obtained from Promega (Madison, MI).
Heteroconjugate Purification
Triethylammonium acetate (TEAA) was prepared by slowly adding triethylamine to acetic acid and adjusting the pH to 6.5. The heteroconjugate was received as a crude reaction mixture and purified on an anion exchange column (Nucleogen 60-7 DEAE) with a 30 min gradient of 1-60% B (A: 25 mM TEAA (pH 6.5) 20% ACN; B: 1 M TEAA (pH 6.5) 20% ACN) using a LaChrome Elite Hitachi HPLC equipped with a diode array detector. Fractions were collected and analyzed by MALDI-MS to confirm the presence of the heteroconjugate. Those fractions containing the heteroconjugate were evaporated to dryness and resuspended in water.
Cytochrome c digestion
Cytochrome c was digested with trypsin to generate the model test sample to evaluate the effectiveness of fractional mass as an identifier of oligonucleotide-peptide heteroconjugates. One μg of trypsin was added to five nmol cytochrome c in 25 mM ammonium bicarbonate (reaction volume 55 μL) and incubated at 37 °C overnight. Two microliters of the digest were added to 5 μL of the heteroconjugate solution (~ 20 μM based on the UV absorbance at 260). The sample was diluted to a volume of 37 μL using 25 mM TEAA (pH 6.5) in 20% aqueous acetonitrile, and 1 μL was injected on the capillary column and analyzed by LC-MS/MS.
Mass Spectrometry
All LC-MS/MS experiments were performed using an Ultimate capillary LC (Dionex, Sunnyvale, CA) on-line with a Thermo LTQ-FT (Thermo Scientific) mass spectrometer. A C18 capillary column (Xbridge, 15 cm, 75 μm, Waters, Milford, MA) at a flow rate of 200 nL/min was used for the separation step. Samples were analyzed in data dependent mode with one FT scan followed by 6 MS/MS scans in the ion trap. The isolation width was 2.00 and the source voltage was 2.00 kV. The minimum ion intensity for triggering MS/MS was set at 1000 counts. Direct infusion analysis of the sample prepared in a solution of 5 mM ammonium acetate in 50% aqueous acetonitrile or 0.1% formic acid in 50% aqueous acetonitrile was performed at a flow rate of 300 nL/min. A pulled capillary tip (made in house) and a source voltage of 2.00 kV were used during direct infusion. DTA files were generated by setting the precursor tolerance, group scan, and min group count to zero, intensity threshold to 100 and minimum ion threshold to five. The mass list in the lcq_dta file was imported to Microsoft EXCEL for further data analysis.
RESULTS AND DISCUSSION
Theoretical fractional mass plots
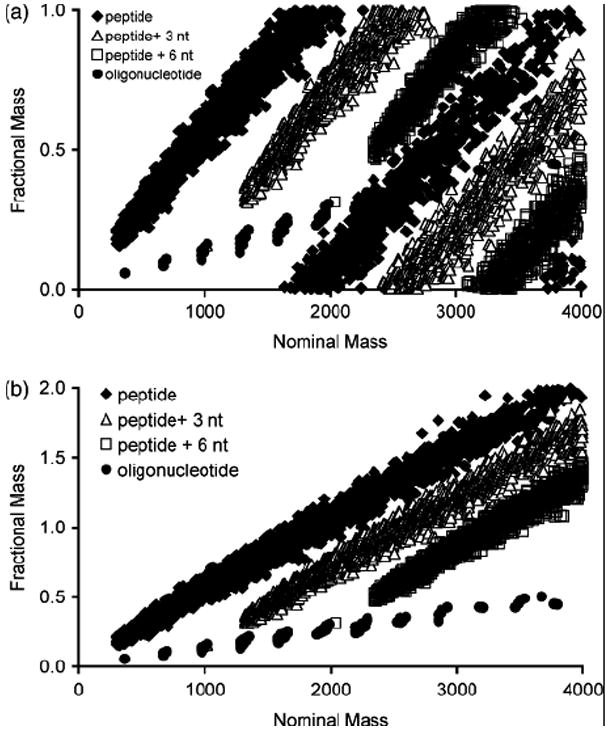
To initially examine the feasibility of using fractional mass to identify oligonucleotide-peptide cross-links in mass spectral data, theoretical tryptic digests of E. coli small subunit ribosomal proteins and the RNase T1 digest of 16S ribosomal RNA were generated and plotted as nominal mass vs. fractional mass in Figure 1a. For the tryptic peptides from this data set, a periodic trend is seen with peptides grouped together in a series whose mass excess repeats approximately every 2000 Da. In Figure 1b, the masses are re-plotted to establish the trend line for the fractional masses of peptides and oligonucleotides using an approach similar to that described earlier by Bruce and co-workers.33
Figure 1.

(a) Fractional mass plot for peptides and oligonucleotides from E. coli small ribosomal subunit. (b) Linear representation of the fractional mass plot in (a) as described in the text. The peptide fractional mass trend line fits the equation, fractional mass = 5.030 × 10⁻⁴ * MP + 5.313 × 10⁻², and the oligonucleotide fractional mass trend line fits the equation, fractional mass = 1.287 × 10⁻⁴ * MO + 1.018 × 10⁻².
This pattern has been described as allowed zones (zones occupied by peptides on the plot) and forbidden zones (zones unoccupied by peptides on the plot).34-35 Forbidden zones have been used for the identification of glycopeptides previously.31 The resulting linear plot for the tryptic digest of small subunit ribosomal proteins has a slope of 5.030 × 10⁻⁴ and the corresponding linear plot for the RNase T1 digest of 16S rRNA has a slope of 1.287 × 10⁻⁴. Because each nucleotide residue contains a relatively higher proportion of oxygen (and phosphorus) than each amino acid residue, the fractional mass for oligonucleotides increases at a significantly slower rate than the fractional mass for peptides. Thus, peptides and oligonucleotides can be distinguished based on their differences in fractional mass, with this differentiation being more pronounced at higher nominal mass values.
We next set out to determine if the trend lines obtained in Figure 1b are representative for all proteins and nucleic acids for any particular organism. To do this, proteins, genes (as protein coding DNA sequences) and rRNAs from M. genitalium, which has a genome size of 580 kb and 486 genes, were theoretically digested and plotted on the same plot (Figure 2). As seen in Figure 2, peptides and oligonucleotides, even from this larger data set, still yield significantly different fractional mass trend lines. Thus, it does appear to be a general trait for proteins and nucleic acids within an organism.
Figure 2.

(a) Fractional mass plot for peptides and oligonucleotides generated by theoretically digesting proteins, protein coding genes (as DNA sequences) and rRNA from Mycoplasma genitalium. (b) Linear representation of the fractional mass plot in (a) as described in the text. These trend lines are not significantly different than those found for a smaller nucleic acid and protein population in Figure 1b.
Once we established that oligonucleotides and peptides yield different fractional mass trend lines, the next issue to address was whether heteroconjugates containing both a peptide and an oligonucleotide moiety would have fractional mass values that lie within the areas between the two individual trend lines. If so, then nucleic acid-protein cross-links should be identifiable by mass spectrometric analysis of the enzymatically digested sample.
Shown in Figure 3 are plots generated by adding the averaged mass for 3 or 6 ribonucleotides to the theoretical tryptic peptides from ribosomal proteins (no cross-linking reagent was considered). As is evident from this plot, it is possible to distinguish oligonucleotides, peptides and heteroconjugates based on accurate mass measurements that reveal the fractional mass value except where they overlap between m/z 2,000 – 3,000. Masses that fall on the peptide or oligonucleotide lines can be considered peptides or oligonucleotides, respectively. Cross-links will have a fractional mass in between peptides and oligonucleotides. Obviously, heteroconjugates containing small oligonucleotides relative to the peptide will fall closer to the peptide trend line, while heteroconjugates containing large oligonucleotides relative to the peptide will fall closer to the oligonucleotide trend line.
Figure 3.
(a) Fractional mass plot for peptides and oligonucleotides from E. coli small ribosomal subunit, and hypothetical cross-links generated by adding 3 or 6 nucleotide (nt) residues to tryptic peptides of the E. coli 30S ribosomal subunit. Oligonucleotide:peptide heteroconjugates can be visually distinguished from peptides or oligonucleotides alone via the fractional mass plot. (b) Linear representation of the fractional mass plot in (a) as described in the text.
A review of this plot reveals two features regarding the heteroconjugate composition and the relative ease of differentiating heteroconjugates from peptides or oligonucleotides.
For most practical purposes, the fractional mass of any heteroconjugate (MH) containing at least three nucleotide residues can be differentiated from the fractional mass of the peptide (MP) and oligonucleotide (MO) at equivalent nominal mass values. The effective fractional mass value per amino acid and per nucleotide can be reasonably approximated by using the chemical formulas for averagine36 (C4.94H7.76N1.36O1.48S0.042 MP = 111.160) and averatide37 (C9.79H12.29N3.71O6P MO = 308.761). With the fractional mass for an “average” amino acid of 0.109 and for an “average” deoxyribonucleotide of 0.050, there is a bias towards the peptide trend line on a per residue basis. However, if the fractional mass is normalized to an equivalent overall change in mass (Δm/m), it becomes immediately obvious that heteroconjugates are significantly biased towards the peptide component. A ratio of Δm/m for peptides vs. oligonucleotides finds that this ratio is approximately six times larger for peptides than oligonucleotides making it extremely unlikely that a heteroconjugate cannot be differentiated from a peptide or oligonucleotide of equivalent nominal mass unless the length of the peptide (or oligonucleotide) is significantly larger than the length of the oligonucleotide (or peptide). Conveniently, these conditions are also similar to those found to be experimentally optimal for the mass spectral characterization of oligonucleotide:peptide heteroconjugates.21
- These relationships also allow for the appropriate sizes of the peptide and oligonucleotide components of the heteroconjugate to be calculated for any particular fractional mass desired at a particular heteroconjugate mass. For example, at a heteroconjugate mass of 2000 with a desired fractional mass of 0.55, the relative sizes of the peptide and oligonucleotide moieties required from the E. coli ribosomal small subunit can be calculated using the equations from Figure 1b as:
(1) (2)
where Mp is the molecular mass of the peptide moiety and Mo is the molecular mass of the oligonucleotide moiety.(3)
Solving equations (2) and (3) yields Mo = 1387.4 and Mp = 612.6. Thus, a heteroconjugate having a six amino acid peptide and a 4-mer oligonucleotide will have an approximate molecular mass of 2000 Da and a fractional mass near to 0.5. The specific values calculated above only hold for E. coli heteroconjugates from the 30S ribosomal subunit; however, a similar calculation can be performed for any organism if the representative peptide and oligonucleotide fractional mass equations are available for Equation 1.
To ensure that the results and interpretations were not affected by the particular enzymatic digestion performed, similar plots were created to examine different means of digesting the M. genitalium proteome and this organism’s rRNAs. Shown in Supplemental Figure S1a (which can be found in the electronic version of this article) is the plot arising from the digestion of M. genitalium rRNA using RNase T1, which cleaves specifically after guanosine residues, RNase U2, which cleaves selectively after purine residues, and RNase A, which cleaves selectively after pyrimidine residues. No significant difference is found in the choice of endonuclease for RNA digestion. Similarly, the M. genitalium proteome was theoretically digested with trypsin, V8 and CNBr with the resulting plot shown in Figure S1b. Again, no significant difference is found for these three different digestion approaches, suggesting any combination of methods can be used experimentally to digest cross-linked nucleic acids and proteins. What appears more significant is to choose the appropriate digestion protocol so that larger peptides with relatively small oligonucleotide cross-links (or vice versa) are generated for subsequent mass spectral analysis.
Implications for experimental method development
These theoretical plots clearly show that by measuring digestion products of nucleic acid-protein cross-links with sufficient mass measurement accuracy, the resulting fractional mass values can be used to classify the products as either peptides, oligonucleotides or oligonucleotide-peptide heteroconjugates (i.e., cross-links) except for the peptide and oligonucleotide points of intersection noted in Figs. 1a and 2a. As the approach only requires sufficiently accurate mass measurements, it should be amenable to either MALDI-MS or LC-ESI-MS(/MS) instrumentation. These factors suggest one route for developing an experimental protocol amenable to using fractional mass as an identification tool for heteroconjugates.
The overlap in fractional mass of peptides and oligonucleotides, which is noted in Figs. 1a and 2a, along with the variation in the fractional mass trend line (e.g., Fig. 1b) would suggest that an experimental method focus on the analysis of peptides and peptide:oligonucleotide heteroconjugates or oligonucleotides and oligonucleotide:peptide heteroconjugates. In this manner, heteroconjugates would be readily identified as deviations from the parent sample class (i.e., either peptides or oligonucleotides alone) and no overlap in fractional mass would occur at any particular nominal mass value subject to the constraints evident in Fig. 3a. Analysis of this mixture by, for example, accurate mass LC-MS/MS followed by plotting the resulting data as a function of fractional mass would readily identify those ions likely to be cross-links. After identification of the precursor mass of these heteroconjugates by their fractional mass, further confirmation and sequence determination would be possible using tandem MS approaches.
The information obtained from the various theoretical plots is also useful in establishing limits associated with heteroconjugate size and instrumental requirements. Using the trend lines for M. genitalium as an example, a heteroconjugate composed of a single nucleotide residue can be differentiated from a peptide at nominal mass 1000 by measurement of the fractional mass. As the nominal mass increases, the heteroconjugate composition must also increase as, for example, a heteroconjugate composed of a single nucleotide residue cannot be differentiated from a peptide at nominal mass 2000 by fractional mass, rather a minimum of two nucleotides are required. Thus, as seen in Fig. 3a, three nucleotide residues provide a sufficient change in the fractional mass to readily differentiate peptides from peptide:oligonucleotide heteroconjugates across a large mass range.
Measuring differences in fractional mass require mass measurement accuracies at the sub-part per thousand level, which can be obtained from a variety of commercially available mass spectrometer systems. As important, the precision of these measurements must be as high as the variation in fractional mass for any particular nominal mass to ensure the measured mass is a reproducible measurement of the heteroconjugate or primary compound class. Finally, because this technique requires identifying ions based on their fractional mass values, and assuming that more than one ion may be present within any one mass unit window, the mass analyzer should yield peak widths on the order of a few tenths of a mass unit or smaller to effectively resolve peptides (or oligonucleotides) from heteroconjugates of the same nominal mass. Again, many of the same mass spectrometry platforms that can deliver mass measurement accuracies and precisions in the range required for this technique will also deliver the appropriate resolving power.
LC-MS analysis of an oligonucleotide-peptide heteroconjugate
The experimental strategy developed in this work focused on the analysis of peptides and an oligonucleotide-peptide heteroconjugate containing 11 amino acids linked to five nucleotides using a methodology similar to that used in proteomics of LC-MS(/MS) analysis of tryptic digests. These experiments were conducted using an LTQ-FTMS with mass measurement accuracies, precisions and resolution within the guidelines listed above. Urlaub and co-workers have shown that cross-links can be analyzed by nanoLC-MS using a formic acid/acetonitrile aqueous buffer system.25 However, when a similar buffer systems was used with our capLC-MS, the ionization efficiency of the heteroconjugate used in this work was too low to yield any appreciable ion current. Thus, conditions were investigated to identify an appropriate capLC buffer system that would allow for the separation of peptides and the heteroconjugate while maintaining an appropriate ionization efficiency so that reasonable ion signals from the heteroconjugate would be detected during ESI-MS. Initial studies were conducted using direct infusion microspray ESI-MS to establish an ESI solvent system that would adequately ionize the heteroconjugate. After several trials, a 5 mM ammonium acetate, 50% aqueous acetonitrile solution yielded the +2 and +3 charge states of the heteroconjugate during ESI (Supplemental Figure S2a), most likely due to the neutralization of the oligonucleotide phosphodiester backbone through ion-pairing with ammonium ions. Other than the conjugate with expected molecular weight, acetylated forms of the conjugate, which are side products in the reaction mixture, were detected. Collision-induced dissociation of the +3 charge state of the conjugate generated c and y ions from the oligonucleotide moiety (Supplemental Figure S2b), as expected based on previous tandem MS studies of heteroconjugates.21 An ion corresponding to the dehydrated peptide minus the oligonucleotide moiety (m/z 1079.9) also was detected, but no backbone fragmentation for the peptide moiety alone were detected.
As mentioned above, application of fractional mass differences between oligonucleotides and peptides for the detection of heteroconjugates would be extremely useful in an experimental strategy whereby cross-linked proteins and nucleic acids are isolated with the resulting sample being analyzed as a modified protein. In such a strategy, after appropriate enzymatic digestion, the resulting mixture of peptides along with any oligonucleotide-peptide heteroconjugates could be analyzed by standard LC-MS/MS protocols to both identify the protein involved in the cross-link as well as determine the particular sites within the protein that contain oligonucleotide cross-links. To effect this experimental strategy, an LC-MS/MS protocol is required that would facilitate the ionization and subsequent identification of oligonucleotide-peptide cross-links within a larger background of non-cross-linked peptides.
As reverse phase chromatography is commonly used for peptide analysis, separation of the heteroconjugate on a capillary C18 column was investigated. UV absorbance at 220, 260 and 280 nm was used to monitor the heteroconjugate. Guided by the results from the ESI solvent studies, a buffer containing ammonium acetate in acetonitrile was investigated. The gradient conditions found to be most effective were: a 35 min linear gradient of 20-95% buffer B with buffer A containing 5 mM ammonium acetate, 5% aqueous acetonitrile and buffer B containing 95% aqueous acetonitrile. As noted in Figure 4a, the use of ammonium acetate as an ion-pairing agent38-39 allows for the separation of the heteroconjugate. When the same sample was analyzed under more conventional peptide gradient HPLC conditions (35 min linear gradient of 20-95% buffer B with buffer A containing 0.1% formic acid, 5% aqueous acetonitrile and buffer B containing 0.1% formic acid, 95% aqueous acetonitrile), the heteroconjugate could not be detected (Figure 4b).
Figure 4.
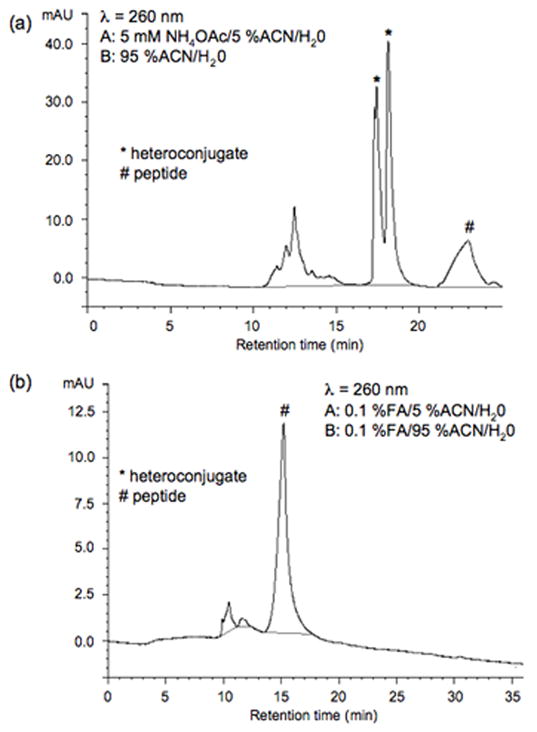
RP-HPLC separation on a capillary C18 column of the anion-exchange purified fraction containing the heteroconjugate. In (a) a gradient composed of buffer A: 5 mM ammonium acetate, 5% ACN/H2O and buffer B: 95% ACN/H2O was used. In (b) a gradient composed of buffer A: 0.1% FA, 5% ACN/H2O and buffer B: 0.1% FA, 95% ACN/H2O was used. For all chromatography, gradient conditions were 30 minute linear gradient from 20 to 95% buffer B. Peaks marked with asterisks (*) have A260/A280 and A220/A260 ratios that are consistent with the presence of an oligonucleotide, while peaks marked with # have ratios more consistent with a peptide alone.
To determine whether the ammonium acetate buffer system would also be amenable to separating a mixture of peptides (such as might result from the enzymatic digestion of a cross-linked protein), a sample containing three standard peptides was analyzed by HPLC using the two different mobile phase conditions described above (Supplemental Figure S3). As might be expected, the conventional peptide mobile phase containing formic acid (Fig. S3a) resulted in better separation of these peptides than did the ammonium acetate containing mobile phase (Fig. S3b). However, these results did suggest that the ammonium acetate mobile phase may be compatible with LC-MS analysis of a mixture containing both non-cross-linked peptides and oligonucleotide-peptide heteroconjugates.
Experimental fractional mass plots
To evaluate whether the ammonium acetate mobile phase would generate sufficient ion signals from both peptides and oligonucleotide-peptide heteroconjugates allowing for the use of a fractional mass plot to distinguish the heteroconjugate, cytochrome c was digested with trypsin and then spiked with the heteroconjugate. This mixture was separated using the ammonium acetate mobile phase described earlier and analyzed by LC-MS. All of the masses that were intense enough (1000 counts or more) to trigger MS/MS in the LC run were extracted into an Excel file. Multiply charged ions were converted to singly charged and plotted on a fractional mass plot (Figure 5). As is readily noted in this plot, the heteroconjugate masses do not fall on the peptide fractional mass trend line, and so are easily distinguished.
Figure 5.

Fractional mass plot for a cytochrome c tryptic digest spiked with the heteroconjugate Ac-GARGAD(agcca)RAVLA-NH2. Experimental LC-MS/MS conditions are described in the text. The ions corresponding to the heteroconjugate are readily identified by fractional mass values that do not fall along the peptide fractional mass trend line.
These results illustrate the application of the fractional mass plot for identifying modified peptides that would be appropriate candidates for further MS/MS analysis to establish that they are oligonucleotide-peptide heteroconjugates and to identify the region of the protein containing the cross-link along with the sequence of the oligonucleotide (by CID MS/MS). However, finding HPLC and ESI conditions that are effective at analyzing both heteroconjugates and non-cross-linked peptides is challenging. For example, the LC-MS/MS analysis of the same spiked cytochrome c tryptic digest analyzed using the formic acid mobile phase yielded only tryptic peptides (data not shown) – the heteroconjugate could not be detected in the mass spectrum. Whether the ammonium acetate mobile phase will be appropriate for other peptide/heteroconjugate mixtures, or whether heteroconjugates with smaller oligonucleotide moieties can be analyzed using the formic acid mobile phase are questions to be answered by on-going experiments.
CONCLUSIONS
The possibility of using accurate mass measurements for distinguishing peptide-oligonucleotide cross-links in a mixture of peptides or oligonucleotides via fractional mass plots was investigated. Using proteins and nucleic acids available from database resources, calculations reveal that peptides and oligonucleotides indeed have different slopes when the fractional mass is plotted against the nominal mass. It was also shown, conceptually, that heteroconjugates will have a fractional mass that lies between the trend lines for peptides and oligonucleotides separately. The best sample arrangement for differentiating heteroconjugates from peptides or oligonucleotides alone were found, and an approach for optimizing the peptide and oligonucleotide size within a heteroconjugate at a particular mass and fractional mass. The concept was demonstrated by the LC-MS/MS analysis of a heteroconjugate spiked into a mixture of tryptic peptides.
The difficulties encountered in this work regarding experimental LC-MS conditions that permit the ionization and detection of heteroconjugates within a larger mixture of tryptic peptides can be used to guide future applications of this method. For heteroconjugates having nearly equivalent peptide and oligonucleotide properties (i.e., size), it is likely that two separate LC-MS analyses will be necessary to optimize detection of peptides alone as well as detection of the heteroconjugate. The preferred experimental strategy, which arises from the differences in fractional mass as a function of nominal mass, is to generate heteroconjugates that are primarily larger peptides (or oligonucleotides) with smaller oligonucleotides (or peptides) cross-linked. Such conditions would permit LC-MS analysis within a single run, using HPLC and ESI conditions appropriate for the larger of the two moieties, and will generate fractional mass plots in which the cross-link is readily differentiated from any uncross-linked sample. It is anticipated that this method can be incorporated into a general proteomics-like scheme for identifying protein-nucleic acid cross-links, and this method is equally applicable to protein-DNA and protein-RNA complexes.
Supplementary Material
Acknowledgments
The authors thank Dr. Larry Sallans for assistance with the mass spectral data collection. Financial support for this work was provided by the National Institutes of Health (GM 058843 and RR 019900) and the University of Cincinnati.
References
- 1.Uptain SM, Kane CM, Chamberlin MJ. Basic mechanisms of transcript elongation and its regulation. Annu Rev Biochem. 1997;66:117–172. doi: 10.1146/annurev.biochem.66.1.117. [DOI] [PubMed] [Google Scholar]
- 2.Sancar A, Lindsey-Boltz LA, Unsal-Kacmaz K, Linn S. Molecular mechanisms of mamalian DNA repair and the DNA damage checkpoints. Annu Rev Biochem. 2004;73:39–85. doi: 10.1146/annurev.biochem.73.011303.073723. [DOI] [PubMed] [Google Scholar]
- 3.Falkenberg M, Larsson N-G, Gustafsson CM. DNA replication and transcription in mammalian mitochondria. Annu Rev Biochem. 2007;76:679–699. doi: 10.1146/annurev.biochem.76.060305.152028. [DOI] [PubMed] [Google Scholar]
- 4.Campbell ID. The march of structural biology. Nature Reviews. 2002;3:377. doi: 10.1038/nrm800. [DOI] [PubMed] [Google Scholar]
- 5.Bushnell DA, W KD, Davis R, Kornberg RD. Structural basis of transcription: an RNA polymerase II - TFIIB cocrystal at 4.5 Å. Science. 2004;303:983. doi: 10.1126/science.1090838. [DOI] [PubMed] [Google Scholar]
- 6.Schuwirth BS, B MA, Hau CW, Zhang W, Vila-Sanjurjo A, Holton JM, Cate JHD. Structures of the bacterial ribosome at 3.5 Å resolution. Science. 2005;310:827. doi: 10.1126/science.1117230. [DOI] [PubMed] [Google Scholar]
- 7.Frank J. Cryo-electron microscopy as an investigative tool: the ribosome as an example. BioEssays. 2001;23:725. doi: 10.1002/bies.1102. [DOI] [PubMed] [Google Scholar]
- 8.Christodoulou J, L G, Fucini P, Connell SR, Pertinhez TA, Hanson CL, Redfield C, Nierhaus KH, Robinson CV, Schleucher J, Dobson CM. Heteronuclear NMR investigations of dynamic regions of intact Escherichia coli ribosomes. PNAS. 2004;101:10949–10954. doi: 10.1073/pnas.0400928101. [DOI] [PMC free article] [PubMed] [Google Scholar]
- 9.Sinz A. Chemical cross-linking and mass spectrometry to map three-dimential protein structures and protein-protein interaction. Mass Spectrometry Reviews. 2006;25:663. doi: 10.1002/mas.20082. [DOI] [PubMed] [Google Scholar]
- 10.Back JW, de Jong L, Muijsers AO, de Koster CJ. Chemical cross-linking and mass spectrometry for protein structural modeling. J Mol Biol. 2003;331:303–313. doi: 10.1016/s0022-2836(03)00721-6. [DOI] [PubMed] [Google Scholar]
- 11.Chyou DT, Rawle VL, Trotman CN. Quaternary structure of Artemia haemoglobin II: analysis of T and C polymer alignment and interpolymer interface. BMC Structural Biology. 2007;7 doi: 10.1186/1472-6807-7-26. [DOI] [PMC free article] [PubMed] [Google Scholar]
- 12.Sinz A, W K. Mapping spatial proximities of sulfhydryl groups in proteins using a fuorogenic cross-linker and mass spectrometry. Anal Biochem. 2004;331:27. doi: 10.1016/j.ab.2004.03.075. [DOI] [PubMed] [Google Scholar]
- 13.Sinz A, W K. Mapping protein interfaces with a fluorogenic cross-linker and mass spectrometry: Application to nebulin-calmodulin complexes. Biochemistry. 2001;40:7903. doi: 10.1021/bi010259+. [DOI] [PubMed] [Google Scholar]
- 14.Hurst GB, L TK, Kennel SJ. Mass spectrometric detection of affinity purified crosslinked peptides. J Am Soc Mass Spectrom. 2004;15:832. doi: 10.1016/j.jasms.2004.02.008. [DOI] [PubMed] [Google Scholar]
- 15.Alley SC, I FT, Jones AD, Benkovic SJ. Mapping protein-protein interactions in the bacteriophage T4 DNA polymerase holoenzyme using a novel trifunctional photo-cross-linking and affinity reagent. J Am Chem Soc. 2000;122:6126. [Google Scholar]
- 16.Müller DR, S P, Towbin H, Wirth U, Voshol H, Hoving S, Steinmetz MO. Isotope-tagged cross-linking reagents. A new tool in mass spectrometric protein interaction analysis. Anal Chem. 2001;73:1927. doi: 10.1021/ac001379a. [DOI] [PubMed] [Google Scholar]
- 17.Back JW, N V, de Koning LJ, Muijsers AO, Sixma TK, de Koster CG, de Jong L. Identification of cross-linked peptides for protein interaction studies using mass spectrometry and 18O labeling. Anal Chem. 2002;74:4417. doi: 10.1021/ac0257492. [DOI] [PubMed] [Google Scholar]
- 18.Huang BX, K H-Y, Dass C. Probing three-dimensional structure of bovine serum albumin by chemical cross-linking and mass spectrometry. J Am Chem Soc. 2004;15:1237. doi: 10.1016/j.jasms.2004.05.004. [DOI] [PubMed] [Google Scholar]
- 19.Kruppa GH, S J, Young MM. A top down approach to protein structural studies using chemical cross-linking and Fourier transform mass spectrometry. Rapid Commun Mass Spectrom. 2003;17:155–162. doi: 10.1002/rcm.885. [DOI] [PubMed] [Google Scholar]
- 20.Novak P, H WE, Ayson MJ, Jacobsen RB, Schoeniger JS, Leavell MD, Young MM, Kruppa GH. Unambiguous assignment of intramolecular chemical cross-links in modified mammalian membrane proteins by Fourier transform-tandem mass spectrometry. Anal Chem. 2005;77:5101. doi: 10.1021/ac040194r. [DOI] [PubMed] [Google Scholar]
- 21.Jensen ON, K S, Aldrich J, Barofsky D. Characterization of peptide-oligonucleotide heteroconjugates by mass spectrometry. Nucleic Acids Research. 1996;24:3866. doi: 10.1093/nar/24.19.3866. [DOI] [PMC free article] [PubMed] [Google Scholar]
- 22.Kühn-Hölsken E, L C, Sander B, Lührmann R, Urlaub H. Complete MALDI-ToF MS analysis of cross-linked peptide–RNA oligonucleotides derived from nonlabeled UV-irradiated ribonucleoprotein particles. RNA. 2005;11:1915. doi: 10.1261/rna.2176605. [DOI] [PMC free article] [PubMed] [Google Scholar]
- 23.Urlaub H, T B, Müller E, Brimacombe R, Wittmann-Liebold B. Identification and sequence analysis of contact sites between ribosomal proteins and rRNA in Escherichia coli 30 S subunits by a new approach using Matrix-assisted Laser Desorption/Ionization-mass spectrometry combined with N-terminal microsequencing. J Biol Chem. 1997;272:14547–14555. doi: 10.1074/jbc.272.23.14547. [DOI] [PubMed] [Google Scholar]
- 24.Urlaub H, K V, Bischof O, Müller E, Wittmann-Liebold B. Protein-rRNA binding features and their structural and functional implications in ribosomes as determined by cross-linking studies. EMBO. 1995;14:4578. doi: 10.1002/j.1460-2075.1995.tb00137.x. [DOI] [PMC free article] [PubMed] [Google Scholar]
- 25.Lenz C, K-H E, Urlaub H. Detection of protein-RNA cross-links by nano-LC-ESI-MS/MS using precursor ion scanning and multiple reaction monitoring (MRM) experiments. J Am Soc Mass Spectrom. 2007;18:869. doi: 10.1016/j.jasms.2007.01.013. [DOI] [PubMed] [Google Scholar]
- 26.Choppin GR, Liljenzin J-O, RYDBERG J. Radiochemistry and nuclear chemistry. Butterworth-Heinemann; 2001. [Google Scholar]
- 27.Hughey CA, H CL, Rodgers RP, Marshall AG. Kendrick mass defect spectrum: A compact visual analysis for ultrahigh-resolution broadband mass spectra. Anal Chem. 2001;73:4676. doi: 10.1021/ac010560w. [DOI] [PubMed] [Google Scholar]
- 28.Dodds ED, A HJ, Hagerman PJ, Lebrilla CB. Enhanced peptide mass fingerprinting through high mass accuracy: exclusion of non-peptide signals based on residual mass. Journal of Proteome Research. 2006;5:1195. doi: 10.1021/pr050486o. [DOI] [PubMed] [Google Scholar]
- 29.Zhang H, Z D, Ray K. JMS letters. J Mass Spectrom. 2003;38:1110–1112. doi: 10.1002/jms.521. [DOI] [PubMed] [Google Scholar]
- 30.Hernandez H, Niehauser S, Boltz SA, Gawandi V, Phillips RS, Amster IJ. Mass Defect Labeling of Cysteine for Improving Peptide Assignment in Shotgun Proteomic Analyses. Anal Chem. 2006;78:3417. doi: 10.1021/ac0600407. [DOI] [PMC free article] [PubMed] [Google Scholar]
- 31.Lehmann WD, B A, von der Lieth C. The information encrypted in accurate peptide masses-improved protein identification and assistance in glycopeptide identification and characterization. J Mass Spectrom. 2000;35:1335. doi: 10.1002/1096-9888(200011)35:11<1335::AID-JMS70>3.0.CO;2-0. [DOI] [PubMed] [Google Scholar]
- 32.Jones JJ, S MJ, Fleming RC, Lay JO, Wilkins CL. Strategies and data analysis techniques for lipid and phospholipid chemistry elusidation by intact cell MALDI-FTMS. J Am Soc Mass Spectrom. 2004;15:1665. doi: 10.1016/j.jasms.2004.08.007. [DOI] [PubMed] [Google Scholar]
- 33.Bruce C, S MA, Miller P, Gulcicek EE. Probabilistic enrichment of phosphopeptides by their mass defect. Anal Chem. 2006;78:4374. doi: 10.1021/ac060046w. [DOI] [PMC free article] [PubMed] [Google Scholar]
- 34.Frahm JL, H BE, Heber S, Muddiman DC. Accessible proteomics space and its implications for peak capacity for zero-, one- and two-dimentional separations coupled with FT-ICR and TOF mass spectrometry. J Mass Spectrom. 2006;41:281. doi: 10.1002/jms.1024. [DOI] [PubMed] [Google Scholar]
- 35.Zubarev RA, H P, Sundqvist B. Accuracy requirements for peptide characterization by monoisotopic molecular mass measurements. Anal Chem. 1996;68:4060. [Google Scholar]
- 36.Senko MW, Beu SC, McLafferty FW. Determination of Monoisotopic Masses and Ion Populations for Large Biomolecules from Resolved Isotopic Distributions. J Am Soc Mass Spectrom. 1995;6:229. doi: 10.1016/1044-0305(95)00017-8. [DOI] [PubMed] [Google Scholar]
- 37.Frahm JL, Mason CJ, Muddiman DC. Utility of Accurate Monoisotopic Mass Measurements to Confidently Identify Lambda Exonuclease Generated Single-Stranded Amplicons Containing 7-deaza Analogs by Electrospray Ionization FT-ICR Mass Spectrometry. Int J Mass Spectrom. 2004;234:79. [Google Scholar]
- 38.Apffel A, C JA, Fischer S, Lichtenwalter K, Hancock WS. Analysis of oligonucleotides by HPLC-electrospray ionization mass spectrometry. Anal Chem. 1997;69:1320. doi: 10.1021/ac960916h. [DOI] [PubMed] [Google Scholar]
- 39.Deguchi K, I M, Yokokura T, Ogata I, Ito S, Mimura T, Ostrander C. Enhanced mass detection of oligonucleotides using reverse-phase high-performance liquid chromatography / electrospray ionization ion-trap mass spectrometry. Rapid Commun Mass Spectrom. 2002;16:2133. doi: 10.1002/rcm.840. [DOI] [PubMed] [Google Scholar]
Associated Data
This section collects any data citations, data availability statements, or supplementary materials included in this article.