Abstract
Foxp3+CD4+CD25+ regulatory T (Treg) cells are essential for the prevention of autoimmunity1,2. Treg cells have an attenuated cytokine response to T-cell receptor stimulation, and can suppress the proliferation and effector function of neighbouring T cells3,4. The forkhead transcription factor Foxp3 (forkhead box P3) is selectively expressed in Treg cells, is required for Treg development and function, and is sufficient to induce a Treg phenotype in conventional CD4+CD25− T cells5–8. Mutations in Foxp3 cause severe, multi-organ autoimmunity in both human and mouse9–11. FOXP3 can cooperate in a DNA-binding complex with NFAT (nuclear factor of activated T cells) to regulate the transcription of several known target genes12. However, the global set of genes regulated directly by Foxp3 is not known and consequently, how this transcription factor controls the gene expression programme for Treg function is not understood. Here we identify Foxp3 target genes and report that many of these are key modulators of T-cell activation and function. Remarkably, the predominant, although not exclusive, effect of Foxp3 occupancy is to suppress the activation of target genes on T-cell stimulation. Foxp3 suppression of its targets appears to be crucial for the normal function of Treg cells, because overactive variants of some target genes are known to be associated with autoimmune disease.
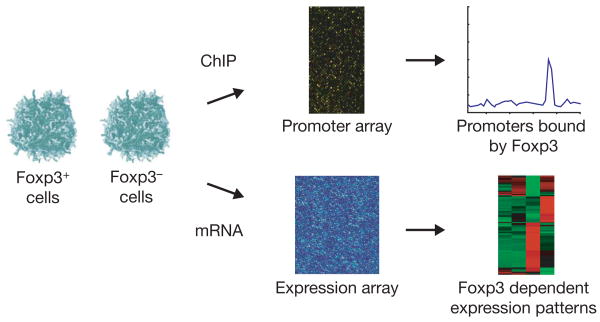
We developed a strategy to identify genes whose promoters are bound by Foxp3 and whose expression is dependent on that transcription factor (Fig. 1). To generate two cell lines that are genetically matched except for Foxp3, we transduced a Foxp3−CD4+ murine T-cell hybridoma with FLAG-tagged Foxp3. This approach was favoured over comparison of ex vivo cells, which are heterogeneous with regard to activation status. The lines provided sufficient numbers of homogeneous cells with appropriate controls to facilitate both location analysis and expression analysis. FACS (fluorescence-activated cell sorting) analysis confirmed that Foxp3 is expressed in the hybridoma at levels comparable to those in ex vivo CD4+CD25+ Treg cells (Supplementary Fig. S1). Previous work has shown that conventional CD4+ T cells ectopically expressing Foxp3 do not upregulate interleukin 2 (Il2) secretion following T-cell receptor (TCR) dependent stimulation13. To confirm that the Foxp3+ hybridomas contain functional Foxp3, we assayed Foxp3− and Foxp3+ cells for Il2 secretion. Indeed, FACS analysis revealed that Il2 secretion is strongly inhibited in phorbol myristate acetate (PMA)/ionomycin stimulated Foxp3+ hybridomas compared to stimulated Foxp3− hybridomas (Supplementary Fig. S2).
Figure 1. Strategy to identify direct Foxp3 transcriptional effects.
Genetically matched Foxp3+ and Foxp3− cell populations were generated by transduction of FLAG-tagged Foxp3 into a Foxp3− murine T-cell hybridoma. Foxp3 binding sites at promoters across the genome were identified by ChIP experiments with an anti-FLAG antibody. Foxp3 dependent transcriptional regulation was identified by gene expression profiling performed on each of these cell types.
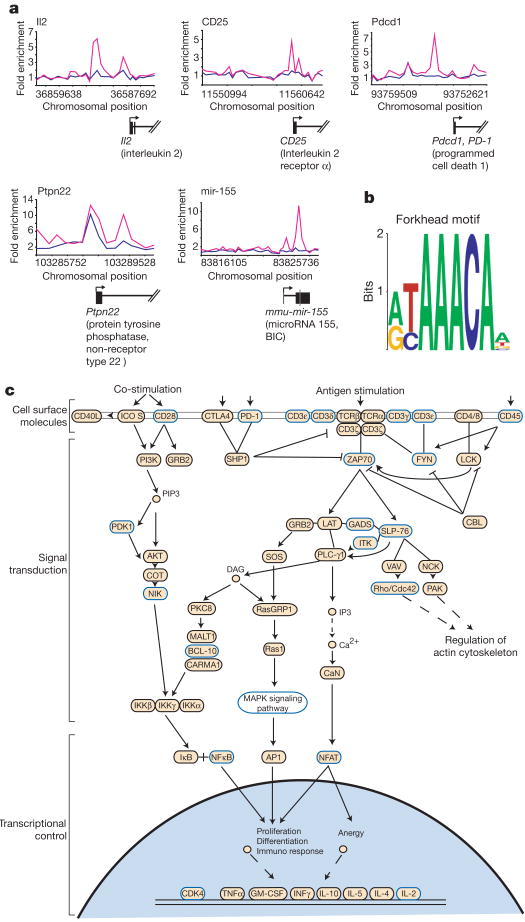
To identify direct targets of Foxp3, DNA sequences occupied by the transcription factor were identified in a replicate set of experiments using chromatin-immunoprecipitation (ChIP) combined with DNA microarrays. For this purpose, DNA microarrays were used that contain 60-mer oligonucleotide probes covering the region from −8 kilobases (kb) to +2 kb relative to the transcript start sites for approximately 16,000 annotated mouse genes14. The sites occupied by Foxp3 were identified as peaks of ChIP-enriched DNA that span closely neighbouring probes (Fig. 2). Foxp3 was found to occupy the promoters of 1,119 genes in PMA/ionomycin stimulated hybridomas (Supplementary Tables S1 and S2). The well-characterized Foxp3 target gene12,15, Il2, was among the genes occupied by Foxp3 (Fig. 2a). Most of the promoters occupied by Foxp3 in stimulated T cells were also occupied in unstimulated cells (Supplementary Tables S1 and S2, and Supplementary Fig. S3). However, at some promoters Foxp3 binding increased considerably in cells stimulated with PMA/ionomycin (Fig. 2a and Supplementary Fig. S3). Control immunoprecipitation experiments in Foxp3− cells, which produced few positive signals, confirmed the specificity of these results (Supplementary Fig. S4). Our confidence in the binding data was further strengthened by the discovery of a DNA sequence motif, which matches the consensus forkhead motif, at the genomic loci that were bound by Foxp3 (Fig. 2b and Supplementary Table S5). This motif distinguishes Foxp3 bound regions from unbound regions tiled on the promoter arrays with a high level of confidence (P < 10−41). Instances of this motif are significantly more likely to be conserved in Foxp3 bound regions than in promoter regions that are not bound by Foxp3 (P < 10−23), suggesting that these sites serve a functional role (Supplementary Table S5).
Figure 2. Direct Foxp3 targets include key modulators of T-cell function.
a, Foxp3 ChIP enrichment ratios (ChIP-enriched versus total genomic DNA) across indicated promoters are shown for stimulated (pink) and unstimulated (blue) cells. Exons (blocks) and introns (lines) of genes and the mir-155 precursor (grey) are drawn to scale below the plots, with direction of transcription noted by an arrow. b, Foxp3 bound genomic regions are enriched for the presence of a forkhead DNA motif, represented here in WebLogo (http://weblogo.berkeley.edu). c, The KEGG16 TCR signalling pathway, enriched (P = 1.4 × 10⁻⁵) for proteins encoded by direct targets of Foxp3 (blue outline), is displayed.
To gain insights into the cellular functions that are directly regulated by Foxp3 transcriptional control, we compared the list of genes occupied by Foxp3 in stimulated hybridomas to the biological pathways annotated by the Kyoto Encyclopedia of Genes and Genomes (KEGG)16. Among these pathways, Foxp3 target genes are most strongly associated with the TCR signalling pathway (P =1.4 ×10⁻⁵) (Fig. 2c). Foxp3 target genes encode proteins that participate at multiple levels of this pathway, including cell surface molecules, signalling components and transcriptional regulators. Many genes with known roles in T cells are missed with existing automated surveys, so we also manually inspected the list of Foxp3 target genes. This revealed that many additional Foxp3 targets are probably important for T-cell function, including microRNAs that are differentially expressed between Treg cells and conventional T cells17 (Fig. 2a and Supplementary Table S3). Surprisingly, Ctla4 was not among the Foxp3 targets, but analysis by RT–PCR (polymerase chain reaction with reverse transcription) revealed no Ctla4 expression in Foxp3− and Foxp3+ hybridomas (data not shown). However, the Foxp3 targets included genes previously reported to be upregulated in Treg cells, such as Il2ra (CD25) (ref. 1), Tnfrsf18 (GITR) (ref. 18), Nrp1 (ref. 19) and Ccr4 (ref. 20), consistent with predictions that these are directly regulated by Foxp3.
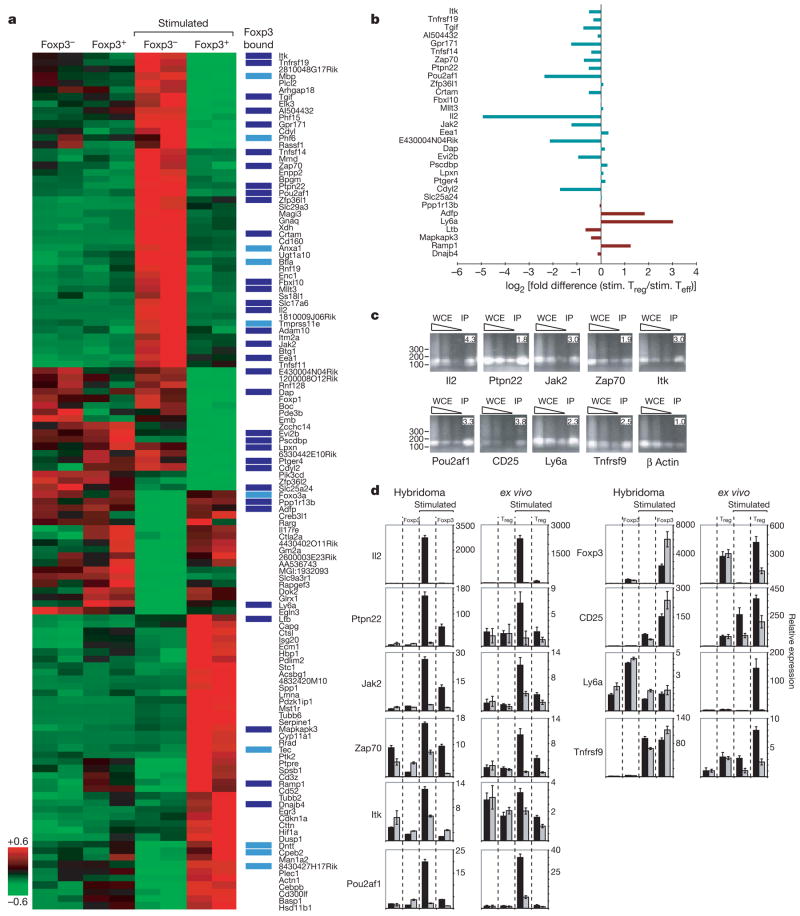
Previous reports have shown that only a portion of transcription factor binding events is associated with transcriptional regulation21. To identify the set of genes whose expression is dependent on Foxp3, we performed gene expression profiling on Foxp3− and Foxp3+ T-cell hybridoma cells before and after PMA/ionomycin stimulation. Comparison of data from unstimulated Foxp3− and Foxp3+ cells revealed few differentially expressed genes, suggesting that the transcription factor had little influence on global gene expression in unstimulated hybridomas (Supplementary Table S8). In contrast, PMA/ionomycin-stimulated Foxp3− and Foxp3+ cells showed significant differences in expression of almost 1% of mouse genes. Many of these genes were directly occupied by Foxp3, and Foxp3 binding was predominantly, but not exclusively, associated with genes whose expression is downregulated in stimulated Foxp3+ hybridomas. Foxp3 occupied the promoters of approximately half of the genes in this cluster (Fig. 3a). This set of downregulated target genes is enriched for genes that are implicated in TCR signalling (P = 6.1 × 10⁻³). Underscoring the significance of this finding, E2f4, an unrelated control transcription factor that occupies ∼800 genes in these hybridomas, was found to occupy only one of these promoters (Supplementary Table S4).
Figure 3. Foxp3 directly suppresses the activation of target genes.
a, Replicate expression data for the 125 genes with Foxp3 dependent differential expression in stimulated hybridomas (false disovery rate, FDR < 0.05) were hierarchically clustered and displayed. The Z-score normalized induction (red) or repression (green) is shown for each gene. Direct targets of Foxp3 in stimulated hybridomas are indicated (dark blue for FDR < 0.05, light blue for FDR < 0.10). b, For repressed (green) and induced (red) Foxp3-bound targets in a, log2(fold difference) in expression between stimulated ex vivo effector (Teff) T cells and Treg cells is displayed. Slc17a6 and Adam10 are not expressed in the ex vivo samples. c, Site-specific PCR on 10 ng of ChIP DNA confirmed selected targets. Immunoprecipitated (IP) DNA was compared to serial dilutions (90, 30 and 10 ng of DNA) of unenriched whole cell extract (WCE) DNA. Enrichment ratios, shown at top right of each sub-panel, are normalized relative to the unenriched β actin control. DNA fragment size (bp) is indicated on the left of each row. d, The transcript levels of the panel of Foxp3 targets presented in c and of Foxp3 were analysed by real-time RT–PCR in stimulated and unstimulated cells, with (grey) and without (black) cyclosporin A. Mean values ± s.d. of relative expression, determined in triplicate, are shown for indicated genes.
Only a subset of all Foxp3 occupied genes was found to be differentially expressed. One reason for this could be that Foxp3 requires cofactors to modulate transcription. Recently, FOXP3 was shown to cooperate with NFAT in a DNA-binding complex to activate or repress target gene expression12. Consistent with this report, Foxp3 exerts a more pronounced transcriptional effect in stimulated hybridoma cells than in non-stimulated cells. Importantly, in our experiments, the set of Foxp3 bound genes are enriched (P < 10−19) for the presence of an Nfat DNA sequence motif neighbouring the sites of Foxp3 occupancy (Supplementary Table S5).
We next examined whether the genes regulated by Foxp3 in the T-cell hybridomas show similar regulatory behaviour in ex vivo T cells. Hybridoma cells were used initially because they afforded cells that differ only by Foxp3 status, they provided a homogenous population of non-stimulated T cells, and we could have confidence in genome-wide location data using FLAG-tagged Foxp3. Nonetheless, microarray expression profiling was performed on ex vivo T cells from different mice that express a transgenic TCR alone or together with the TCR agonist ligand22, from which relatively pure populations of naïve CD4+CD25− T helper and Foxp3+CD4+CD25+ Treg cells, respectively, could be isolated. This analysis revealed that many, although not all, of the regulated targets that were identified in the hybridomas show consistent expression patterns in stimulated ex vivo cells (Fig. 3b and Supplementary Fig. S5). Some differences in gene expression, especially genes that are activated by Foxp3 only in Treg cells, may be due to the fact that ex vivo Treg cells are generated through antigenic stimulation23,24 and hence could contain transcriptional cofactors that differ from those in hybridoma cells.
Our findings were further validated for a panel of nine Foxp3 targets. Site-specific primers were used to confirm the binding of Foxp3 to the promoters of these genes (Fig. 3c) and quantitative RT–PCR was used to assay messenger RNA levels in non-stimulated and stimulated hybridomas and ex vivo cells, in the presence and absence of 2 μM cyclosporin A (Fig. 3d). These experiments confirmed the direct effects of Foxp3 at targets that were identified in the genome scale experiments. Notably, in these experiments (Fig. 3d) all genes that were activated following stimulation in Foxp3− cells and repressed in Foxp3+ cells were activated in a calcineurin dependent manner, consistent with the notion that Nfat is involved in their activation. Finally, just as Foxp3 regulates the protein levels of secreted Il2 (Supplementary Fig. S2), cell surface staining and FACS analysis show that Foxp3 regulates the level of Ly6a protein, demonstrating that Foxp3 transcriptional regulation of its targets modulates protein levels (Supplementary Fig. S6).
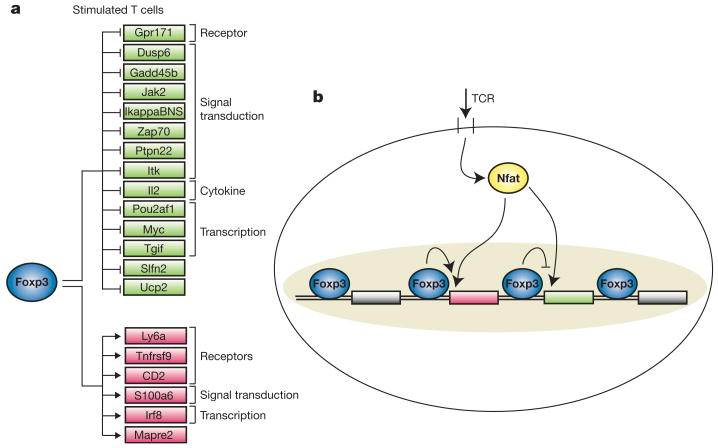
Taken together, the results from ex vivo T cells and the hybridoma system identify a core set of Foxp3 regulatory targets (Fig. 4a), most of which showed suppressed activation in stimulated Foxp3+ cells. A smaller number of Foxp3 target genes was upregulated in stimulated Foxp3+ cells, including some encoding cell surface molecules with known roles in immunoregulation, such as Ly6a (ref. 25) and Tnfrsf9 (4-1BB) (ref. 26). The results from the hybridoma system indicate that Foxp3 occupies regions of most of its target promoters in both unstimulated and stimulated conditions, but increased binding at some promoters and regulation of most targets is observed after stimulation. Furthermore, in hybridomas the major function of Foxp3 at these genes is to suppress the level of gene activation that would occur if this transcription factor were not expressed (Fig. 4b). Conceivably, the Foxp3 dependent downregulation of T-cell activation and cytokine genes, and upregulation of immunosuppressive cell surface molecules, contribute to both the hyporesponsive and suppressive Treg phenotype.
Figure 4. Core direct regulatory effects of Foxp3.
a, Shown here are a subset of direct Foxp3 targets that exhibit consistent transcriptional behaviour in hybridomas and in ex vivo T cells (Supplementary Fig. S5). b, Foxp3 binds to a large set of promoters both in unstimulated and stimulated T cells, but Foxp3 transcriptional regulation is more extensive in stimulated T cells. The genomic regions where Foxp3 binds are enriched for an Nfat binding site DNA motif. In the hybridomas, Foxp3 predominantly acts to directly suppress the activation of its target genes.
Mutations in some Foxp3 target genes are already known to be associated with autoimmune disease. The protein tyrosine phophatase Ptpn22 is a notable example. In our experiments, Ptpn22 is one of the highest confidence direct targets of Foxp3, it is upregulated on stimulation in Foxp3− cells, and this upregulation is inhibited in Foxp3+ hybridomas (Fig. 3a) and ex vivo Treg cells (Fig. 3b, d). Ptpn22 modulates the signal cascade downstream of the TCR, and mutations in the human PTPN22 have been associated with type 1 diabetes, rheumatoid arthritis, systemic lupus erythematosus and Graves' disease, as well as other autoimmune diseases27–29. A recent report suggests that one PTPN22 single-nucleotide polymorphism associated with autoimmunity is a gain-of-function mutation30. Our findings are compatible with the hypothesis that the gain-of-function mutation might be pathogenic if mutant PTPN22 is overactive in Treg cells30.
In summary, our data indicate that Foxp3 binds to the promoters of well-characterized regulators of T-cell activation and function. In the T-cell hybridomas studied here, the major role of this transcription factor is to dampen the induction of key genes when Treg cells are stimulated. In ex vivo Treg cells, Foxp3 could also activate the expression of a greater number of genes, perhaps owing to the greater abundance of certain transcriptional cofactors in these cells. Some of the identified Foxp3 target genes have been previously implicated in autoimmune diseases, implying that a therapeutic strategy to recapitulate the function of this transcription factor may have clinical utility for these diseases.
Methods
A detailed description of all materials and methods used can be found in Supplementary Information.
Growth of murine CD4+ T-cell hybridomas and ex vivo T cells
CD4+ 5B6-2 hybridoma cells expressing a PLP139-151-specific TCR, which was kindly provided by V. Kuchroo, were cultured in Dulbecco's modified Eagle medium (Invitrogen). Primary murine CD4+ T cells were cultured in RPMI-1640 medium (Invitrogen). For gene expression profiling, real-time RT–PCR, and location analysis, cells were cultured in the absence or presence of 50 ng ml−1 phorbol 12-myristate 13-acetate (PMA) and 200 ng ml−1 ionomycin at 37°C and harvested after 6 h. Where indicated, cells were preincubated for 1 h with 2 μM cyclosporin A. Details of cell generation and isolation are provided in Supplementary Information.
Antibodies and ChIP assays
Detailed descriptions of antibodies, antibody specificity and ChIP methods used in this study are provided in Supplementary Information.
Promoter array design and data extraction
The design of the oligonucleotide-based promoter array set and data extraction methods are described in Supplementary Information. The microarrays used for location analysis in this study were manufactured by Agilent Technologies (http://www.agilent.com).
Motif analysis
Discovery of the Foxp3 sequence motif from the ChIP-chip binding data was performed using the THEME algorithm. The Foxp3 motif learned by THEME and the Nfat motif from the TRANSFAC database (version 8.3) were used to scan all arrayed sequences to identify matches to the motifs.
Functional classification of bound genes
Comparison of Foxp3 target genes to annotated KEGG biological pathways was performed using the online DAVID tool (http://niaid.abcc.ncifcrf.gov/).
Gene expression profiling
For each hybridoma culture condition, total RNA was prepared from 1 ×10⁷ cells using Trizol (Gibco) followed by additional purification using the RNeasy Mini Kit (Qiagen). Biotinylated antisense cRNA was then prepared according to the Affymetrix standard labelling protocol (one amplification round). For each primary T-cell culture condition, total RNA was isolated from 5 × 10⁵ cells with RNeasy. Biotinylated antisense cRNA was prepared by two rounds of in vitro amplification using the BioArray RNA Amplification and Labelling System (Enzo Life Sciences) according to the protocol for 10–1,000 ng of input RNA provided by the manufacturer. Biotinylated cRNAs of hybridomas and primary T cells were fragmented and hybridized to Affymetrix GeneChip Mouse Expression Set 430 2.0 arrays at the Microarray Core Facility (Dana-Farber Cancer Institute).
Quantitative RT–PCR
To determine transcript levels in T-cell hybridomas and ex vivo T cells, RNA was isolated, reverse-transcribed and subjected to real-time PCR performed on an ABI PRISM thermal cycler using SYBR Green PCR core reagents (Applied Biosystems). Detailed information is provided in Supplementary Information.
Supplementary Material
Acknowledgments
We thank members of the Young, von Boehmer and Fraenkel laboratories, as well as R. Jaenisch and D. K. Gifford, for discussions and critical review of the manuscript, especially T. I. Lee, J. Zeitlinger and D. T. Odom. We also thank Biology and Research Computing (BaRC), especially T. Dicesare for graphic assistance, as well as E. Herbolsheimer for computational and technical support. K.K. was supported in part by a fellowship grant from the German Research Foundation. This work was supported in part by a donation from E. Radutzky, and by the Whitaker Foundation (E.F.) and the NIH (H.v.B. and R.A.Y.).
Footnotes
Supplementary Information is linked to the online version of the paper at www.nature.com/nature.
Author Contributions R.A.Y. and H.v.B. contributed both as senior and corresponding authors.
All microarray data from this study are available from ArrayExpress at the EBI (http://www.ebi.ac.uk/arrayexpress) under accession code E-TABM-154.
Reprints and permissions information is available at www.nature.com/reprints.
The authors declare competing financial interests: details accompany the full-text HTML version of the paper at www.nature.com/nature.
References
- 1.Sakaguchi S, Sakaguchi N, Asano M, Itoh M, Toda M. Immunologic self-tolerance maintained by activated T cells expressing IL-2 receptor alpha-chains (CD25). Breakdown of a single mechanism of self-tolerance causes various autoimmune diseases. J Immunol. 1995;155:1151–1164. [PubMed] [Google Scholar]
- 2.Baecher-Allan C, Hafler DA. Human regulatory T cells and their role in autoimmune disease. Immunol Rev. 2006;212:203–216. doi: 10.1111/j.0105-2896.2006.00417.x. [DOI] [PubMed] [Google Scholar]
- 3.Shevach EM. CD4+ CD25+ suppressor T cells: more questions than answers. Nature Rev Immunol. 2002;2:389–400. doi: 10.1038/nri821. [DOI] [PubMed] [Google Scholar]
- 4.von Boehmer H. Mechanisms of suppression by suppressor T cells. Nature Immunol. 2005;6:338–344. doi: 10.1038/ni1180. [DOI] [PubMed] [Google Scholar]
- 5.Hori S, Nomura T, Sakaguchi S. Control of regulatory T cell development by the transcription factor Foxp3. Science. 2003;299:1057–1061. doi: 10.1126/science.1079490. [DOI] [PubMed] [Google Scholar]
- 6.Fontenot JD, Gavin MA, Rudensky AY. Foxp3 programs the development and function of CD4+CD25+ regulatory T cells. Nature Immunol. 2003;4:330–336. doi: 10.1038/ni904. [DOI] [PubMed] [Google Scholar]
- 7.Khattri R, et al. An essential role for Scurfin in CD4+CD25+ T regulatory cells. Nature Immunol. 2003;4:337–342. doi: 10.1038/ni909. [DOI] [PubMed] [Google Scholar]
- 8.Fontenot JD, et al. Regulatory T cell lineage specification by the forkhead transcription factor foxp3. Immunity. 2005;22:329–341. doi: 10.1016/j.immuni.2005.01.016. [DOI] [PubMed] [Google Scholar]
- 9.Brunkow ME, et al. Disruption of a new forkhead/winged-helix protein, scurfin, results in the fatal lymphoproliferative disorder of the scurfy mouse. Nature Genet. 2001;27:68–73. doi: 10.1038/83784. [DOI] [PubMed] [Google Scholar]
- 10.Bennett CL, et al. The immune dysregulation, polyendocrinopathy, enteropathy, X-linked syndrome (IPEX) is caused by mutations of FOXP3. Nature Genet. 2001;27:20–21. doi: 10.1038/83713. [DOI] [PubMed] [Google Scholar]
- 11.Wildin RS, et al. X-linked neonatal diabetes mellitus, enteropathy and endocrinopathy syndrome is the human equivalent of mouse scurfy. Nature Genet. 2001;27:18–20. doi: 10.1038/83707. [DOI] [PubMed] [Google Scholar]
- 12.Wu Y, et al. FOXP3 controls regulatory T cell function through cooperation with NFAT. Cell. 2006;126:375–387. doi: 10.1016/j.cell.2006.05.042. [DOI] [PubMed] [Google Scholar]
- 13.Schubert LA, Jeffery E, Zhang Y, Ramsdell F, Ziegler SF. Scurfin (FOXP3) acts as a repressor of transcription and regulates T cell activation. J Biol Chem. 2001;276:37672–37679. doi: 10.1074/jbc.M104521200. [DOI] [PubMed] [Google Scholar]
- 14.Boyer LA, et al. Polycomb complexes repress developmental regulators in murine embryonic stem cells. Nature. 2006;441:349–353. doi: 10.1038/nature04733. [DOI] [PubMed] [Google Scholar]
- 15.Chen C, Rowell EA, Thomas RM, Hancock WW, Wells AD. Transcriptional regulation by Foxp3 is associated with direct promoter occupancy and modulation of histone acetylation. J Biol Chem. 2006;281:36828–36834. doi: 10.1074/jbc.M608848200. [DOI] [PubMed] [Google Scholar]
- 16.Kanehisa M, Goto S. KEGG: kyoto encyclopedia of genes and genomes. Nucleic Acids Res. 2000;28:27–30. doi: 10.1093/nar/28.1.27. [DOI] [PMC free article] [PubMed] [Google Scholar]
- 17.Cobb BS, et al. A role for Dicer in immune regulation. J Exp Med. 2006;203:2519–2527. doi: 10.1084/jem.20061692. [DOI] [PMC free article] [PubMed] [Google Scholar]
- 18.McHugh RS, et al. CD4+CD25+ immunoregulatory T cells: gene expression analysis reveals a functional role for the glucocorticoid-induced TNF receptor. Immunity. 2002;16:311–323. doi: 10.1016/s1074-7613(02)00280-7. [DOI] [PubMed] [Google Scholar]
- 19.Bruder D, et al. Neuropilin-1: a surface marker of regulatory T cells. Eur J Immunol. 2004;34:623–630. doi: 10.1002/eji.200324799. [DOI] [PubMed] [Google Scholar]
- 20.Iellem A, et al. Unique chemotactic response profile and specific expression of chemokine receptors CCR4 and CCR8 by CD4+CD25+ regulatory T cells. J Exp Med. 2001;194:847–853. doi: 10.1084/jem.194.6.847. [DOI] [PMC free article] [PubMed] [Google Scholar]
- 21.Harbison CT, et al. Transcriptional regulatory code of a eukaryotic genome. Nature. 2004;431:99–104. doi: 10.1038/nature02800. [DOI] [PMC free article] [PubMed] [Google Scholar]
- 22.Klein L, Khazaie K, von Boehmer H. In vivo dynamics of antigen-specific regulatory T cells not predicted from behavior in vitro. Proc Natl Acad Sci USA. 2003;100:8886–8892. doi: 10.1073/pnas.1533365100. [DOI] [PMC free article] [PubMed] [Google Scholar]
- 23.Jordan MS, et al. Thymic selection of CD4+CD25+ regulatory T cells induced by an agonist self-peptide. Nature Immunol. 2001;2:301–306. doi: 10.1038/86302. [DOI] [PubMed] [Google Scholar]
- 24.Kretschmer K, et al. Inducing and expanding regulatory T cell populations by foreign antigen. Nature Immunol. 2005;6:1219–1227. doi: 10.1038/ni1265. [DOI] [PubMed] [Google Scholar]
- 25.Stanford WL, et al. Altered proliferative response by T lymphocytes of Ly-6A (Sca-1) null mice. J Exp Med. 1997;186:705–717. doi: 10.1084/jem.186.5.705. [DOI] [PMC free article] [PubMed] [Google Scholar]
- 26.Myers LM, Vella AT. Interfacing T-cell effector and regulatory function through CD137 (4–1BB) co-stimulation. Trends Immunol. 2005;26:440–446. doi: 10.1016/j.it.2005.06.003. [DOI] [PubMed] [Google Scholar]
- 27.Bottini N, et al. A functional variant of lymphoid tyrosine phosphatase is associated with type I diabetes. Nature Genet. 2004;36:337–338. doi: 10.1038/ng1323. [DOI] [PubMed] [Google Scholar]
- 28.Wu J, et al. Identification of substrates of human protein-tyrosine phosphatase PTPN22. J Biol Chem. 2006;281:11002–11010. doi: 10.1074/jbc.M600498200. [DOI] [PubMed] [Google Scholar]
- 29.Bottini N, Vang T, Cucca F, Mustelin T. Role of PTPN22 in type 1 diabetes and other autoimmune diseases. Semin Immunol. 2006;18:207–213. doi: 10.1016/j.smim.2006.03.008. [DOI] [PubMed] [Google Scholar]
- 30.Vang T, et al. Autoimmune-associated lymphoid tyrosine phosphatase is a gain-of-function variant. Nature Genet. 2005;37:1317–1319. doi: 10.1038/ng1673. [DOI] [PubMed] [Google Scholar]
Associated Data
This section collects any data citations, data availability statements, or supplementary materials included in this article.


