Abstract
T-cell-based gamma interferon (IFN-γ) release assays (IGRAs) using Mycobacterium tuberculosis-specific antigens have shown higher sensitivity and specificity than the routine tuberculin skin test (TST). However, the effects of Mycobacterium bovis BCG vaccination and anti-tuberculosis (TB) treatment on dynamic T-cell responses to M. tuberculosis-specific antigens in active TB cases have rarely been investigated in regions where TB is endemic. Eighty-nine patients with active pulmonary TB (ATB) and 57 healthy controls (HC) from China were recruited and tested by sputum smear and culture, TSTs, and IGRAs with M. tuberculosis-specific antigens ESAT-6 and CFP-10 (T-SPOT.TB) as well as purified protein derivative (PPD) stimulation. All 146 participants were screened by the T-SPOT.TB assay at recruitment. T-SPOT.TB-positive rates in ATB and HC groups were 87.6% (78/89) and 21.1% (12/57), respectively. Of 38 ATB patients who were both TST and T-SPOT.TB tested, the positive rates were 73.7% (28/38) and 94.7% (36/38), respectively (P = 0.0215), and those in the HC group were 62.3% (33/53) and 18.9% (10/53), respectively (P < 0.0001). The T-SPOT.TB-positive rates declined during TB treatment and were 94.4% (51/54), 86.4% (19/22), and 61.5% (8/13) for ATB patients receiving 0- to 1-month, 1- to 3-month, and 3- to 6-month anti-TB treatment, respectively. The IGRA is a most promising test for both active TB and latent TB infection (LTBI) diagnosis due to the improvement of its specificity and convenience, especially in the Mycobacterium bovis BCG-vaccinated population. Furthermore, the T-SPOT.TB assay using ESAT-6 and CFP-10 in ATB patients during anti-TB treatment could serve as a potential predictor of therapeutic efficacy.
China still remains the country second highest burdened by tuberculosis (TB) in the world, with the estimated active TB incidence and TB prevalence of 98 per 100,000 population per year and 194 per 100,000 population, respectively, in 2007 according to a recently released WHO report (26). For decades, the routine diagnostic tools for Mycobacterium tuberculosis infection in latent and active cases have been the tuberculin skin test (TST), sputum smear, chest X ray, and microbiological culture, which have shown limited sensitivity and specificity in countries whose populations are routinely vaccinated with Mycobacterium bovis bacillus Calmette-Guérin (BCG) (22). In the United States, the diagnosis of latent TB infection (LTBI) is made with either the TST or the T-cell-based gamma interferon (IFN-γ) release assay (IGRA). LTBI is treated with isoniazid (INH; usually for 9 months) to prevent progression to TB disease. Up to 5% of immunocompetent persons will progress to TB disease at some time in the future, even decades after infection, if they are not treated for LTBI (14). However, most of the LTBI patients cannot be diagnosed by TST in China and other regions with BCG coverage. Thus, a rapid and accurate diagnosis is crucial for a TB control program.
Recently introduced IGRAs for M. tuberculosis infection have successfully been developed (1, 20), and their use is expanding due to a higher sensitivity and specificity than those of the TST (10, 12, 17, 21, 22). IGRAs detect T-cell-specific antigens (ESAT-6 and CFP-10) present in M. tuberculosis but absent from BCG and most environmental mycobacteria (9, 13). There are two IGRAs commercially available and licensed for use in the developed world: the T-SPOT.TB (Oxford Immunotec, Oxford, United Kingdom) and the whole-blood-based QuantiFERON-TB Gold In-Tube (QFT-G; Cellestis, Carnegie, Australia). Over the last few years, the IGRAs have gained approval in the United States and Europe, and a number of national guidelines have recommended their use in the diagnosis of LTBI (3, 15, 18).
Although IGRA tools have been evaluated broadly for the diagnosis of M. tuberculosis infection in developed countries (4, 21, 25), little is known regarding the dynamic antigen-specific T-cell responses of active TB cases during treatment in China where BCG vaccination is mandatory at birth. To evaluate the diagnostic power of IGRA tools compared with TST and dynamic M. tuberculosis-specific T-cell responses in active TB cases accepting consecutive treatment, we conducted a cross-sectional study in areas of high TB endemicity and BCG coverage in China. We believe these data would provide evidence for using IGRAs to better diagnose TB infection and evaluate the efficacy of anti-TB treatment in BCG-vaccinated populations.
MATERIALS AND METHODS
Participants and study design.
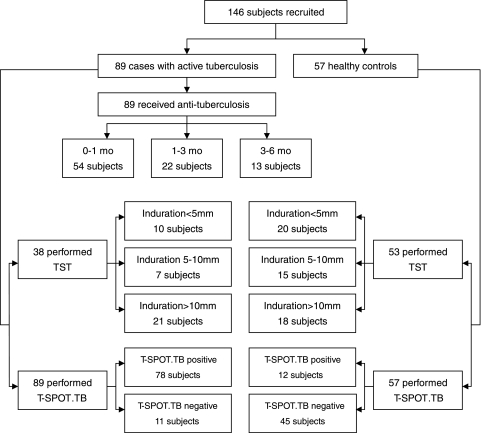
One hundred forty-six patients were enrolled in this cross-sectional study from 20 December 2006 to 31 May 2008, including 89 patients with active pulmonary TB and 57 healthy controls (Fig. 1). The enrollment was carried out in 3 areas located in north, east, and southwest China. Most of them had a scar in the deltoid areas, indicating that they had been BCG vaccinated. Eighty-nine patients from 3 hospitals located in these areas were diagnosed with active pulmonary TB based on extensive clinical evaluation of TB, including TB contact history, clinical manifestations, sputum smear of acid-fast bacilli (AFB), culture of M. tuberculosis, TST, and chest radiography. All patients received an initial anti-TB treatment shorter than 6 months. Sixty-five active-TB patients were confirmed by microbiological examination based on the results of smear microscopy for AFB and/or culture of M. tuberculosis from sputum. Among them, 18 patients with a negative smear and culture result were diagnosed with pulmonary TB based on the evidence of close TB contact history, clinical manifestations, chest radiography, and positive histopathological findings. Fifty-seven healthy blood donors who had no history of exposure to known active TB cases were recruited as healthy controls at low exposure risk of LTBI.
FIG. 1.
Flow chart showing numbers recruited in active tuberculosis patients and healthy control individuals. mo, month(s); TST, tuberculin skin test; T-SPOT.TB, commercial IGRA from Oxford Immunotec, Abingdon, United Kingdom.
TST.
A TST was performed on each participant at the time of initial assessment and read by the medical staff in the hospitals. Five tuberculin units (TU) of purified protein derivative (PPD) RT23 (Statens Seruminstitut, Copenhagen, Denmark) was applied intradermally in the medium third of the anterior surface of the left forearm according to the Mantoux method. After 72 h, the largest transverse diameters of the palpable hardened areas were measured with a millimeter ruler and ballpoint. They were classified as negative if the TST induration was smaller than 5 mm in diameter and as positive if the reaction was equal to or greater than 5 mm in diameter or if there was blistering.
Ex vivo IGRA.
The T-SPOT.TB kit (Oxford Immunotec Ltd., Oxford, United Kingdom) was employed to identify M. tuberculosis infection. Meanwhile, cells were also incubated with M. tuberculosis H37Rv PPD (Mycos Research LLC, Loveland, CO) at a final concentration of 25 μg/ml, and IFN-γ production was detected using the enzyme-linked immunospot (ELISPOT) assay. Briefly, a precoated IFN-γ ELISPOT plate was seeded with 2.5 × 10⁵ peripheral blood mononuclear cells (PBMCs) per well and incubated with media with no antigen (as a negative control), peptide antigens derived from ESAT-6 (labeled panel A), peptide antigens derived from CFP-10 (labeled panel B), M. tuberculosis H37Rv PPD, or phytohemagglutinin (as a positive control) in a 5% CO2 atmosphere at 37°C for 16 to 24 h. After counting spot-forming cells (SFCs) using an automated ELISPOT plate reader (AID-Gmb-H, Strassberg, Germany), the results of the T-SPOT.TB assay were considered positive if either panel A or panel B or both had six or more spots than the negative control or if this number was at least two times greater than that in the negative control. The results were double-checked by other lab workers and, if necessary, corrected by manual counting.
Statistical analysis.
The comparison of positive rates in different defined groups was analyzed using Pearson's chi-square test or Fisher's exact test. The difference between paired proportions was tested by McNemar's test. The differences in IFN-γ-producing T-cell responses among groups were analyzed using the nonparametric Mann-Whitney test on the counts of SFCs. Statistical significance was accepted when the P value was less than 0.05. The statistical analysis was performed using GraphPad PRISM software, version 5.01 (GraphPad Software, Inc.).
RESULTS
Demographic and clinical characteristics of participants in this study are shown in Table 1. Eighty-nine patients with active pulmonary TB were assigned to the active TB (ATB) group, and 57 healthy individuals without any history of exposure to known active TB cases were assigned to the healthy control (HC) group. The demographics of subjects in the two groups were comparable. The duration of anti-TB treatment of ATB patients was ≤6 months. Based on the duration of anti-TB treatment, these patients were divided into 3 subgroups: 0 to 1 month (including 1 month, n = 54), 1 to 3 months (including 3 months, n = 22), and 3 to 6 months (including 6 months, n = 13).
TABLE 1.
Baseline characteristics of the recruited subjects screened by T-SPOT.TB assay and TSTa
| Characteristic | Active tuberculosis | Healthy control |
|---|---|---|
| Total no. | 89 | 57 |
| No. (%) of males/females | 63 (70.8)/26 (29.2) | 23 (40.4)/34 (59.6) |
| Mean age, yr (range) | 43.6 (11-85) | 31.3 (21-70) |
| BCG vaccinated, n (%) | 78 (87.6) | 51 (89.5) |
| T-SPOT.TB assay, n (%) | 89 (100) | 57 (100) |
| No. positive | 78 (87.6) | 12 (21.1) |
| No. negative | 11 (12.4) | 45 (78.9) |
| TST, n (%) | 38 (42.7) | 53 (93.0) |
| Induration of <5 mm | 10 (26.3) | 20 (37.7) |
| Induration of 5 mm-10 mm | 7 (18.4) | 15 (28.3) |
| Induration of >10 mm | 21 (55.3) | 18 (34.0) |
| Anti-TB treatment, n (%) | 89 (100) | NA |
| 0-1 month | 54 (60.7) | |
| 1-3 months | 22 (24.7) | |
| 3-6 months | 13 (14.6) |
TST, tuberculin skin test; T-SPOT.TB, commercial IGRA from Oxford Immunotec, Abingdon, United Kingdom; NA, not applicable.
All 146 participants were screened by the T-SPOT.TB assay at recruitment. Seventy-eight of 89 (87.6%) ATB patients and 12 of 57 (21.1%) healthy individuals were T-SPOT.TB positive, while 11 of 89 (12.4%) ATB patients and 45 of 57 (78.9%) healthy individuals were T-SPOT.TB negative. Thirty-eight (42.7%) patients and 53 (93.0%) healthy individuals underwent the tuberculin skin test (TST) and recorded TST results. The positive rates of TST in groups of ATB and HC were 73.7% (28/38) and 62.3% (33/53), respectively. Stratified by the induration diameters, these participants were further divided into 3 subgroups: induration diameter of <5 mm, 5 to 10 mm, and >10 mm, which consisted of 10 patients (26.3%) and 20 healthy subjects (37.7%), 7 patients (18.4%) and 15 healthy subjects (28.3%), and 21 patients (55.3%) and 18 healthy subjects (34.0%), respectively. The TST results of 51 ATB patients and 4 healthy individuals were not available due to some logistic problems (i.e., some ATB patients had been confirmed by microbiological examination at admission, and then the TST was not performed on them at enrollment; some participants failed to go to the lab for the test or did not return for a TST reading).
The RD1-based IFN-γ release assay was more sensitive than the TST for detecting active M. tuberculosis infection.
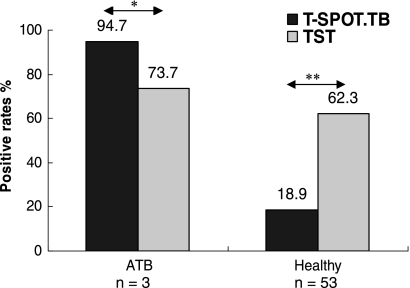
Thirty-eight ATB patients and 53 healthy individuals were simultaneously screened by the T-SPOT.TB assay and TST. To evaluate the sensitivity and specificity of these approaches, we compared the positive rates of two methods in these two population groups (Fig. 2). In the group of ATB, 36 of 38 subjects (94.7%) were T-SPOT.TB positive, whereas the TST-positive rate was only 73.7% (28/38 subjects, P = 0.0215). On the contrary, the T-SPOT.TB-positive rate in the HC group was only 18.9% (10/53 subjects), whereas the TST-positive rate was much higher (62.3%, 33/53 subjects, P = 0.000). These results demonstrated that the T-SPOT.TB assay was more sensitive than conventional TST for detecting active M. tuberculosis infection in BCG-vaccinated populations. On the other hand, those healthy individuals with positive T-SPOT.TB results could be defined as having latent TB infection. Therefore, latent TB infection might be misdiagnosed by TST for the healthy population in BCG-vaccinated populations.
FIG. 2.
The positive rates of T-SPOT.TB assay and TST in groups of ATB and HC. There were 38 ATB patients and 53 healthy individuals simultaneously screened by T-SPOT.TB assay and TST. *, P = 0.0215, and **, P = 0.000 comparing the positive rates of these two tests in groups of ATB and HC.
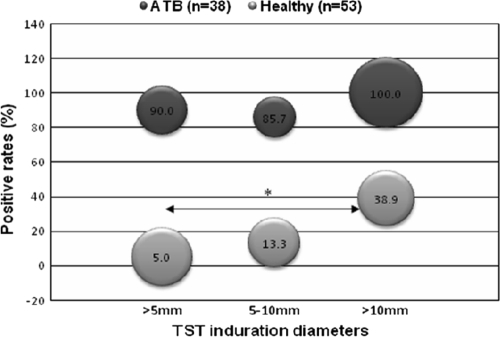
Furthermore, we compared the T-SPOT.TB-positive rates for ATB patients and HC according to different TST indurations (Fig. 3). When a 5-mm induration was used as the cutoff for the TST, 9 out of 10 ATB patients with negative TST results (induration of <5 mm) were T-SPOT.TB positive, while among healthy individuals, 1 out of 20 subjects with negative TST results were T-SPOT.TB positive. Therefore, this revealed that a significant portion of ATB patients was misdiagnosed by the TST. The T-SPOT.TB-positive rate for ATB patients with TST indurations of <5 mm, 5 to 10 mm, and >10 mm were 90.0%, 85.7%, and 100.0%, respectively, which indicated that the sensitivity of the T-SPOT.TB assay for detecting active TB infection was not influenced by the TST results. On the contrary, T-SPOT.TB-positive rates were relatively low for healthy individuals with different TST indurations (5.0% versus 13.3% versus 38.9%). Also, the tendency of T-SPOT.TB-positive rates was consistent with TST induration diameters. The T-SPOT.TB-positive rate for healthy individuals with a TST induration of >10 mm was significantly higher than that for those with a TST induration of <5 mm (38.9% versus 5.0%, P = 0.016), whereas a statistical difference was not found in other comparisons. Thus, this finding suggested that there were more latent TB infections in the population with TST indurations of >10 mm, which implied that a 10-mm induration should be used as the cutoff for the TST to detect latent TB in highly BCG-vaccinated populations.
FIG. 3.
The T-SPOT.TB positive rates in groups of ATB and HC, stratified by TST induration diameters (mm). T-SPOT.TB assay and TST were simultaneously performed on 38 ATB patients and 53 healthy individuals. The location of the bubble represents the T-SPOT.TB positive rate. The size of the bubble represents the percentage of subjects with positive results. The positive rate for ATB patients with indurations of <5 mm, 5 to 10 mm, and >10 mm were 26% (10/38), 18% (7/38), and 55% (21/38), respectively. The positive rate for the HC group with indurations of <5 mm, 5 to 10 mm, and >10 mm were 38% (20/53), 28% (15/53), and 34% (18/53), respectively. *, P = 0.016, comparing the T-SPOT.TB positive rate for healthy individuals with TST induration of >10 mm to TST induration of <5 mm.
IFN-γ-producing T-cell responses to PPD were apparently higher than those to M. tuberculosis-specific RD1 antigens.
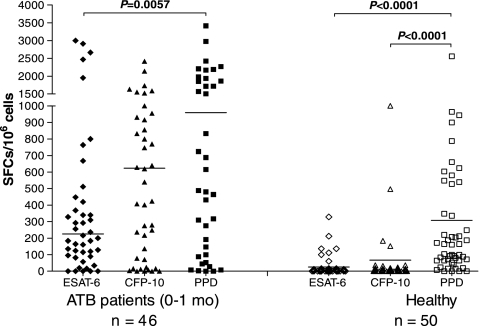
To appraise the IFN-γ-producing T-cell responses to PPD and M. tuberculosis-specific RD1 antigens in ATB patients receiving anti-TB treatment equal to or shorter than 1 month and HC, we compared the number of spot-forming cells (SFCs) induced by M. tuberculosis H37Rv PPD using the ELISPOT assay with that of those induced by RD1-specific antigens (ESAT-6 and CFP-10) in these two population groups (Fig. 4). In both groups, the median number of PPD-specific SFCs was apparently higher than those of ESAT-6- and CFP-10-specific SFCs (P < 0.05). In particular, the IFN-γ-producing T-cell responses to PPD were the strongest in healthy individuals (P < 0.0001), whereas the responses induced by ESAT-6 and CFP-10 were much lower, which further indicated that the RD1-based IFN-γ release assay was more specific than the conventional TST using PPD for diagnosing latent TB in the population with high BCG coverage.
FIG. 4.
The ESAT-6-, CFP-10-, and PPD-specific SFCs of ELISPOT assay with ATB patients and HC. Ex vivo ELISPOT assay was performed on 46 ATB patients receiving anti-TB treatment equal to or shorter than 1 month and 50 healthy individuals. The short transverse line represents median of SFCs in different subgroups.
IFN-γ-producing T-cell responses to M. tuberculosis-specific antigens decreased during the treatment with anti-TB regimens.
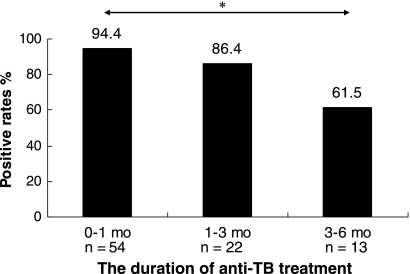
Eighty-nine ATB patients receiving an initial anti-TB treatment shorter than 6 months were divided into 3 subgroups based on the duration of the anti-TB treatment: 0 to 1 month, 1 to 3 months, and 3 to 6 months, for which the T-SPOT.TB-positive rates were 94.4% (51/54), 86.4% (19/22), and 61.5% (8/13), respectively. Moreover, the positive rate was 18.9% (10/53) in the HC group (Fig. 5). The T-SPOT.TB-positive rates declined accordingly with the duration of anti-TB treatment, and it was significantly lower in the group with 3- to 6-month treatment than that with 0 to 1 month (P < 0.005), which may indicate that the clearance of M. tuberculosis could have a predominant impact on the performance of the T-SPOT.TB assay.
FIG. 5.
The T-SPOT.TB positive rates for ATB patients with different durations of anti-TB treatment. Eighty-nine ATB patients receiving initial anti-TB treatment shorter than 6 months (mo) were screened by T-SPOT.TB assay and divided into 3 subgroups based on the duration of anti-TB treatment: 0 to 1 mo, n = 54; 1 to 3 mo, n = 22; 3 to 6 mo, n = 13. The medians of duration of anti-TB treatment were as follows: for 0 to 1 mo, 0 mo; for 1 to 3 mo, 2 mo; for 3 to 6 mo, 5 mo. *, P < 0.005, comparing the T-SPOT.TB positive rates for the 0- to 1-mo group to the 3- to 6-mo group.
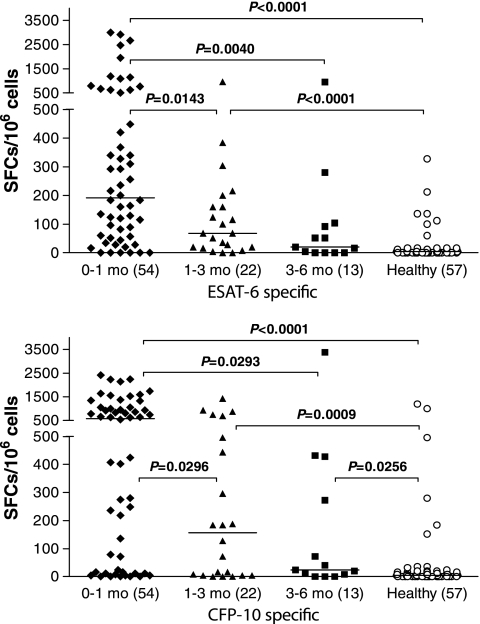
To evaluate the RD1-based IFN-γ-producing T-cell responses in ATB patients, we then sought to compare the number of SFCs induced by M. tuberculosis-specific antigens (ESAT-6 and CFP-10) in ATB patients with different durations of anti-TB treatment and in HC (Fig. 6). The median number of ESAT-6-specific SFCs in the treatment group of 0 to 1 month was significantly higher than those for the other three groups (all P < 0.05). Also, the median number of ESAT-6-specific SFCs in the treatment group of 3 to 6 months was similar to that in the HC group (20 versus 4 SFCs/106 peripheral blood mononuclear cells [PBMCs], P = 0.075). There was also a similar tendency of a decreasing CFP-10-specific IFN-γ-producing T-cell response with an increasing duration of anti-TB treatment. Therefore, these results demonstrated that the decrease in the M. tuberculosis-specific T-cell response in the ATB patients probably reflected a decreased antigenic and bacterial load in vivo induced by anti-TB treatment longer than 1 month. Interestingly, we found that the median number of CFP-10-specific SFCs was apparently higher than that of ESAT-6-specific SFCs in all subgroups with different durations, particularly in the groups of 0 to 1 month (580 versus 192 SFCs/106 PBMCs) and 1 to 3 months (156 versus 68 SFCs/106 PBMCs). It was suggested that the RD1-based IFN-γ-producing T-cell response induced by CFP-10 might be stronger than that by ESAT-6, especially in ATB patients with anti-TB treatment equal to or shorter than 3 months.
FIG. 6.
The ESAT-6- and CFP-10-specific spot-forming cells of T-SPOT.TB assay in ATB patients with different durations of anti-TB treatment and HC group. T-SPOT.TB assay was performed with 89 ATB patients receiving initial anti-TB treatment shorter than 6 months and 57 healthy individuals. The short transverse line represents median of SFCs in different subgroups. Values in parentheses indicate n.
DISCUSSION
The diagnosis of tuberculosis in patients with a negative bacteriological examination is still problematic in clinical settings. In BCG-vaccinated populations, rapid and specific diagnostic tools are urgently needed to replace the TST due to the low specificity. The newly developed IGRAs, including T-SPOT.TB and QFT-G, have shown advances in TB diagnosis, but studies found that indeterminate results were common when using the QFT-G assay (2, 7, 11, 21). In this study, we employed T-SPOT.TB to evaluate the role of the IGRA in the diagnosis of active TB.
As expected, T-SPOT.TB showed higher sensitivity than the TST (94.7% versus 73.7%), which was consistent with previous studies, including a study performed in China (5, 6, 10, 13, 21). On the other hand, the positive rates of T-SPOT.TB and the TST in the HC group were 18.9% and 62.3%, respectively. The TST has proved to be a useful tool to determine M. tuberculosis infection. Nonetheless, the possibility of the cross-reaction of the TST with BCG vaccination in BCG-vaccinated populations attenuates the specificity of the TST in diagnosing tuberculosis. Therefore, the LTBI incidence of 18.9% determined by T-SPOT.TB was more convincing and accurate than that of 62.3% detected by the TST in this study, which indicated that the LTBI incidence would have been overestimated in the investigations using the TST in BCG-vaccinated populations. To date, the IGRA is the best promising test for LTBI diagnosis due to the improvement of specificity and convenience, especially with the BCG-vaccinated population (21, 24).
Furthermore, a more detailed analysis showed that a large proportion of ATB patients were misdiagnosed by the TST and a portion of healthy individuals was overdiagnosed with LTBI by the TST compared with the T-SPOT.TB assay. The subjects were divided into 3 subgroups according to TST induration diameters: <5 mm, 5 to 10 mm, and >10 mm. In ATB patients with TST indurations of <5 mm, which were apparently misdiagnosed by the TST, there were 90% with a positive T-SPOT.TB assay. Similarly, for healthy individuals with TST indurations of >10 mm, only 38.9% were T-SPOT.TB positive, which indicated that the positive TST results in the remaining part were very likely caused by the cross-reaction of BCG vaccination or infections with other nontuberculosis mycobacteria. More importantly, the false-positive rate of TST examination was much higher for those with 5- to 10-mm TST indurations than for those with indurations of >10 mm. Thus, we proposed that a TST induration diameter of >10 mm would be the ideal cutoff for screening LTBI in BCG-vaccinated populations.
Interestingly, PPD-specific T-cell responses in both ATB patients and healthy controls were different from responses to ESAT-6 and CFP-10. A previous study showed that the effector T-cell response of BCG vaccination was short lived and could be limited in higher, preexisting anti-mycobacterial immunity (19). Our study found that in ATB patients treated with anti-TB drugs for ≤1 month, PPD-specific T-cell responses were much higher than those to ESAT-6 detected by the ELISPOT (P = 0.0057), suggesting a lower specificity of PPD in ATB diagnosis. Similarly, in the HC group, PPD-specific T-cell responses were much higher than those to ESAT-6 and CFP-10 detected by the ELISPOT (both P < 0.0001), which was consistent with TST results using PPD. Therefore, in accordance with the T-SPOT.TB, our study strongly suggested that the false-positive results for PPD in the healthy population resulted in overestimation of LTBI in BCG-vaccinated populations.
Studies have shown that anti-TB treatment affected IGRA results with LTBI subjects (4, 8, 25) and active TB cases (16, 23). In this study, the positive rate of the T-SPOT.TB assay in ATB patients with 3- to 6-month anti-TB treatment was significantly decreased compared with that for patients with 0 to 1 month of treatment (P < 0.005). It is further suggested that M. tuberculosis-specific T-cell responses were significantly decreased over time during treatment but still significantly higher than those in the HC group. Thus, the T-SPOT.TB assay using ESAT-6 and CFP-10 in ATB patients during anti-TB treatment could serve as an effective predictor of therapeutic efficacy.
Conclusions.
IGRA is a most promising test for both active TB and LTBI diagnosis due to its improvements in specificity and convenience, especially in the BCG-vaccinated population. Furthermore, the T-SPOT.TB assay using ESAT-6 and CFP-10 in ATB patients during anti-TB treatment could serve as a potential predictor of therapeutic efficacy.
Acknowledgments
The present study was supported in part by the Key Technologies Research and Development Program for Infectious Diseases of China (2008ZX10001-008, 2008ZX10003-011, and 2008ZX10003-003) and the National Basic Research Program of China (973 Program 2005CB523102).
We have no potential conflicts of interest.
Footnotes
Published ahead of print on 13 October 2010.
REFERENCES
- 1.Andersen, P., M. E. Munk, J. M. Pollock, and T. M. Doherty. 2000. Specific immune-based diagnosis of tuberculosis. Lancet 356:1099-1104. [DOI] [PubMed] [Google Scholar]
- 2.Arend, S. M., S. F. Thijsen, E. M. Leyten, J. J. Bouwman, W. P. Franken, B. F. Koster, F. G. Cobelens, A. J. van Houte, and A. W. Bossink. 2007. Comparison of two interferon-gamma assays and tuberculin skin test for tracing tuberculosis contacts. Am. J. Respir. Crit. Care Med. 175:618-627. [DOI] [PubMed] [Google Scholar]
- 3.Canadian Tuberculosis Committee. 2007. Interferon gamma release assays for latent tuberculosis infection. An Advisory Committee Statement (ACS). Can. Commun. Dis. Rep. 33:1-18. [PubMed] [Google Scholar]
- 4.Chee, C. B., K. W. KhinMar, S. H. Gan, T. M. Barkham, M. Pushparani, and Y. T. Wang. 2007. Latent tuberculosis infection treatment and T-cell responses to Mycobacterium tuberculosis-specific antigens. Am. J. Respir. Crit. Care Med. 175:282-287. [DOI] [PubMed] [Google Scholar]
- 5.Chen, X., Q. Yang, M. Zhang, M. Graner, X. Zhu, N. Larmonier, M. Liao, W. Yu, Q. Deng, and B. Zhou. 2009. Diagnosis of active tuberculosis in China using an in-house gamma interferon enzyme-linked immunospot assay. Clin. Vaccine Immunol. 16:879-884. [DOI] [PMC free article] [PubMed] [Google Scholar]
- 6.Dheda, K., R. Z. Smit, M. Badri, and M. Pai. 2009. T-cell interferon-gamma release assays for the rapid immunodiagnosis of tuberculosis: clinical utility in high-burden vs. low-burden settings. Curr. Opin. Pulm. Med. 15:188-200. [DOI] [PubMed] [Google Scholar]
- 7.Ferrara, G., M. Losi, R. D'Amico, P. Roversi, R. Piro, M. Meacci, B. Meccugni, I. M. Dori, A. Andreani, B. M. Bergamini, C. Mussini, F. Rumpianesi, L. M. Fabbri, and L. Richeldi. 2006. Use in routine clinical practice of two commercial blood tests for diagnosis of infection with Mycobacterium tuberculosis: a prospective study. Lancet 367:1328-1334. [DOI] [PubMed] [Google Scholar]
- 8.Goletti, D., M. P. Parracino, O. Butera, F. Bizzoni, R. Casetti, D. Dainotto, G. Anzidei, C. Nisii, G. Ippolito, F. Poccia, and E. Girardi. 2007. Isoniazid prophylaxis differently modulates T-cell responses to RD1-epitopes in contacts recently exposed to Mycobacterium tuberculosis: a pilot study. Respir. Res. 8:5. [DOI] [PMC free article] [PubMed] [Google Scholar]
- 9.Harboe, M., T. Oettinger, H. G. Wiker, I. Rosenkrands, and P. Andersen. 1996. Evidence for occurrence of the ESAT-6 protein in Mycobacterium tuberculosis and virulent Mycobacterium bovis and for its absence in Mycobacterium bovis BCG. Infect. Immun. 64:16-22. [DOI] [PMC free article] [PubMed] [Google Scholar]
- 10.Jiang, W., L. Shao, Y. Zhang, S. Zhang, C. Meng, Y. Xu, L. Huang, Y. Wang, Y. Wang, X. Weng, and W. Zhang. 2009. High-sensitive and rapid detection of Mycobacterium tuberculosis infection by IFN-gamma release assay among HIV-infected individuals in BCG-vaccinated area. BMC Immunol. 10:31-37. [DOI] [PMC free article] [PubMed] [Google Scholar]
- 11.Kobashi, Y., T. Sugiu, K. Mouri, Y. Obase, N. Miyashita, and M. Oka. 2009. Indeterminate results of QuantiFERON TB-2G test performed in routine clinical practice. Eur. Respir. J. 33:812-815. [DOI] [PubMed] [Google Scholar]
- 12.Lalvani, A. 2001. Rapid detection of Mycobacterium tuberculosis infection by enumeration of antigen-specific T cells. Am. J. Respir. Crit. Care Med. 163:824-828. [DOI] [PubMed] [Google Scholar]
- 13.Lalvani, A., and M. Pareek. 2010. Interferon gamma release assays: principles and practice. Enferm. Infecc. Microbiol. Clin. 28:245-252. [DOI] [PubMed] [Google Scholar]
- 14.LoBue, P. A., D. A. Enarson, and T. C. Thoen. 2010. Tuberculosis in humans and its epidemiology, diagnosis and treatment in the United States. Int. J. Tuberc. Lung Dis. 14:1226-1232. [PubMed] [Google Scholar]
- 15.Mazurek, G. H., J. Jereb, P. Lobue, M. F. Iademarco, B. Metchock, and A. Vernon. 2005. Guidelines for using the QuantiFERON-TB Gold test for detecting Mycobacterium tuberculosis infection, United States. MMWR Recomm. Rep. 54:49-55. [PubMed] [Google Scholar]
- 16.Millington, K. A., J. A. Innes, S. Hackforth, T. S. C. Hinks, J. J. Deeks, D. P. S. Dosanjh, V. Guyot-Revol, R. Gunatheesan, P. Klenerman, and A. Lalvani. 2007. Dynamic relationship between IFN-γ and IL-2 profile of Mycobacterium tuberculosis-specific T cells and antigen load. J. Immunol. 178:5217-5226. [DOI] [PMC free article] [PubMed] [Google Scholar]
- 17.Mori, T., M. Sakatani, F. Yamagishi, T. Takashima, Y. Kawabe, K. Nagao, E. Shigeto, N. Harada, S. Mitarai, M. Okada, K. Suzuki, Y. Inoue, K. Tsuyuguchi, Y. Sasaki, G. H. Mazurek, and I. Tsuyuguchi. 2004. Specific detection of tuberculosis infection: an interferon-gamma-based assay using new antigens. Am. J. Respir. Crit. Care Med. 170:59-64. [DOI] [PubMed] [Google Scholar]
- 18.National Collaborating Centre for Chronic Conditions. 2006. Tuberculosis: clinical diagnosis and management of tuberculosis, and measures for its prevention and control. Royal College of Physicians, London, United Kingdom. [PubMed]
- 19.Ota, M. O., R. H. Brookes, P. C. Hill, P. K. Owiafe, H. B. Ibanga, S. Donkor, T. Awine, H. McShane, and R. A. Adegbola. 2007. The effect of tuberculin skin test and BCG vaccination on the expansion of PPD-specific IFN-gamma producing cells ex vivo. Vaccine 25:8861-8867. [DOI] [PubMed] [Google Scholar]
- 20.Pai, M., K. Dheda, J. Cunningham, F. Scano, and R. O'Brien. 2007. T-cell assays for the diagnosis of latent tuberculosis infection: moving the research agenda forward. Lancet Infect. Dis. 7:428-438. [DOI] [PubMed] [Google Scholar]
- 21.Pai, M., A. Zwerling, and D. Menzies. 2008. Systematic review: T-cell-based assays for the diagnosis of latent tuberculosis infection: an update. Ann. Intern. Med. 149:177-184. [DOI] [PMC free article] [PubMed] [Google Scholar]
- 22.Richeldi, L. 2006. An update on the diagnosis of tuberculosis infection. Am. J. Respir. Crit. Care Med. 174:736-742. [DOI] [PubMed] [Google Scholar]
- 23.Veenstraa, H., I. Crousa, S. Brahmbhatta, P. Lukeyc, N. Beyersb, P. D. van Heldena, and G. Walzl. 2007. Changes in the kinetics of intracellular IFN-γ production in TB patients during treatment. Clin. Immunol. 124:336-344. [DOI] [PubMed] [Google Scholar]
- 24.Whalen, C. C. 2005. Diagnosis of latent tuberculosis infection: measure for measure. JAMA 293:2785-2787. [DOI] [PubMed] [Google Scholar]
- 25.Wilkinson, K. A., O. M. Kon, S. M. Newton, G. Meintjes, R. N. Davidson, G. Pasvol, and R. J. Wilkinson. 2006. Effect of treatment of latent tuberculosis infection on the T cell response to Mycobacterium tuberculosis antigens. J. Infect. Dis. 193:354-359. [DOI] [PubMed] [Google Scholar]
- 26.World Health Organization. 2009. Global tuberculosis control: epidemiology, strategy, financing: WHO report 2009. WHO Press, Geneva, Switzerland.


