Abstract
Etravirine is a non-nucleoside reverse transcriptase inhibitor (NNRTI) that is active against NNRT-resistant HIV-1. A simple, sensitive, and specific LC-MS/MS method was developed and validated for the analysis of etravirine in rat plasma using itraconazole as the internal standard. The analytes were extracted with ethyl acetate and chromatographed on a reverse-phase XTerra MS C18 column. Elution was achieved with a mobile phase gradient varying the proportion of a 2 mM ammonium acetate aqueous solution containing 0.1% formic acid (solvent A) and a 0.1% formic acid in methanol solution (solvent B) at a flow rate of 300 μL/min. The analytes were monitored by tandem-mass spectrometry with positive electrospray ionization. The precursor/product transitions (m/z) in the positive ion mode were 435.9→163.6 and 706.7→392.6 for etravirine and the internal standard, respectively. Calibration curves were linear over the etravirine rat plasma concentration range of 1 ng/mL to 100 ng/mL. The inter- and intra-day accuracy and precision were within ±10%. The assay has been successfully used for pharmacokinetic evaluation of etravirine using the rat as an animal model.
Keywords: Etravirine, LC-MS/MS, Pharmacokinetics, rat plasma
1. Introduction
Etravirine is the first drug in the second generation of non-nucleoside reverse transcriptase inhibitors (NNRTIs) recently marketed for the treatment of HIV infection [1]. Etravirine is superior to first generation of NNRTIs in that it is active against NNRTI-resistant HIV-1 [2]. The recommended dose of etravirine is 200 mg (two 100 mg tablets) taken twice daily following a meal [3]. Etravirine is highly bound to plasma proteins and is primarily metabolized by cytochrome P450 CYP 3A4, 2C9, and 2C19 enzymes. Etravirine is categorized as a Biopharmaceutics Classification System Class IV compound (low water solubility and permeability). The compound is highly lipophilic with an octanol: water partition coefficient (log P) greater than 5 and an ionization constant (pKa) of 3.75 [4]. Despite its use in the clinical management of HIV infected patients, limited pharmacokinetic information is available regarding the absorption, distribution, metabolism, and excretion of etravirine following oral administration [5]. This information is important in the designs of optimal dosing regimens and ideal therapeutic strategies for HIV-infected patients. Due to its protein binding and hepatic metabolic characteristics, potential etravirine-drug interactions are expected [6]. For example, long-term use of NNRTIs can potentially cause HIV-related thromboembolic events [7–10], in which case the use of the anticoagulant warfarin is therapeutically indicated. A clinically significant etravirine-warfarin interaction could occur after their concomitant administration [11]. The pharmacokinetics of this potential etravirine-warfarin interaction is currently being explored in a rat animal model using the LC/MS/MS assay for etravirine in rat plasma described in the present study.
Several LC-MS/MS methods have been developed for the analysis of etravirine in human plasma samples. For example, Heine et al [12] developed an LC-MS/MS method to quantify etravirine in human plasma, dry blood spots, and peripheral blood mononuclear cell lysate. LC-tandem MS methods are also available for the simultaneous analysis in human plasma of etravirine with other NNRTIs [13, 14], and with protease inhibitors [15]. All of these methods involved a direct plasma protein precipitation step using an organic co-solvent, and have etravirine lower limits of quantifications (LLOQs) ranging from 5–40 ng/mL. The LC/MS/MS method of Rezk et al [16], involves an organic solvent extraction step and has a LLOQ of 2 ng/mL. Most of these LC-MS/MS methods were developed for clinical drug monitoring purposes.
The rat is commonly used as an animal model for the study of the pharmacokinetics of drugs like etravirine. These studies involve the collection of multiple blood samples from the same animal as a function of time. The limited timed plasma samples that can be obtained from the rat coupled with low plasma drug concentrations require the development of sensitive and specific plasma drug assay methods. No such method has been reported for the determination of etravirine in rat plasma. The reported LC-MS/MS methods for etravirine in human plasma lack the necessary sensitivity. Therefore, the purpose of this study was to develop a sensitive and specific LC/MS/MS method suitable for quantification of etravirine in rat plasma. The method has been successfully applied to the pharmacokinetic evaluation of etravirine using rat as an animal model.
2. Materials and methods
2.1. Chemicals
Etravirine standard powder (98% pure) was purchased from Toronto Research Chemicals, Inc. (North York, Ontario, Canada). Itraconazole, formic acid, and ammonium acetate were purchased from Sigma (St. Louis, MO). HPLC grade methanol (Mallinckrodt Baker Inc., Phillipsburg, NJ) was used as received. De-ionized water was obtained using a Milli-Q analytical deionization system (Millipore, Bedford, MA). Freshly obtained drug free rat plasma was collected from male Sprague-Dawley rats in our laboratory and stored at −80°C prior to use.
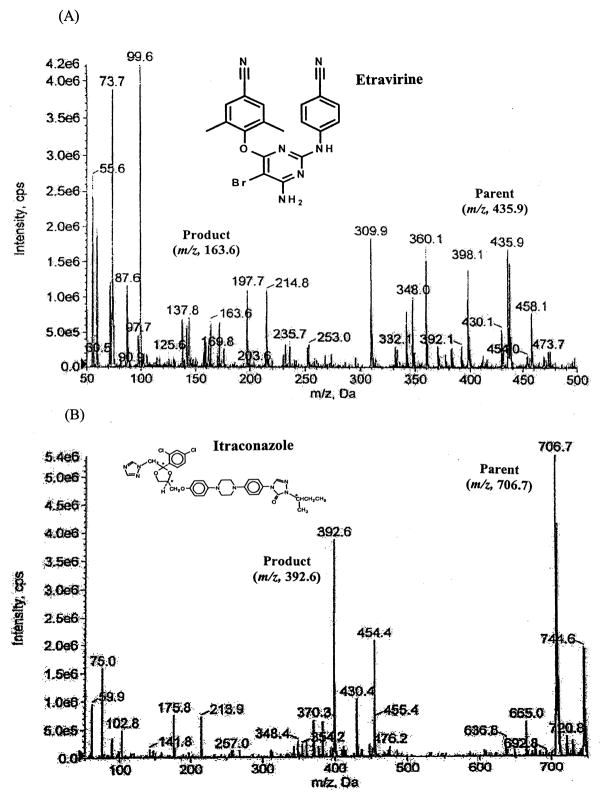
The chemical structures and fragmentation patterns for etravirine and the internal standard itraconazole are presented in Figure 1.
Figure 1.
Chemical structures and fragmentation patterns for etravirine (A) and the internal standard itraconazole (B).
2.2. LC/MS/MS
Chromatographic analysis was performed using an Agilent 1200 series HPLC system (Foster City, CA). Etravirine and the internal standard were separated on a reverse phase XTerra MS-C18 (50 mm×2.1 mm, 3.5 μm) in conjunction with an XTerra® MS C18 guard column (20×3.9 mm, 3.5 μm). The mobile phases consisted of a 2 mM ammonium acetate aqueous solution containing 0.1% formic acid (mobile phase A) and a 0.1 % formic acid in methanol solution (mobile phase B). A gradient elution starting with 40% mobile phase B was increased linearly to 100% mobile phase B over 5 min, kept constant at 100% B for 2 min, and then decreased to 40% B in 0.1 min, and this composition was maintained until the end of the run (8.0 min). The flow rate was set at 0.3 mL/min. The column effluent was monitored using a 3200 QTRAP® LC/MS/MS, which is a hybrid triple quadrupole linear ion trap equipped with a TurboIonSpray ion source. Pure nitrogen was generated by a Parker Balston Source 5000 Tri Gas Generator. The IonSpray heater was maintained at 650°C with both the nebulizer gas and heater gas set to 80 psi, respectively. IonSpray needle voltage was set to 4500 V, the curtain gas was set to 10 psi, and the collision CAD gas was set to medium.
Optimal multiple reaction monitoring (MRM) was used to detect transition ions from a specific precursor ion to product ion for etravirine ([M+H]+ m/z 435.9→163.6) and the internal standard ([M+H]+ m/z 706.7→392.6), respectively. The collision energy was set at 39 and 25 eV for etravirine and the internal standard, respectively. Other compound parameters were determined for each drug using the QTRAP instrument and version 1.5 of the Analyst® Software.
2.3. Preparation of standards and calibration curves
Separate stock solutions of etravirine and itraconazole (internal standard; IS) were prepared by dissolving 10 mg of each substance in 10-mL of methanol, and were refrigerated until used. A series of etravirine working standard solutions were prepared by appropriate dilutions of the stock etravirine standard solution (1 mg/mL) with a methanol:water (50:50, v/v) mixture to obtain the following etravirine concentrations: 1, 5, 10, 25, 50, 75, and 100 ng/mL. These seven standard methanolic solutions of etravirine were used to spike blank rat plasma with etravirine to yield calibration standards in plasma over the concentration range of 1 ng/mL to 100 ng/mL. Briefly, the etravirine spiking procedure involved transferring various aliquots (20–100 μL) of the etravirine working standard solutions to 2-mL eppendorf centrifuge tubes and evaporating the solvent to dryness under nitrogen. Blank plasma (100 μL) was then added to each tube and the tube was vortexed to dissolve the drug residue. Quality control samples were prepared in a similar manner at low, medium and high etravirine levels (2.5, 25, 50 ng/mL). An itraconazole internal standard solution (10 ng/mL) was also prepared by appropriate dilution of the itraconazole stock internal standard solution (1 mg/mL) with ethyl acetate.
2.4. Sample preparation
An aliquot of the plasma sample (100 μL) was extracted with 500 μL of ethyl acetate containing 10 ng/mL of the internal standard. After centrifugation, the separated organic supernatant was air dried. The residue was then reconstituted with 100 μL of a 50% methanol in water solution. Ten μL of the reconstituted solution was injected onto the reverse-phase XTerra MS C18 column.
2.5. Assay validation
The “Guidance for Industry – Bioanalytical Method Validation” document from the FDA was used as a guide for the assay validation described as follows [17].
2.5.1. Linearity, accuracy, precision, and recovery
Linear calibration curves in rat plasma were generated by plotting the peak area ratio of etravirine to the IS versus seven known plasma etravirine concentrations over the range of 1 ng/mL to 100 ng/mL. Slope, intercept and coefficient of determination values were estimated using least square regression analysis. Quality control plasma samples containing low, medium, and high etravirine concentrations were used to evaluate the precision and accuracy of the assay method. The intra-day assay precision and accuracy were obtained by analyzing six replicates of the quality control samples in duplicate using a calibration curve constructed on the same day. The inter-day assay precision and accuracy were obtained by analyzing six quality control samples in duplicate using calibration curves constructed on three different days. The assay precision was reflected by the relative standard deviation (RSD%) and the assay accuracy was reflected by the relative percentage error from the theoretical drug concentrations.
The limit of detection (LOD) was defined as the plasma concentration that yielded a peak height equal to three times that of baseline noise. The lowest limit of quantification (LLOQ) was selected as the lowest etravirine plasma level on the calibration curve. The extraction recoveries of etravirine from rat plasma (expressed as a percentage) were calculated as the ratio of the slope of a calibration curve for etravirine in spiked plasma to that in spiked mobile phase.
2.5.2. Stability
Three aliquots of the low and high concentration QC samples were used to conduct each of the following sets of stability tests: three freeze-thaw cycles, storage under refrigeration conditions (4 °C), and storage at room temperature. Long-term stability was tested by assaying the QC plasma samples after 30 days of storage at −80°C. Stock etravirine and internal standard solution stabilities were tested after 1 month of storage under refrigeration conditions.
2.5.3. Matrix effects
Matrix effects from endogenous substances present in extracted rat plasma may cause ion suppression or enhancement of the signal. Matrix effects were assessed by comparing the peak areas of etravirine after addition of low (n=3) and high (n=3) concentrations of etravirine to (A) mobile phase and (B) the supernatant of extracted blank plasma. These studies were conducted with 6 different lots of rat plasma. The peak area ratio of B/A (as a percentage) or the percentage matrix factor was used as a quantitative measure of the matrix effect.
2.6. Pharmacokinetic study
The animal experiment and protocol were reviewed and approved by the Institutional Animal Care and Use Committee at Texas Southern University. The jugular veins of five male adult Sprague-Dawley rats (Harlan Sprague Dawley, Inc., Indianapolis, IN) weighing 250–350 g were cannulated under anesthesia the day before the study. The animals were fasted overnight with water allowed ad libitum. Each rat was given a 200 mg/kg dose of etravirine by oral gavage using an animal feeding needle (18×3″W; 2–1/4 mm Ball). The etravirine dosing preparation was prepared by suspending powdered 100 mg commercial Intelence® tablets in a 1% Tween 80 aqueous solution. Serial heparinized blood samples (approximately 225 μL) were collected from the jugular vein cannular for up to 24 hours. After centrifugation, the plasma samples were collected, immediately stored in a −80°C freezer, and analyzed for etravirine content within 2 weeks.
3. Results and discussion
3.1. Chromatography
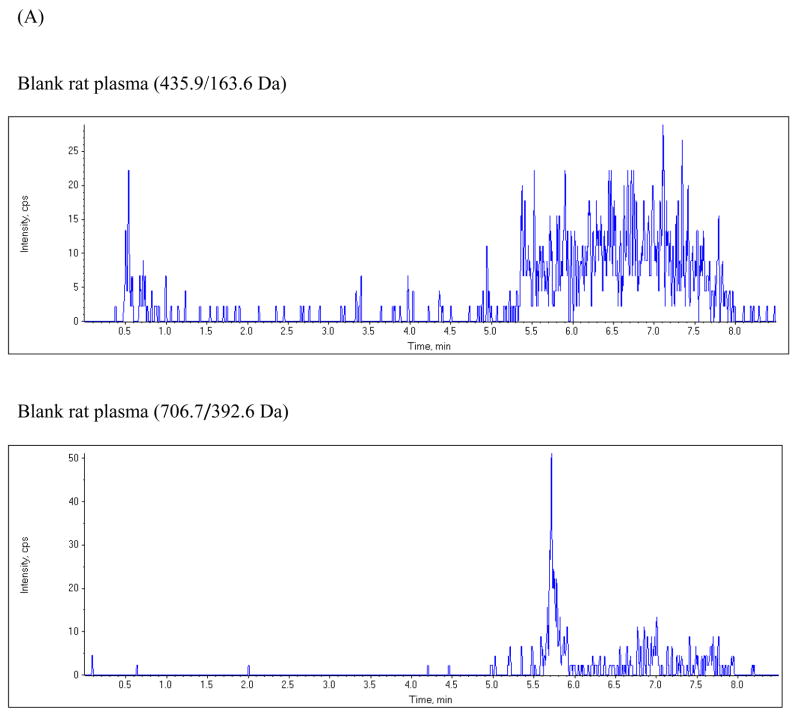
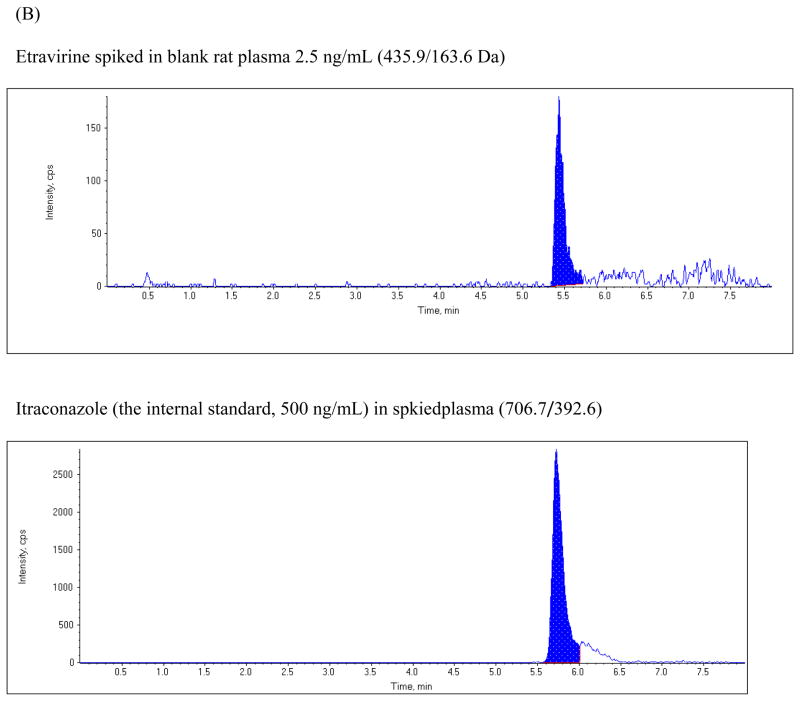
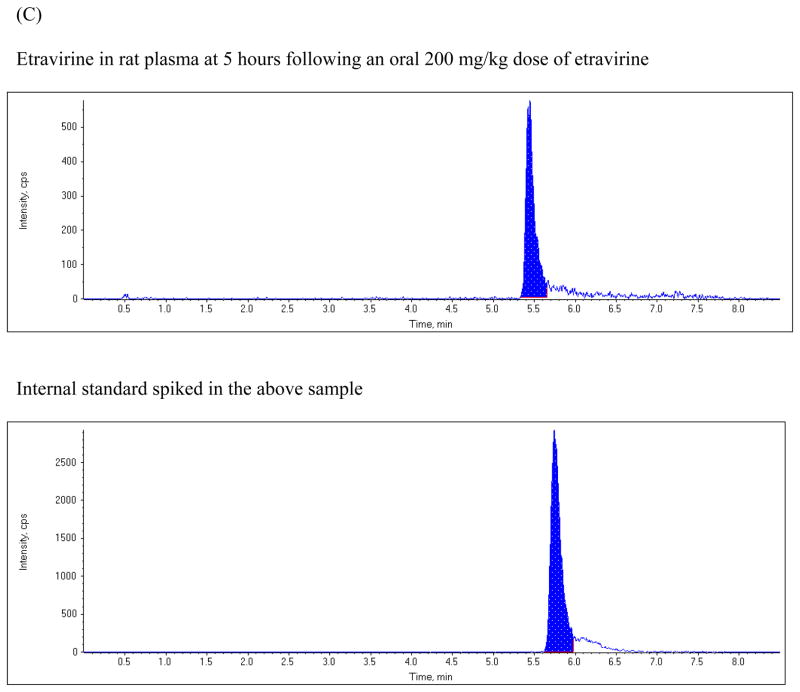
The chromatographic run time for the extracted plasma samples was 8 min. The retention time for etravirine and the internal standard were 5.43 and 5.73 min, respectively. Figure 2 shows typical representative chromatograms from blank plasma, from blank plasma spiked with etravirine, and from rat plasma obtained 5 hours following a 200 mg/kg oral dose of etravirine. The chromatogram shows baseline separation of etravirine and the internal standard without any interference from endogenous plasma components.
Figure 2.
Chromatograms of: (A) blank rat plasma, (B) blank rat plasma spiked with 2.5 ng/mL etravirine and the internal standard; (C) plasma sample from a rat at 5 hours after oral administration of a 200 mg/kg dose of etravirine.
3.2. Linearity, sensitivity and detection limit of the assay
The peak area ratios of etravirine to the internal standard in rat plasma were linear with respect to etravirine concentration over the range of 1–100 ng/mL. The intra- and inter-assay variabilities of the calibration curves are shown in Table 1. The lower limit of quantification (LLOQ) was 1 ng/mL for etravirine.
Table 1.
Linearity of calibration curves for etravirine in rat plasma
| Y-intercept | Slope | R2 | |
|---|---|---|---|
| Intra-day (n=3) | |||
| Mean | 0.0241 | 0.0151 | 0.9995 |
| SD | 0.0065 | 0.0002 | 0.0003 |
| CV% | 26.8 | 1.01 | 0.025 |
| Inter-day (n=5) | |||
| Mean | 0.0226 | 0.0152 | 0.9993 |
| SD | 0.0068 | 0.0003 | 0.0004 |
| CV% | 30.2 | 1.97 | 0.041 |
CV% = (standard deviation/mean)×100.
3.3. Extraction recovery
The mean recovery rate of etravirine, over the plasma concentration range of 1 to 100 ng/mL, was 85.1%±1.7% (n=3), as determined from the ratio of the slope of the etravirine calibration plot in plasma to that in mobile phase.
3.4. Accuracy and precision of the assay
The intra-day and inter-day precision and accuracy in rat plasma were evaluated using the low, medium, and high quality control spiked plasma samples. The intra-day (n=6) and inter-day (n=3) results obtained when the quality control samples were analyzed for etravirine are summarized in Table 2. All accuracy values for the intra- and inter-day studies were within acceptable limits (±10% relative error).
Table 2.
Precision and accuracy of the assay method for etravirine in rat plasma
| Theoretical concentration | |||
|---|---|---|---|
| Low (2.5 ng/mL) | Medium (25 ng/mL) | High (50 ng/mL) | |
| Intra-day (n=6) | |||
| Mean | 2.52 | 25.73 | 50.07 |
| SD | 0.06 | 0.31 | 0.19 |
| Precision (CV%) | 2.48 | 3.6 | 0.37 |
| Accuracy (% bias) | 0.93 | 0.24 | 0.13 |
| Inter-day (n=18) | |||
| Mean | 2.52 | 25.0 | 50.0 |
| SD | 0.06 | 0.44 | 0.44 |
| Precision (CV%) | 2.54 | 1.7 | 0.89 |
| Accuracy (% bias) | 0.8 | 3.35 | 0.01 |
CV% = (standard deviation/mean)×100.
%bias = [(measured concentration − theoretical concentration)/theoreti
3.5. Stability
The stock solution of etravirine in methanol (1 mg/mL) was stable for at least 1 month. Stability results in plasma are summarized in Table 3. Etravirine was stable in the extracted plasma samples at room temperature for at least 12 hours. The etravirine quality control samples were not affected by three freeze-thaw cycles. Etravirine was stable in plasma under refrigeration conditions for up to 12 hours, and was stable for up to 30 days when stored at −80°C.
Table 3.
Stability of etravirine in rat plasma
| Storage condition | Nominal concentration | Mean (± SD) percent of nominal concentration remaining (n=3) |
|---|---|---|
| 4°C temperature for 12 hours | ||
| 2.5 ng/mL in rat plasma | 99.7 ± 0.39 | |
| 50 ng/mL in rat plasma | 99.8 ± 4.9 | |
| Room temperature in the autosampler for 12 hours | ||
| A reconstituted solution from a 2.5 ng/mL QC sample extraction | 99.3 ± 0.11 | |
| A reconstituted solution from a 50 ng/mL QC sample extraction | 100.6 ± 6.5 | |
| −80°C temperature stored for 30 days | ||
| 2.5 ng/mL in rat plasma | 99.1 ± 2.3 | |
| 50 ng/mL in rat plasma | 106 ± 1.3 | |
| Freeze-thaw | ||
| Cycle 1 | 2.5 ng/mL in rat plasma | 105.0 ± 0.04 |
| 50 ng/mL in rat plasma | 102.3 ± 5.4 | |
| Cycle 2 | 2.5 ng/mL in rat plasma | 107.9 ± 0.04 |
| 50 ng/mL in rat plasma | 98.3 ± 2.8 | |
| Cycle 3 | 2.5 ng/mL in rat plasma | 110.6 ± 0.01 |
| 50 ng/mL in rat plasma | 113.0 ± 0.44 | |
3.6. Matrix effect
A mean percentage matrix factor (±SD) of 82.2 ± 1.4, reflective of the matrix effect, was calculated and found to be independent of etravirine plasma concentration and rat plasma lot. This result is in agreement with international guidelines and indicates low ion suppression (17, 18).
3.7. Application of the assay method
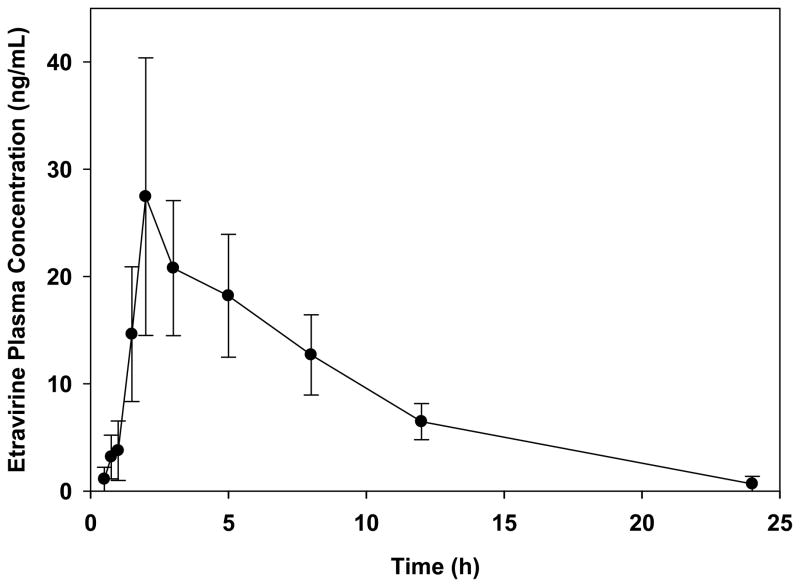
The assay method was applied to study the pharmacokinetics of orally administered extravirine using the rat as an animal model. Figure 3 shows the mean plasma concentration-time curve for etravirine following a 200 mg/kg oral dose of etravirine to five rats. The mean (±SD) area under the plasma concentration-time curve, maximum plasma concentration, and elimination half-life for etravirine were 223.9±38.2 ng-hr/mL, 28.0±12.0 ng/mL, and 5.78±2.8 hr, respectively, suggesting low oral bioavailability. Additional pharmacokinetic studies in rats are underway to characterize the effect of various physiochemical and physiological factors on the oral absorption of the drug, and the potential pharmacokinetic interaction between etravirine and the anticoagulant warfarin.
Figure 3.
Mean (±SD; n=5) plasma concentration-time profile of etravirine after an oral 200 mg/kg dose of etravirine to male Sprague-Dawley rats.
4. Conclusions
A simple, sensitive and rapid LC-MS/MS assay for the quantification of etravirine in small volumes (100 μL) of rat plasma was developed and validated. The method was shown to be specific, accurate, precise, and reproducible. The method has been successfully applied to the pharmacokinetic evaluation of orally administered etravirine using rat as an animal model, and is currently being applied for further pharmacokinetic characterizations of etravirine.
Acknowledgments
This publication was made possible in part by research infrastructure support from grant numbers RR03045-21 and CO6 RR012537 from the National Center for Research Resources (NCRR), a component of the National Institutes of Health (NIH). Its contents are solely the responsibility of the authors and do not necessarily represent the official views of NCRR or NIH.
Footnotes
Publisher's Disclaimer: This is a PDF file of an unedited manuscript that has been accepted for publication. As a service to our customers we are providing this early version of the manuscript. The manuscript will undergo copyediting, typesetting, and review of the resulting proof before it is published in its final citable form. Please note that during the production process errors may be discovered which could affect the content, and all legal disclaimers that apply to the journal pertain.
References
- 1.Johnson LB, Saravolatz LD. Clin Infect Dis. 2009;48:1123. doi: 10.1086/597469. [DOI] [PubMed] [Google Scholar]
- 2.Adams J, Patel N, Mankaryous N, Tadros M, Miller CD. Ann Pharmacother. 2010;44:157. doi: 10.1345/aph.1M359. [DOI] [PubMed] [Google Scholar]
- 3.INTELENCE® (etravirine) Tablets Package Insert. 2008. [Google Scholar]
- 4.Schöller-Gyüre M, Kakuda TN, Raoof A, De Smedt G, Hoetelmans RM. Clin Pharmacokinet. 2009;48:561. doi: 10.2165/10895940-000000000-00000. [DOI] [PubMed] [Google Scholar]
- 5.Crauwels HM, Kakuda TN. Clin Pharmacokinet. 2010;49:67. doi: 10.2165/11531240-000000000-00000. [DOI] [PubMed] [Google Scholar]
- 6.Dickinson L, Khoo S, Back D. Antiviral Res. 2010;85:176. doi: 10.1016/j.antiviral.2009.07.017. [DOI] [PubMed] [Google Scholar]
- 7.Ortiz G, Koch S, Romano JG, Forteza AM, Rabinstein AA. Neurology. 2007;68:1257. doi: 10.1212/01.wnl.0000259515.45579.1e. [DOI] [PubMed] [Google Scholar]
- 8.Matta F, Yaekoub AY, Stein PD. Am J Med Sci. 2008;336:402. doi: 10.1097/MAJ.0b013e31816dd2fd. [DOI] [PubMed] [Google Scholar]
- 9.Jacobson MC, Dezube BJ, Aboulafia DM. Clin Infect Dis. 2004;39:1214. doi: 10.1086/424664. [DOI] [PubMed] [Google Scholar]
- 10.Friis-Moller N, Sabin CA, Weber R, d’Arminio Monforte A, El-Sadr WM, Reiss P, Thiébaut R, Morfeldt L, De Wit S, Pradier C, Calvo G, Law MG, Kirk O, Phillips AN, Lundgren JD. N Engl J Med. 2003;349:1993. doi: 10.1056/NEJMoa030218. [DOI] [PubMed] [Google Scholar]
- 11.Liedtke MD, Rathbun RC. Ann Pharmacother. 2009;43:322. doi: 10.1345/aph.1L497. [DOI] [PubMed] [Google Scholar]
- 12.Heine RT, Rosing H, van Gorp EC, Mulder JW, Beijnen JH, Huitema AD. J Pharm Biomed Anal. 2009;49:393. doi: 10.1016/j.jpba.2008.10.040. [DOI] [PubMed] [Google Scholar]
- 13.Fayet A, Béguina B, Zanolaria B, Cruchona S, Guignarda N, Telentib A, Cavassinic M, Günthardd HF, Buclina T, Biollaza J, Rochate B, Decosterda LA. J Chromatogr B. 2009;877:1057. [Google Scholar]
- 14.Else L, Watson V, Tjia J, Hughes A, Siccardi M, Khoo S, Back D. J Chromatogr B. 2010;878:1455. doi: 10.1016/j.jchromb.2010.03.036. [DOI] [PubMed] [Google Scholar]
- 15.Quaranta S, Woloch C, Paccou A, Giocanti M, Solas C, Lacarelle B. Ther Drug Monit. 2009;31:695. doi: 10.1097/FTD.0b013e3181c05adf. [DOI] [PubMed] [Google Scholar]
- 16.Rezk NL, White NR, Jennings SH, Kashuba AD. Talanta. 2009;79:1372. doi: 10.1016/j.talanta.2009.06.005. [DOI] [PMC free article] [PubMed] [Google Scholar]
- 17.Guidance for Industry. Bioanalytical Method Validation, FDA. http://www.fda.gov/cder/guidance.
- 18.Koufopantelis P, Georgakakou S, Kazanis M, Giaginis C, Margeli A, Papargiri S, Panderi I. J Chromatogr B. 2009;877:3850. doi: 10.1016/j.jchromb.2009.09.034. [DOI] [PubMed] [Google Scholar]


