

Abstract
Background & Aims
Patients with Barrett’s esophagus (BE) show increased risk for developing esophageal adenocarcinoma and are routinely examined using upper endoscopy with biopsy to search for neoplastic changes. Angle-resolved low coherence interferometry (a/LCI) uses in vivo depth-resolved nuclear morphology measurements to detect dysplasia. We assessed the clinical utility of a/LCI in the endoscopic surveillance of BE patients.
Methods
Consecutive patients undergoing routine surveillance upper endoscopy for Barrett’s esophagus were recruited at two endoscopy centers. A novel, endoscope compatible a/LCI system was used to measure the mean diameter and refractive index of cell nuclei in esophageal epithelium at 172 biopsy sites in 46 patients. At each site, an a/LCI measurement was taken and correlated with a concurrent endoscopic biopsy. Each biopsy was assessed histologically and classified as normal, non-dysplastic BE (NDBE), indeterminate for dysplasia, low-grade dysplasia (LGD), or high-grade dysplasia (HGD). The a/LCI data from multiple depths were analyzed to evaluate its ability to differentiate dysplastic from non-dysplastic tissue.
Results
Pathology characterized five of the scanned sites as HGD, eight as LGD, seventy-five as NDBE, seventy as normal tissue types and fourteen as indeterminate for dysplasia. The a/LCI nuclear size measurements separated dysplastic from non-dysplastic tissue at a statistically significant (P < .001) level for the tissue segment 200-300μm beneath the surface with an accuracy of 86% (147/172). A receiver operator characteristic (ROC) analysis indicated an area under the curve (AUC) of 0.91, and an optimized decision point gave 100% (13/13) sensitivity and 84% (134/159) specificity.
Conclusions
These preliminary data suggest a/LCI is accurate in detecting dysplasia in vivo in BE patients.
Keywords: Barrett’s esophagus, optical techniques, light scattering
Introduction
Esophageal adenocarcinoma is rapidly increasing in incidence in the United States.1 Barrett’s esophagus (BE), a metaplastic transformation of the esophageal lining from squamous epithelium to a specialized columnar epithelium containing goblet cells, has long been recognized as a precursor lesion to esophageal adenocarcinoma.2, 3 BE is thought to progress through stages of dysplasia before developing into esophageal adenocarcinoma. The incidence of adenocarcinoma in patients with BE increases with the degree of dysplasia from approximately 0.5% per year4, 5 in non-dysplastic BE, rising to as high as 15-20% per year in subjects with HGD.6, 7 Current techniques for endoscopic monitoring of the disease represent a large cost burden, the value of which has been called into question.8
The current procedure commonly used for monitoring tissue health in Barrett’s esophagus patients consists of periodic endoscopic surveillance with systematic biopsies. Four-quadrant biopsies are taken at 1-2 centimeter intervals along the entire segment of affected esophageal tissue. Surveillance procedures call for periodic examinations, with the frequency dictated by the degree of dysplasia observed.4 This approach has inherent limitations. Due to the need for sample processing, there is a time delay between endoscopy and diagnosis, requiring separate procedures for detection of dysplasia and treatment. In addition, diagnostic uncertainty often results due to the difficulties in analyzing the small, often histologically ambiguous tissue samples obtained during a standard biopsy, limiting inter-observer agreement between pathologists.9, 10 There is also a risk of misdiagnosis due to sampling error in the affected tissue because of the small surface area that can be examined using four-quadrant biopsy techniques, estimated to be between four and six percent of the metaplastic epithelium.11
Developments in interventional therapies, such as radiofrequency ablation,6 photodynamic therapy,12 and cryotherapy,13 show great promise for management of Barrett’s esophagus, with the potential to reduce the risk of cancer in patients found to have dysplasia. The limitations of currently accepted methods for monitoring and evaluating the disease state of Barrett’s esophagus patients, coupled with the benefit from early diagnosis of dysplasia, points to an unmet need for additional tools to improve detection of dysplasia.
One promising approach for improving dysplasia detection is the use of optical biopsy techniques based on light scattering measurements. The dominant interaction between light and tissue is elastic scattering, where light is delivered in one direction and scattered in another without a change in energy (wavelength). By controlling the delivery and collection geometry, it is possible to collect backscattered light and analyze its characteristics in order to infer morphological structure within tissues, such as the size and distribution of cell nuclei. Several optical biopsy technologies have been developed for use during endoscopic procedures, including light scattering spectroscopy,14, 15 four-dimensional elastic light-scattering fingerprinting (4D-ELF),16 endoscopic confocal microscopy17 and fluorescence imaging.18-21
We report the application of a novel light scattering technique, angle-resolved low coherence interferometry (a/LCI), that analyzes the angular distribution of elastically scattered light to make depth-resolved measurements of both the size and index of refraction of cell nuclei, as a means to evaluate dysplasia in the setting of BE. This technology was adapted for probe-based delivery through the instrument channel,22 and its operating characteristics assessed in a clinical study.
Methods
Clinical Study Protocol
Fifty consecutively enrolled subjects undergoing routine endoscopic surveillance for BE at one of two tertiary centers specializing in the care of subjects with BE provided informed consent for this study. All subjects were receiving acid suppressive therapy with proton pump inhibitors once to twice daily, and none had undergone previous ablative therapy or displayed evidence of esophagitis. Patients with a history of esophageal cancer or esophageal resection were excluded. The characteristics of the patient population for this study are shown in Table 1.
Table 1.
Patient characteristics for population of patients scanned in this study.
| Demographic Charactersistics of the Study Cohort | |
|---|---|
| Age | 38-86 (μ=62, σ=11.6) |
| Sex | 29 Male, 17 Female |
| Previously detected dysplasia | 10/46 (22%) |
| Previously detected adenocarcinoma | 0/46 (0%) |
In each patient, 3-6 mucosal locations of columnar mucosa in the tubular esophagus were imaged using the a/LCI system (Figure 1) at random points. A matching histological biopsy was obtained at each imaged point. The protocol for image and biopsy acquisition was as follows: upon selection of an imaging site, the endoscopist deployed the a/LCI fiber probe through the accessory channel and into the esophagus. The probe was brought into contact with the surface of the tissue and 10-30 data acquisitions of 25 milliseconds each were taken at each imaging location. Real-time analysis of image quality was performed in the room by a technician, who advised re-positioning of the probe in the case of poor signal quality. Following data collection with the a/LCI system, the fiber probe was removed from the instrument channel, and biopsy forceps were deployed to collect a tissue biopsy at precisely the same location. Guidance for localization of the physical biopsies was facilitated by a clearly visible, but temporary, indentation left by an approximately 1 mm protruding rim on the surface of the a/LCI probe (white arrow in Figure 1B). The entire study consisted of 172 unique paired biopsies, for which a total of 3,397 data scans were acquired and analyzed.
Figure 1.

A) High-level a/LCI system diagram. Inset shows scale of probe tip compared to a U.S. dime. B) Image showing characteristic mark left by a/LCI probe following deployment, indicated by the white arrow. C) Detail of the a/LCI probe tip. Light is delivered as a collimated beam to the tissue. Scattered light is collected across the face of the fiber bundle for transport back to the a/LCI system.
The biopsies collected from the scanned sites were fixed, sectioned, stained with hematoxylin and eosin and each analyzed by a pathologist at a central pathology laboratory with expertise in GI pathology to assess the presence and degree of dysplasia. Pathologists were blinded to the results of the a/LCI scan. The biopsies were classified as normal (squamous, gastric, squamo-columnar junction), non-dysplastic BE, BE indeterminate for dysplasia, BE positive for LGD, and BE positive for HGD. If biopsies at the squamo-columnar junction contained both squamous and gastric tissue, they were grouped with the ‘normal’ tissue types as they do not contain goblet cells. Any biopsy found to have dysplasia was confirmed by a second expert pathologist, with discrepancies resolved by consensus. The histological assessments of dysplasia were compared to measurements taken by the a/LCI system in order to determine the ability of a/LCI to identify dysplasia. The study design was approved by the Institutional Review Boards at the University of North Carolina at Chapel Hill and the Thompson Cancer Survival Center in Knoxville, TN.
Angle Resolved Low Coherence Interferometry (a/LCI)
The a/LCI method is based on measuring the angular distribution of scattered light as a function of depth beneath the tissue surface. The scattered light from each tissue layer is analyzed to determine the mean size and average density of the cell nuclei in the probed area.23, 24 The morphology of the cell nuclei is determined by comparison of the angular scattering data to the predictions of Mie theory, an analytical model of electromagnetic scattering by homogenous spheres.25, 26 While this theory assumes a spherical nucleus, mathematical27, 28 and experimental29, 30 studies have shown that accurate structural measurements of spheroids can be made with this approach. Further, previous studies of neoplastic transformation in animal models have shown that this approximation provides high sensitivity and specificity for discriminating non-dysplastic from dysplastic tissues.31-33 For the current study, the experimental data were analyzed by comparison to a database of Mie theory scattering solutions that describe the elastic light scattering patterns for a range of cell nuclei sizes and indices of refraction relative to the surrounding cytoplasm (representing nucleus density).
Depth resolution is achieved in a/LCI by using interferometry in a manner similar to that used in Fourier-domain optical coherence tomography.34 Light that has been scattered from the tissue is mixed with a reference light beam that has traveled a matched optical path, generating an interference pattern which appears as a spectral modulation in the detected signal. The spectrally resolved data are Fourier transformed to separate the scattered light by its pathlength within the tissue. The depth resolution that is achieved by this technique is set by the bandwidth of the light delivered.
Endoscopic Fiber Probe
We developed a fiber-optic probe for clinical a/LCI operation that is compatible with the accessory channel of a standard endoscope.22, 35 The probe is 230 cm in length, long enough to pass through the accessory channel of a 105 cm working distance gastroscope, and 2.5mm in diameter, compatible with the instrument channel of most endoscopes. The fiber probe is encased in a plastic sheath, for protection of the internal components, which also provides low friction to facilitate movement through the accessory channel. The distal end of the probe transmits light to the esophageal lumen via a polarization-maintaining optical fiber. To enable a/LCI measurements, the probe face is placed in contact with the tissue to provide a consistent geometrical interface. The incident light is formed into a collimated beam, approximately 0.4 mm in diameter and delivered to the tissue at an oblique angle using a small lens incorporated in the probe tip, as shown in Figure 1C. This lens also serves to collect the backscattered light as a function of scattering angle. The 0.4mm size of the beam represents the field of view probed by the a/LCI system in each data acquisition. The scattered light is relayed back to the a/LCI base unit via a 2.3m long imaging fiber bundle (Schott NA, Southbridge, MA, USA), which is 1.1mm in diameter and contains 18,000 optical fibers arranged in a parallel orientation relative to the delivery fiber.
Clinical a/LCI System
The a/LCI optical engine consists of a light source used to generate light for delivery to the tissue and an interferometer used to analyze the light returned from the tissue by the fiber probe (Figure 1A).22 The light source used by the a/LCI system is a superluminescent light-emitting diode (SLD – Superlum Ltd., Moscow, Russia) with a center wavelength of 832nm and 19 nm bandwidth. The large bandwidth is required to achieve depth resolution. The SLD output light is coupled into an optical fiber and split into reference and sample arms. The polarization of the light passed into the sample arm is controlled by an in-line polarizer before it is introduced into a polarization-maintaining fiber in the probe. The imaging fiber bundle in the probe returns the angular scattering pattern of light from the tissue to the optical engine. The light emerging from the proximal face of the fiber bundle is imaged onto the input slit of a spectrometer (SP 2150i, PI Acton, Acton, MA), after it is mixed with the pathlength-matched light from the reference fiber. The system is controlled by a laptop computer, which provides synchronized control of the delivery light and analyzes the detected signal in real time. The a/LCI systems allow for sub-second data collection (25 milliseconds per image) and processing of the scattered light, which enables multiple a/LCI data points to be acquired without significantly increasing procedure time. Because of the short acquisition time, respiratory variation does not impact image quality.
Image Data Analysis
The data collected during the optical biopsies were processed using the following procedures: Each scan was normalized to account for the specific characteristics of the fiber probe used during acquisition and then analyzed using the procedure described in Brown et al.,23 in which the angular scattering pattern contributed by the cell nuclei for each depth is isolated and compared to a predetermined database of scattering patterns, generated using Mie theory. The best fit for the detected signal from this database is selected using chi-squared analysis, and is used to identify the nuclear size and index of refraction for each tissue site and sub-surface location. Each analyzed point must pass three data quality checkpoints to confirm that a unique morphological determination has been found, including signal strength, comparison to the next best size and comparison to a null solution.23 Scans with inadequate signal for evaluation were discarded.
Each scan is analyzed in 50 μm depth increments and processed across the uppermost 500 μm of the tissue, yielding up to ten nuclear size and index of refraction measurements for each depth scan. For each scan, the surface of the tissue was identified from the depth resolved data and the uppermost 300 μm of the tissue was segmented into three 100 μm segments for analysis, by combining up to two measurements from each of the 50μm depth increments. This depth range covers the expected thickness of the epithelium of the probed tissue. To ensure that sufficient tissue scattering was present to generate a meaningful result, scans of low amplitude (caused by normal esophageal motion) were rejected. To generate a consensus size and index of refraction measurement for each segment from an individual paired biopsy site, the results for all individual qualifying scans taken at the site were averaged in order to create a unique size measurement for that specific site. Data from each of the three 100μm tissue layers were analyzed and compared independently to pathological diagnosis to determine if correlation with dysplastic state was possible at a statistically significant level.
Statistical Analysis
Statistical analyses were used to assess the association of dysplasia with morphological nuclear characteristics after adjusting for other relevant factors. Specifically, repeated measures logistic regression models were fit. For each model, the outcome variable was dichotomized as dysplasia vs. no dysplasia. The main predictor was the morphological nuclear characteristic (nuclear density or nuclear diameter at a depth of 0-100μm, 100-200μm and 200-300μm, for a total of six models). Potential confounders to be adjusted for were age, sex, site, baseline diagnosis and clinical diagnosis. A compound symmetric correlation matrix was used to account for the repeated measures within subjects and diagnostics were performed to assess the fit of the model to the data. Each of the potential confounders was entered into a model with the nuclear characteristic and those that proved statistically significant were included in the final model. P-values associated with type I error rates of less than 0.05 were considered statistically significant in this study. Analyses were done using SAS Version 9.2 (SAS Institute, Cary NC).
The relationship between sensitivity and specificity was determined through the development of a receiver operating characteristic (ROC) for the collected data. For this analysis, presence of dysplasia was considered as a binary classifier and nuclear diameter was used as an evaluation characteristic. In order to evaluate the value of nuclear size as a predictive classifier, the area under the ROC curve (AUC) was calculated as a fraction of the maximum possible AUC.
Inter-observer agreement between the a/LCI system and the independent pathologist was measured using the kappa statistic.36 The kappa statistic provides a framework for evaluating the agreement between two independent observers of the same data. Agreement between observers can be assessed by determining a characteristic kappa value between 1 (perfectly correlated) and -1 (anti-correlated). Kappa values less than zero were not observed in this study.
Results
Imaging Data
Forty-six patients (46) were scanned with an a/LCI system. Four additional patients were enrolled but not scanned due to technical difficulties. Typical a/LCI data are shown in Figure 2. Panel A shows an angle-resolved depth scan, which is created by Fourier-transforming the interferometric data collected by the spectrometer. Lighter shades of gray indicate higher intensity, which corresponds to higher levels of scattered light. Depth is indicated along the horizontal axis, with 0μm corresponding to the interface between the tip of the fiber probe and the tissue surface. A total of 3,397 scans were obtained, but scans that yielded low intensity were excluded, resulting in the dataset being reduced in size to 1,866 scans, corresponding to a 45% rejection rate. No patients or biopsies were discarded due to the rejection of individual scans. The collected data are summed across all angles and presented as an amplitude-scan (A-scan) in Panel B. This represents scattered light as a function of depth with tissue layers indicated. For processing, angle-resolved data are analyzed by depth in 50μm segments, as indicated in Panel B. For each depth segment, an angular profile of light scattered from the tissue is recovered. Once this angular profile has been filtered to remove noise, it is fit to the best Mie solution in order to determine its nuclear size and index of refraction. The creation of a single consensus size and index of refraction measurement for each depth at each biopsy site allowed the data to be reduced from 1,866 data points to 516 morphological measurements Panel C shows three example angular profiles from tissue types with varied pathological diagnoses. These angular profiles (solid line) are shown along with the best fit theory (dashed line) and the corresponding nuclear size.
Figure 2.

Typical a/LCI data. A) Angle-resolved depth scan of light scattered from tissue. Lighter shades of gray indicate increased amount of scattered light. B) A-scan indicating depth increments used for processing. Tissue layers are labeled and gray bar indicates basal layer. C) Example angular scans for three tissue types pictured (solid line) with best fit Mie theory solutions (dashed line) and size indicated.
Figure 3 shows a scatter plot of the mean nuclear size and average nuclear density for the basal epithelial layer (200-300 μm depth segment) for each paired biopsy in the study. From these data, a simple decision line can be drawn that well separates the samples diagnosed as normal tissue types versus those diagnosed as dysplastic. Placing the decision line at 11.84μm, as indicated in Figure 3 by the dashed black line, separates the two populations with maximum sensitivity and high specificity. Using this line, all 13 of the 13 biopsies pathologically assessed as dysplastic (LGD and HGD combined) were also flagged by the a/LCI technique as dysplastic (100% sensitivity, 95 % CI is (0.75, 1.00)). For non-dysplastic tissue (normal, non-dysplastic BE & BE indeterminate for dysplasia), 134 of these 159 biopsy sites were correctly categorized by the a/LCI technique as non-dysplastic (84% specificity, 95% CI is (0.78, 0.90)). Using the 11.84μm cut-off, the a/LCI technique accurately classified dysplastic tissue and non-dysplastic tissue at 147 of 172 biopsy sites (86% accuracy, 95% CI is (0.80, 0.91)). Use of this optimal decision line yielded a positive predictive value (PPV) of 34% (13/38) with a 95% CI of (0.20, 0.51) and a negative predictive value (NPV) of 100% (134/134) with a 95% CI of (0.97, 1.00). When biopsies demonstrating only squamous or gastric mucosa were disregarded and only biopsies in which BE is present were considered, then biopsies positive for dysplasia were distinguished from indeterminate and non-dysplastic BE with a sensitivity of 100% (13/13) with a 95% CI of (0.75, 1.00) and a specificity of 85% (76/89) with a 95% CI of (0.76, 0.92) using the same decision line.
Figure 3.

Scatter plot with each biopsy plotted as a function of its nuclear size and density, as measured by the a/LCI system, and categorized by its pathological diagnosis. Dashed black line indicates an optimized decision line between the two populations, resulting in 100% sensitivity and 84% specificity.
Receiver operating characteristic (ROC) curves were generated using nuclear size as the differentiating variable in order to determine the relationship between sensitivity and specificity (Figure 4). Biopsies identified in the pathology report as positive for dysplasia were characterized as diseased tissue (n = 13, true positives), while those identified as either indeterminate for dysplasia, non-dysplastic Barrett’s esophagus, squamous epithelium, gastric epithelium or squamo-columnar junction were classified as non-dysplastic tissue (n = 159, true negatives). Biopsies identified as indeterminate for dysplasia (n = 14) were treated as non-dysplastic in this analysis. The nuclear size data from the 200-300μm layer showed the strongest distinction between dysplastic and non-dysplastic tissue, with an AUC from the ROC curve of 0.91 (95% CI: 0.81, 1.00). For the ROC for the data from the first and second 100μm segments of tissue, the AUC values were 0.58 (95% CI: 0.42, 0.75) and 0.52 (95% CI: 0.36, 0.69) respectively, indicating that differentiation between dysplastic points and non-dysplastic points at these shallower depths was indiscriminant. ROC analysis indicated that the optimal decision line to maximize both sensitivity and specificity fell at 11.99μm. For this study the decision line was placed at 11.84μm, which maximized detection of dysplasia while sacrificing only a minimum of specificity.
Figure 4.

The receiver operator characteristic (ROC) curve for the depth segment between 200-300μm indicating relationship between sensitivity and specificity for varied decision lines using nuclear diameter as a discriminator. The gray area indicates the area under the curve (AUC = 0.91). ROC curves for depth segments from 0-100μm and 100-200μm (not shown) have an AUC of 0.58 and 0.52 respectively.
In unadjusted models, nuclear diameters between 0-100μm and 100-200μm and nuclear density between 200-300μm were not associated with a dysplastic diagnosis. An increase in nuclear diameter between 200-300μm (p=0.0001), in nuclear density between 0-100μm (p=0.004) and in nuclear density between 100-200μm (p=0.01) were associated with an increased likelihood of having dysplasia. Figure 5 shows the average nuclear diameter for all three 100 μm depth sections for each of the pathological categories (normal tissue, non-dysplastic BE and dysplasia). Increasing age predicted dysplasia in all models. Additionally, site of enrollment predicted dysplasia in 5 of the 6 models, with a higher proportion of subjects recruited at Thompson Cancer Survival Center displaying dysplasia. As a result age and site of enrollment were included adjusted models as appropriate. In the adjusted models, nuclear diameter between 0-100μm and 100-200μm, and nuclear density from 100-200μm were not predictive of dysplasia. Nuclear diameter from the mucosal layer 200-300μm beneath the surface (p=0.0001) and nuclear density for the 0-100μm deep layer (p = 0.009) were positively associated with having dysplasia and nuclear density for the 200-300μm deep layer (p=0.0009) was negatively associated with dysplasia. Regression diagnostics demonstrated a good fit of all constructed models. These results are summarized in Table 2.
Figure 5.
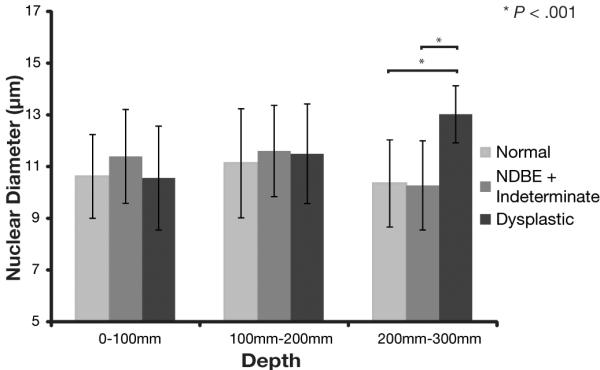
Nuclear size for each of the tissue layers segregated by pathological diagnosis.
Table 2.
Summary of statistical analysis used to differentiate dysplasia from non-dysplastic tissue in biopsy populations using both adjusted and unadjusted models. NS indicates that the specified characteristic did not differentiate dysplasia at a significant level (P < 0.05).
| Nuclear Characteristic | Variables Adjusted For | Unadjusted p-value | Adjusted p-value |
|---|---|---|---|
| Nuclear Diameter 0-100μm | Age, Site | NS | NS |
| Nuclear Diameter 100-200μm | Age, Site | NS | NS |
| Nuclear Diameter 200-300μm | Age, Site | 0.0001 | 0.0001 |
| Nuclear Density 0-100μm | Age | 0.004 | 0.009 |
| Nuclear Density 100-200μm | Age, Site | 0.01 | NS |
| Nuclear Density 200-300μm | Age, Site | NS | 0.0009 |
Using the kappa statistic to evaluate inter-observer agreement,36 a/LCI and histological biopsies agree at the “substantial” level for the distinction of dysplasia from non-dysplastic Barrett’s (κ = 0.60) and for the distinction of dysplastic versus normal tissue (κ = 0.60). When the normal tissue and non-dysplastic Barrett’s esophagus are grouped together as “non-dysplastic”, the inter-observer agreement is “moderate” (κ = 0.45).
Discussion
The data presented here demonstrate that a/LCI can detect a statistically significant enlargement of nuclear size in the basal layer of esophageal tissues found to be positive for dysplasia by histopathologic evaluation of biopsies. Analysis of the nuclear morphology data for the 200-300μm depth segment, which contains the basal layer of the epithelium, shows a correlation between increased nuclear size and the presence of dysplasia. This result is in agreement with previous a/LCI studies, in which nuclear size and index of refraction from the basal layer, contained in the third 100μm layer, has been shown to be of particular diagnostic use.23, 31 The high sensitivity and specificity demonstrated in this study suggests that a/LCI may have utility in a clinical setting as a guide to target biopsies. Current biopsy techniques are inherently restricted to evaluating the limited amount of tissue which can be physically extracted. It has been shown that in up to 25% of cases where dysplasia has been previously identified, it is not found in follow-up surveillance procedures.6, 37 This is likely due to the focal nature of the dysplastic changes, combined with sampling error associated with physical biopsies. Due to the limited tissue coverage, traditional biopsy procedures would benefit from the use of an adjunct imaging modality with the ability to provide complementary information that can identify suspicious tissue regions. Upon demonstrating adequate accuracy in detecting dysplastic tissue, this type of adjunct imaging modality could be used to improve and perhaps one day supplant histological biopsies in a surveillance examination. Since optical biopsy allows sampling of more tissue sites in less time and without the expense and diagnostic limitations associated with histological examination, it has significant potential to improve surveillance of BE tissues as an adjunct imaging modality. Further, the specific advantages of the a/LCI system, including rapid data acquisition and the potential for real-time analysis, could be exploited not only to increase surveillance coverage of at-risk tissues, but might also open up the possibility of therapeutic intervention within the same endoscopic session as the diagnostic procedure.
The sensitivity and specificity presented here are consistent with previous studies using this approach in which a/LCI has been shown to detect esophageal dysplasia in animal and human tissues. Dysplasia has been identified in situ in a rat carcinogenesis model with 100% sensitivity and 80% specificity (n=42).31 A follow-on prospective study in this model showed 91% sensitivity and 97% specificity (n=82) for predicting dysplasia.33 An endoscopic a/LCI system was able to detect dysplasia with 100% sensitivity and 100% specificity (n = 18) in ex-vivo human esophagus following resection of dysplastic BE tissue by esophagogastrectomy.38 A second human study examining dysplasia in BE in situ was conducted in the pathology laboratory with a portable system, yielding 100% sensitivity and 78% specificity (n = 15).23
Preliminary data are available for several other imaging modalities in detecting dysplasia in BE. Light-scattering spectroscopy, has also been used to detect dysplasia in patients with BE (n = 13).10 This technique analyzes the spectral content of scattered light as a function of wavelength in order to measure the distribution of enlarged nuclei between the tissue surface and an estimated penetration depth of 100-200μm. The approach was able to detect dysplasia (low- and high-grade combined) with sensitivity and specificity of 90% each. Georgakoudi et al. used a tri-modal spectroscopy technique that combines multiple spectroscopic measurements (fluorescence, reflectance and light-scattering spectroscopy) for the detection of dysplasia in patients with BE (n = 16).15 In this study, each of the aforementioned techniques was used to identify the presence of dysplasia. Intrinsic fluorescence spectroscopy and diffuse reflectance spectroscopy were both able to separate dysplastic from non-dysplastic tissue with 79% sensitivity and 88% specificity. Light scattering spectroscopy separated the same sample population with 93% sensitivity and 96% specificity. When the results of all three techniques are combined, the resulting multi-modal analysis was able to separate diseased tissue (low- and high-grade dysplasia combined) from non-dysplastic Barrett’s esophagus with 93% sensitivity and 100% specificity.15 A study conducted by Dunbar et al. used a recently developed confocal endomicroscope to examine patients with BE (n = 39) to detect neoplasia.39 Confocal endomicroscopy is capable of generating high-resolution images of the mucosal surface using an intravenously administered, exogenous contrast agent such as fluorescein. The images obtained in this study correlate with histology but require physician interpretation of the images to detect disease. By identifying the presence of irregular cells, the technique was able to predict BE-associated neoplasia with a sensitivity of 93% and a specificity of 98%. This technique, however, is typically limited to an image depth of less than 200μm, which does not allow examination of the tissue depth that was found in this study to possess the most valuable diagnostic information.
In this study, the nuclear size data gathered from 0-100μm and 100-200μm did not demonstrate diagnostic value. This may be due to confounding issues such as inflammation which is expected to preferentially affect the surface of the esophagus, or may be due to the fact that basal nuclei are most informative in regards to the state of dysplasia. The differentiation observed for the nuclear size in the 200-300μm depth segment of the epithelial tissue layer is significant. The ability of a/LCI to analyze this deep layer of tissue independently of the influence of the surface layers of the epithelium presents a unique capability not found in other endoscopic optical biopsy techniques used for the evaluation of Barrett’s esophagus.
The data from this study point to the potential clinical utility for a/LCI. The ability to provide quantitative depth-resolved measurements of nuclear morphology without the need for image interpretation or administration of a contrast agent is not found in current techniques. Alternative approaches, such as enhanced magnification endoscopy and endoscopic confocal microscopy, are able to provide detailed, high-resolution images of the epithelium, but these require histological interpretation by the endoscopist.39, 40 These techniques are also limited to investigation of the surface and topmost 100μm of tissue respectively, ignoring potentially relevant information regarding deeper tissue layers. Comprehensive imaging techniques, such as optical coherence tomography (OCT) can provide information about the entire epithelium, but also require histological interpretation of the images. In OCT, discrimination of dysplastic tissue is further complicated by the fact that most OCT systems do not possess the spatial resolution required for measurements of nuclear morphology.41
A shortcoming of the present study was the dichotomous nature of our outcome variable. While classifying outcomes as either “dysplastic” or “non-dysplastic” ignores the radically different clinical implications regarding degrees of dysplasia, it was useful to demonstrate proof of principle that the device could accurately discern between the two. It was also pragmatically necessary, given the small numbers of dysplastic biopsies in the study. Further work will characterize the ability of the device to discriminate between grades of dysplasia. Another factor which might impact the findings of this study, and therefore limit the utility of a/LCI, is the high rate of variability between pathologists in the diagnosis of dysplasia in BE, as cited above.9, 10 Since the “gold standard” for this study was histological reading by expert pathologists, any errors in classification the pathologists might turn a true positive into a false positive, or a true negative into a false negative, with respect to a/LCI imaging. Given the lack of other feasible gold standards for this study, as well as other studies which seek to validate new methods for detecting dysplasia, future work assessing the long term outcomes of subjects found to be positive for dysplasia by a/LCI nuclear morphology measurements but negative for dysplasia by histology, might illustrate the degree to which human error is impacting the present results.
In summary, this report presents the first clinical evaluation of a/LCI for detecting dysplasia in Barrett’s esophagus patients. This in vivo study demonstrates very strong agreement between pathological identification of dysplasia and nuclear enlargement, as measured using a/LCI, in the basal layer of epithelium. These results suggest that a/LCI has promise as a complementary diagnostic tool for physicians in the surveillance of BE patients for dysplasia. Development of real-time processing software would allow the endoscopist to identify suspicious tissue sites and collect biopsies in a more targeted and perhaps more effective manner. The very high NPV would allow an endoscopist to forgo biopsies at sites with a normal nuclear diameter, while targeting biopsies to more suspicious regions. Any adjunct imaging tool that can demonstrate an improvement in the ability to identify dysplasia at an early stage increases the opportunity to implement an effective therapy. Further studies are planned to validate the findings presented here, and to better define the ability of a/LCI as a tool for the endoscopic detection of dysplasia, both in the esophagus and at other organ sites.
Acknowledgements
This work was supported in part by the National Institutes of Health (National Cancer Institute R33-CA109907; DK 034987 and DK 056350), the National Science Foundation (BES 03-48204), a grant from the Coulter Foundation and funding by Oncoscope, Inc. through a National Institutes of Health SBIR Phase II Grant.
Grant Support: This work was supported in part by the National Institutes of Health (National Cancer Institute R33-CA109907; DK 034987 and DK 056350), the National Science Foundation (BES 03-48204), a grant from the Coulter Foundation and funding by Oncoscope, Inc. through a National Institutes of Health SBIR Phase II Grant.
Abbreviations
- 4D-ELF
4-dimensional elastic light-scattering fingerprinting
- a/LCI
angle-resolved low coherence interferometry
- A-scan
amplitude scan
- AUC
area under the curve
- BE
Barrett’s esophagus
- HGD
high-grade dysplasia
- LGD
low-grade dysplasia
- LSS
light-scattering spectroscopy
- NDBE
Non-dysplastic Barrett’s esophagus
- NPV
negative predictive value
- OCT
optical coherence tomography
- PPV
positive predictive value
- ROC
receiver operating characteristic
Footnotes
This is a PDF file of an unedited manuscript that has been accepted for publication. As a service to our customers we are providing this early version of the manuscript. The manuscript will undergo copyediting, typesetting, and review of the resulting proof before it is published in its final citable form. Please note that during the production process errors may be discovered which could affect the content, and all legal disclaimers that apply to the journal pertain.
Disclosures: Adam Wax and William J. Brown have financial interest in Oncoscope, Inc., the company that holds proprietary rights to the technology described in this study. Steven Gebhart and Neil Terry have consulting relationships with Oncoscope, Inc. John Goldblum, Bergein F. Overholt and Nicholas J. Shaheen receive research support from Oncoscope, Inc.
References
- 1.Jemal A, Siegel R, Ward E, et al. Cancer statistics, 2009. CA: A Cancer Journal for Clinicians. 2009;59:225. doi: 10.3322/caac.20006. [DOI] [PubMed] [Google Scholar]
- 2.Spechler SJ, Goyal RK. The columnar-lined esophagus, intestinal metaplasia, and Norman Barrett. Gastroenterology. 1996;110:614–21. doi: 10.1053/gast.1996.v110.agast960614. [DOI] [PubMed] [Google Scholar]
- 3.Spechler S. Barrett’s esophagus. 2006 GI Motility online. [Google Scholar]
- 4.Shaheen NJ, Richter JE. Barrett’s oesophagus. Lancet. 2009;373:850–61. doi: 10.1016/S0140-6736(09)60487-6. [DOI] [PubMed] [Google Scholar]
- 5.Yousef F, Cardwell C, Cantwell M, et al. The incidence of esophageal cancer and high-grade dysplasia in Barrett’s esophagus: a systematic review and meta-analysis. American Journal of Epidemiology. 2008 doi: 10.1093/aje/kwn121. [DOI] [PubMed] [Google Scholar]
- 6.Shaheen NJ, Sharma P, Overholt BF, et al. Radiofrequency ablation in Barrett’s esophagus with dysplasia. N Engl J Med. 2009;360:2277–88. doi: 10.1056/NEJMoa0808145. [DOI] [PubMed] [Google Scholar]
- 7.Overholt BF, Lightdale CJ, Wang KK, et al. Photodynamic therapy with porfimer sodium for ablation of high-grade dysplasia in Barrett’s esophagus: international, partially blinded, randomized phase III trial. Gastrointest Endosc. 2005;62:488–98. doi: 10.1016/j.gie.2005.06.047. [DOI] [PubMed] [Google Scholar]
- 8.Barritt ASt, Shaheen NJ. Should patients with Barrett’s oesophagus be kept under surveillance? The case against. Best Pract Res Clin Gastroenterol. 2008;22:741–50. doi: 10.1016/j.bpg.2007.12.005. [DOI] [PubMed] [Google Scholar]
- 9.Downs-Kelly E, Mendelin JE, Bennett AE, et al. Poor interobserver agreement in the distinction of high-grade dysplasia and adenocarcinoma in pretreatment Barrett’s esophagus biopsies. Am J Gastroenterol. 2008;103:2333–40. doi: 10.1111/j.1572-0241.2008.02020.x. [DOI] [PubMed] [Google Scholar]
- 10.Wallace MB, Perelman LT, Backman V, et al. Endoscopic detection of dysplasia in patients with Barrett’s esophagus using light-scattering spectroscopy. Gastroenterology. 2000;119:677–682. doi: 10.1053/gast.2000.16511. [DOI] [PubMed] [Google Scholar]
- 11.Sharma P. Clinical practice. Barrett’s esophagus. N Engl J Med. 2009;361:2548–56. doi: 10.1056/NEJMcp0902173. [DOI] [PubMed] [Google Scholar]
- 12.Overholt BF, Panjehpour M, Halberg DL. Photodynamic therapy for Barrett’s esophagus with dysplasia and/or early stage carcinoma: long-term results. Gastrointest Endosc. 2003;58:183–8. doi: 10.1067/mge.2003.327. [DOI] [PubMed] [Google Scholar]
- 13.Johnston MH, Eastone JA, Horwhat JD, et al. Cryoablation of Barrett’s esophagus: a pilot study. Gastrointest Endosc. 2005;62:842–8. doi: 10.1016/j.gie.2005.05.008. [DOI] [PubMed] [Google Scholar]
- 14.Backman V, Gopal V, Kalashnikov M, et al. Measuring cellular structure at submicrometer scale with light scattering spectroscopy. IEEE Journal of Selected Topics in Quantum Electronics. 2001;7:887–893. [Google Scholar]
- 15.Georgakoudi I, Jacobson BC, Van Dam J, et al. Fluorescence, reflectance, and light-scattering spectroscopy for evaluating dysplasia in patients with Barrett’s esophagus. Gastroenterology. 2001;120:1620–9. doi: 10.1053/gast.2001.24842. [DOI] [PubMed] [Google Scholar]
- 16.Roy HK, Liu Y, Wali RK, et al. Four-dimensional elastic light-scattering fingerprints as preneoplastic markers in the rat model of colon carcinogenesis. Gastroenterology. 2004;126:1071–81. doi: 10.1053/j.gastro.2004.01.009. discussion 948. [DOI] [PubMed] [Google Scholar]
- 17.Polglase AL, McLaren WJ, Skinner SA, et al. A fluorescence confocal endomicroscope for in vivo microscopy of the upper- and the lower-GI tract. Gastrointest Endosc. 2005;62:686–95. doi: 10.1016/j.gie.2005.05.021. [DOI] [PubMed] [Google Scholar]
- 18.Kara MA, Peters FP, Ten Kate FJ, et al. Endoscopic video autofluorescence imaging may improve the detection of early neoplasia in patients with Barrett’s esophagus. Gastrointest Endosc. 2005;61:679–85. doi: 10.1016/s0016-5107(04)02577-5. [DOI] [PubMed] [Google Scholar]
- 19.Fahmy M, Skacel M, Gramlich TL, et al. Chromosomal gains and genomic loss of p53 and p16 genes in Barrett’s esophagus detected by fluorescence in situ hybridization of cytology specimens. Mod Pathol. 2004;17:588–96. doi: 10.1038/modpathol.3800088. [DOI] [PubMed] [Google Scholar]
- 20.Brankley SM, Wang KK, Harwood AR, et al. The development of a fluorescence in situ hybridization assay for the detection of dysplasia and adenocarcinoma in Barrett’s esophagus. J Mol Diagn. 2006;8:260–7. doi: 10.2353/jmoldx.2006.050118. [DOI] [PMC free article] [PubMed] [Google Scholar]
- 21.Panjehpour M, Overholt BF, Vo-Dinh T, et al. Endoscopic fluorescence detection of high-grade dysplasia in Barrett’s esophagus. Gastroenterology. 1996;111:93–101. doi: 10.1053/gast.1996.v111.pm8698231. [DOI] [PubMed] [Google Scholar]
- 22.Zhu Y, Terry NG, Woosley JT, et al. Design and validation of an angle-resolved low coherence interferometry fiber probe for in vivo clinical measurements of depth-resolved nuclear morphology. Journal of Biomedial Optics. 2010 doi: 10.1117/1.3520130. in press. [DOI] [PMC free article] [PubMed] [Google Scholar]
- 23.Brown WJ, Pyhtila JW, Terry NG, et al. Review and Recent Development of Angle-Resolved Low-Coherence Interferometry for Detection of Precancerous Cells in Human Esophageal Epithelium. Selected Topics in Quantum Electronics, IEEE Journal of. 2008;14:88–97. [Google Scholar]
- 24.Wax A, Yang CH, Backman V, et al. Cellular organization and substructure measured using angle-resolved low-coherence interferometry. Biophysical Journal. 2002;82:2256–2264. doi: 10.1016/S0006-3495(02)75571-9. [DOI] [PMC free article] [PubMed] [Google Scholar]
- 25.Bohren CF, Huffman DR. Absorption and scattering of light by small particles. Wiley; 1983. [Google Scholar]
- 26.Hulst HCvd . Light scattering by small particles. Dover Publications; 1981. [Google Scholar]
- 27.Keener JD, Chalut KJ, Pyhtila JW, et al. Application of Mie theory to determine the structure of spheroidal scatterers in biological materials. Optics Letters. 2007;32:1326–1328. doi: 10.1364/ol.32.001326. [DOI] [PubMed] [Google Scholar]
- 28.Chalut KJ, Giacomelli MG, Wax A. Application of Mie theory to assess structure of spheroidal scattering in backscattering geometries. J Opt Soc Am A Opt Image Sci Vis. 2008;25:1866–74. doi: 10.1364/josaa.25.001866. [DOI] [PMC free article] [PubMed] [Google Scholar]
- 29.Chalut KJ, Chen S, Finan JD, et al. Label-free, high-throughput measurements of dynamic changes in cell nuclei using angle-resolved low coherence interferometry. Biophys J. 2008;94:4948–56. doi: 10.1529/biophysj.107.124107. [DOI] [PMC free article] [PubMed] [Google Scholar]
- 30.Amoozegar C, Giacomelli MG, Keener JD, et al. Experimental verification of T-matrix-based inverse light scattering analysis for assessing structure of spheroids as models of cell nuclei. Appl Opt. 2009;48:D20–5. doi: 10.1364/ao.48.000d20. [DOI] [PMC free article] [PubMed] [Google Scholar]
- 31.Wax A, Yang CH, Muller MG, et al. In situ detection of neoplastic transformation and chemopreventive effects in rat esophagus epithelium using angle-resolved low-coherence interferometry. Cancer Research. 2003;63:3556–3559. [PubMed] [Google Scholar]
- 32.Chalut KJ, Kresty LA, Pyhtila JW, et al. In situ assessment of intraepithelial neoplasia in hamster trachea epithelium using angle-resolved low-coherence interferometry. Cancer Epidemiology Biomarkers & Prevention. 2007;16:223–227. doi: 10.1158/1055-9965.EPI-06-0418. [DOI] [PubMed] [Google Scholar]
- 33.Wax A, Pyhtila JW, Graf RN, et al. Prospective grading of neoplastic change in rat esophagus epithelium using angle-resolved low-coherence interferometry. Journal of Biomedical Optics. 2005;10 doi: 10.1117/1.2102767. [DOI] [PubMed] [Google Scholar]
- 34.Choma MA, Sarunic MV, Yang CH, et al. Sensitivity advantage of swept source and Fourier domain optical coherence tomography. Optics Express. 2003;11:2183–2189. doi: 10.1364/oe.11.002183. [DOI] [PubMed] [Google Scholar]
- 35.Pyhtila JW, Boyer JD, Chalut KJ, et al. Fourier-domain angle-resolved low coherence interferometry through an endoscopic fiber bundle for light-scattering spectroscopy. Optics Letters. 2006;31:772–774. doi: 10.1364/ol.31.000772. [DOI] [PubMed] [Google Scholar]
- 36.Landis JR, Koch GG. The Measurement of Observer Agreement for Categorical Data. Biometrics. 1977;33:159–174. [PubMed] [Google Scholar]
- 37.Conio M, Blanchi S, Lapertosa G, et al. Long-term endoscopic surveillance of patients with Barrett’s esophagus. Incidence of dysplasia and adenocarcinoma: a prospective study. Am J Gastroenterol. 2003;98:1931–9. doi: 10.1111/j.1572-0241.2003.07666.x. [DOI] [PubMed] [Google Scholar]
- 38.Pyhtila JW, Chalut KJ, Boyer JD, et al. In situ detection of nuclear atypia in Barrett’s esophagus by using angle-resolved low-coherence interferometry. Gastrointestinal Endoscopy. 2007;65:487–491. doi: 10.1016/j.gie.2006.10.016. [DOI] [PubMed] [Google Scholar]
- 39.Dunbar KB, Okolo P, 3rd, Montgomery E, et al. Confocal laser endomicroscopy in Barrett’s esophagus and endoscopically inapparent Barrett’s neoplasia: a prospective, randomized, double-blind, controlled, crossover trial. Gastrointest Endosc. 2009;70:645–54. doi: 10.1016/j.gie.2009.02.009. [DOI] [PMC free article] [PubMed] [Google Scholar]
- 40.Curvers WL, Singh R, Song LM, et al. Endoscopic tri-modal imaging for detection of early neoplasia in Barrett’s oesophagus: a multi-centre feasibility study using high-resolution endoscopy, autofluorescence imaging and narrow band imaging incorporated in one endoscopy system. Gut. 2008;57:167–72. doi: 10.1136/gut.2007.134213. [DOI] [PubMed] [Google Scholar]
- 41.Isenberg G, Sivak MV, Jr., Chak A, et al. Accuracy of endoscopic optical coherence tomography in the detection of dysplasia in Barrett’s esophagus: a prospective, double-blinded study. Gastrointest Endosc. 2005;62:825–31. doi: 10.1016/j.gie.2005.07.048. [DOI] [PubMed] [Google Scholar]