Abstract
Basic fibroblast growth factor (FGF-2), an important modulator of cartilage and bone growth and differentiation, is expressed and regulated in osteoblastic cells. To investigate the role of FGF-2 in bone, we examined mice with a disruption of the Fgf2 gene. Measurement of trabecular bone architecture of the femoral metaphysis of Fgf2+/+ and Fgf2–/– adult mice by micro-CT revealed that the platelike trabecular structures were markedly reduced and many of the connecting rods of trabecular bone were lost in the Fgf2–/– mice. Dynamic histomorphometry confirmed a significant decrease in trabecular bone volume, mineral apposition, and bone formation rates. In addition, there was a profound decreased mineralization of bone marrow stromal cultures from Fgf2–/– mice. This study provides strong evidence that FGF-2 helps determine bone mass as well as bone formation.
Introduction
Basic fibroblast growth factor (FGF-2) influences the proliferation and differentiation of a variety of cell types in vitro (1–5). It is stored in the extracellular matrix (ECM) (3, 6, 7) and is expressed in osteoblasts (7). FGF-2 has been shown to be an important modulator of cartilage and bone cell function (2, 8–10). Previously, we reported that overexpression of FGF-2 in transgenic mice resulted in achondroplasia and shortening of the long bones (11). Fibroblast growth factor receptors (FGFRs) are also important regulators of bone growth and development and are differentially expressed in bone and cartilage (2, 12, 13). A number of human dysmorphic syndromes have been genetically linked to mutations in different FGFRs (2, 14, 15). Disruption of the FGFR3 gene in mice resulted in increased endochondral bone growth (16, 17), whereas mutations in FGFR2 increased expression of osteoblast differentiation markers in calvarial osteoblasts (18). FGFR2 is essential for limb bud initiation, and loss of FGFR1 results in distal truncation of mouse limb bud (19).
In bone cell cultures, FGF-2 stimulated replication (20) and reduced differentiation markers such as alkaline phosphatase and type 1 collagen (21–24). In contrast to continuous treatment, intermittent FGF-2 treatment stimulated bone formation in vitro (23) and in vivo (2, 25). In vivo studies in rats have consistently shown that FGF-2 stimulated new bone formation on endosteal and trabecular bone surfaces but not on periosteal surfaces (25–27). Several groups have reported on the anabolic effect of FGF-2 to restore bone mass in ovariectomized (OVX) rats (28–30), a well-established model for postmenopausal bone loss. FGF-2 not only stimulated bone formation on preexisting bone surfaces, but also induced de novo formation of bone spicules within the marrow cavity, resulting in partial restoration of the loss of cancellous bone mass in the osteopenic OVX rats (30). That FGF-2 treatment increased cancellous bone in the marrow cavity (25, 30) suggests that osteoblast precursors in the marrow cavity are a target cells for the effects of FGF-2. This observation is important, as bone marrow contains osteoblast precursors/stromal cells that synthesize FGF-2 (31) and responds to FGF-2 in an autocrine/paracrine manner (32–35). FGFs also play an important role in fracture repair in rats (36) and in humans (37). The Fgf2 gene is expressed at an early stage of fracture repair in granulation tissue at the fracture site (38). FGF-2 is also a potent stimulator of osteoclast formation and bone resorption (5, 39, 40). Thus, FGF-2 should be considered as an important regulator of osteoclastic-osteoblastic interaction or coupling.
FGF-2 is expressed in osteoblasts (20, 41–43), osteocytes, and periosteal cells (42). Fgf2 mRNA and protein levels are increased in osteoblasts by transforming growth factor β (41), prostaglandins (42), and parathyroid hormone (43). Thus, hormones and local factors, which have important functions in bone homeostasis, regulate FGF-2 production.
These data demonstrate that FGF signaling plays important roles in bone development. Because there are at least 17 FGFs besides FGF-2, many of which have multiple receptor specificities (44–50), it is important to determine which ligands play specific roles in skeletogenesis. Recently, Fgf2–/– mice were developed in a Black Swiss ×129 Sv genetic background (51). These mice are viable and reproduce. Fgf2–/– mice have decreased vascular smooth muscle contractility, low blood pressure, and thrombocytosis. They also have a diminished response to IL-3. a cytokine that stimulates hematopoietic multilineage proliferation and differentiation (52). Fgf2–/– mice were shown to have delayed wound healing (53) and neuronal defects and impaired development of the cerebral cortex (53, 54).
Because FGF-2 has profound effects on osteoblast replication and differentiation, we examined the effect that deletion of the Fgf2 gene had on bone formation. This study provides strong evidence that FGF-2 is an important determinant of bone mass and is a regulator of bone formation.
Methods
Mice were bred and housed in the transgenic facility in the center for laboratory animal care at the University of Connecticut Health Center. Mice were sacrificed by CO2 narcosis and cervical dislocation. Animal protocols were approved by the Animal Care Committee of the University of Connecticut Health Center.
Cell replication.
Osteoblastic cells populations of 2–5 cells that are a mixture of preosteoblasts, osteoblasts, and osteocytes were prepared from the calvariae of 8-week-old Fgf2+/+ and Fgf2–/– mice by sequential digestion with 0.1% collagenase (Boehringer Mannhiem Biochemicals Inc., Indianapolis, Indiana, USA) and plated in 100-mm dishes in DMEM with 10% heat inactivated FCS (Hyclone Laboratories, Logan, Utah, USA) for 12 days in a 5% CO2 incubator at 37°C. Cells were replated at a density of 5,000 cells/cm2 for 7 days with media change every 3 days. For labeling studies, [3H]thymidine (10 μCi/well) was added for the last 4 hours of the culture to measure cell proliferation (20).
Bone marrow stromal cultures.
Cells were isolated as described previously (55). Briefly, tibiae and femur from 6-month-old Fgf2+/+ and Fgf2–/– mice were dissected free of adhering tissue. The ends were removed, and the marrow cavity was flushed with α-MEM (GIBCO-BRL, Grand Island, New York, USA). Cells were plated at 2 × 10⁶ cells/well, unless stated otherwise, in 6-multiwell plates in αMEM containing 10% FCS; cultures were fed every 3 days with fresh differentiation media (αMEM, 10 nM dexamethasone, 10% FCS, 8 mM β-glycerophosphate, 50 μg/mL ascorbic acid). Cells were fixed and stained for alkaline phosphatase using a commercially available kit (Sigma Chemical Co., St. Louis, Missouri, USA). Colony number and area was determined by NIH Image (version 1.61; National Institutes of Health, Bethesda, Maryland, USA). Some dishes were then restained with von Kossa reagent to determine mineralization.
Measurement of mRNA levels.
Osteoblastic cells were prepared from calvariae of 8-week-old Fgf2+/+ and Fgf2–/– mice as already described here. Second-passage cells were plated at 5,000 cells/cm2 in DMEM with FCS (10%); ascorbic acid (50 μg/mL), and β-glycerophosphate (8 mM) for 7–21 days. Total RNA was extracted from cells by the method of Chomczynski and Sacchi (56). For Northern analysis, 20 μg of total RNA was denatured and fractionated on a 0.8% agarose/1.1 M formaldehyde gel, transferred to filters by capillary blotting or positive pressure, and fixed to the filter by ultraviolet irradiation (Stratalinker; Stratagene, La Jolla, California, USA) (57). After a 4-hour prehybridization, filters were hybridized overnight with a [32P]-labeled mouse cDNA probe for either Fgf1 or Fgf2 (58).
Bone histomorphometry.
Fgf2–/– mice appeared normal and had no significant size or weight differences compared with Fgf2+/+ mice. Fgf2+/+ and Fgf2–/– mice at 4.5 months or 8 months of age were weighed and injected on day 1 with calcein at 0.6 mg/100 g body weight; a second injection was administered on day 5; and mice were sacrificed on day 8. The right proximal tibiae were fixed with 10% buffered formalin followed by 100% ethanol, then embedded in methyl methacrylate (MMA), Five-micrometer–thick midfrontal sections of the proximal tibiae were obtained using a Reichert microtome (Reichert-Jung, Heidelburg, Germany). The left proximal tibiae were fixed with 4% paraformaldehyde and embedded in a mixture of MMA, hydroxyglyucol methacrylate, and 2-hydroxyethylacrylate. Polymerization was performed at 4°C. Then, undecalcified 5-μm sections were stained for tartrate-resistant acid phosphatase (TRAP) (59).
Histomorphometry was performed with a semiautomatic image-analyzing system linked to a light microscope (Cosmozone 1S; Nikon, Tokyo, Japan). The area of the secondary spongiosa was analyzed excluding the region within 0.5 mm of the growth plate-metaphyseal junction (60). The tibial metaphyseal cancellous bone area 4.5 mm distal to the growth plate-metaphyseal junction was analyzed. Trabecular bone volume density (BV/TV, %), was measured, and the trabecular thickness (Tb.Th, μm) and trabecular number (Tb.N, mm–1) were calculated by the parallel plate method of Parfitt et al. (61). The Tb.N was defined as the number of intersections between bone and nonbone components per total length of test lines applied to a specimen (62). Osteoclast surface (Oc.S/BS, %) and osteoclast number (Oc.N/BS, mm) were determined. Oc.N/BS, mm were TRAP-positive cells that formed resorption lacunae at the surface of the trabeculae and contained more than 1 nuclei that were identified as osteoclasts. For dynamic histomorphometry, mineralizing surface (DLS/BS, %), mineral apposition rate (MAR, μm/d), and bone formation rate (BFR/BS, μm3/μm2 per day) were also measured.
Micro-CT scanning of trabecular bone of the distal metaphysis of the femur of Fgf2+/+ and Fgf2–/– mice. The femoral cancellous bones of the distal metaphysis were analyzed by the micro-CT system (μCT-20; Scanco Medical, Zurich, Switzerland), as reported previously (63). Using 2-dimensional data from scanned slices, 3-dimensional analysis was performed to calculate morphometric indices including bone volume density (bone volume [BV]/tissue volume [TV]), trabecular thickness (Tb.Th = 2 × BV/bone surface [BS]), trabecular number [Tb.N = (BV/TV)/Tb.Th], and trabecular separation [Tb.Sp = (1/Tb.N) – Tb.Th]. These parameters were calculated by the parallel plate model of Parfitt et al. (61). The Tb.N was defined as the number of intersections between bone and nonbone components per total length of test lines applied to a specimen (62).
Statistical analysis.
Statistical significance among means was assessed by ANOVA and the Tukey-Kramer multiple comparison test when ANOVA demonstrated significant differences among means.
Results
FGF mRNA expression in calvarial osteoblasts from Fgf2+/+ and Fgf2–/–.
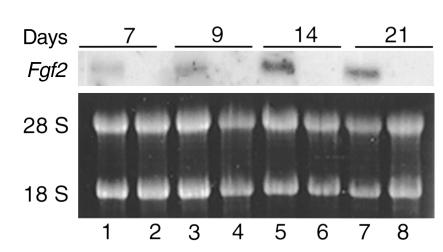
To confirm disruption of the Fgf2 gene, total RNA was extracted from calvarial osteoblastic cells from both genotypes. The upper panel in Figure 1 (lanes 1, 3, 5, and 7) shows the expression of a 6-kb Fgf2 mRNA transcript in osteoblastic cells from Fgf2+/+ mice. There was no detectable Fgf2 mRNA transcript in the osteoblasts from Fgf2–/– mice (Figure 1, lanes 2, 4, 6, and 8). Because acidic FGF (FGF-1) has similar effects as FGF-2 on bone (2) and is stored in the bone matrix (3), we determined whether it was expressed in osteoblasts from Fgf2–/– mice. Northern analysis showed no Fgf1 mRNA transcript in osteoblasts of either genotype. However, Fgf1 mRNA was expressed in brain tissue from Fgf2+/+ mice, which was used as a positive control (data not shown).
Figure 1.
Northern analysis for Fgf2 mRNA expression in primary calvarial osteoblasts prepared from 7-day-old Fgf2+/+ and Fgf2–/– mice. Total RNA was extracted from cells after 7, 9, 14, and 21 days of culture. A 6-kb Fgf2 mRNA transcript was expressed in calvarial osteoblast cultures from Fgf2+/+ mice (lanes 1, 3, 5, and 7). No Fgf2 mRNA transcript was detected in osteoblasts from Fgf2–/– mice (lanes 2, 4, 6, and 8).
Effect of disruption of the Fgf2 gene on bone cell replication.
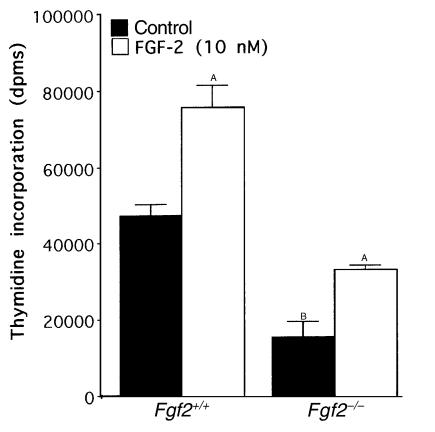
We measured thymidine incorporation into DNA in calvarial osteoblasts from 8-week-old Fgf2+/+ and Fgf2–/– mice. Thymidine incorporation into DNA was significantly reduced by 69% in calvarial osteoblast cultures from Fgf2–/– mice (Figure 2). We compared the ability of 24-hour treatment with exogenous FGF-2 to increase cell replication in these cultures. The addition of FGF-2 (10 nM) increased cell replication in osteoblasts from both genotypes.
Figure 2.
Comparison of thymidine incorporation into DNA in calvarial osteoblasts from 8-week-old Fgf2+/+ and Fgf2–/– mice. Osteoblastic cells were prepared from calvariae of 8-week-old Fgf2+/+ and Fgf2–/– mice and plated in 100-mm dishes in DMEM with 10% heat inactivated FCS for 12 days. Cells were harvested and replated at a density of 5,000 cells/cm2 for 7 days. Media were changed every 3 days. Cultures were treated with fresh media in the absence or presence of FGF-2 (10 nM) for the last 24 hours of the culture period. For labeling studies, [3H]thymidine (10 μCi/well) was added for the last 4 hours of the culture to measure thymidine incorporation into DNA. Values are the mean ± SEM for 6 determinations per group. ASignificantly different from control cultures; P < 0.05. BSignificantly different from Fgf2+/+; P < 0.05.
Alkaline phosphatase–positive colonies and mineralized nodules in bone marrow cultures of Fgf2+/+ and Fgf2–/– mice.
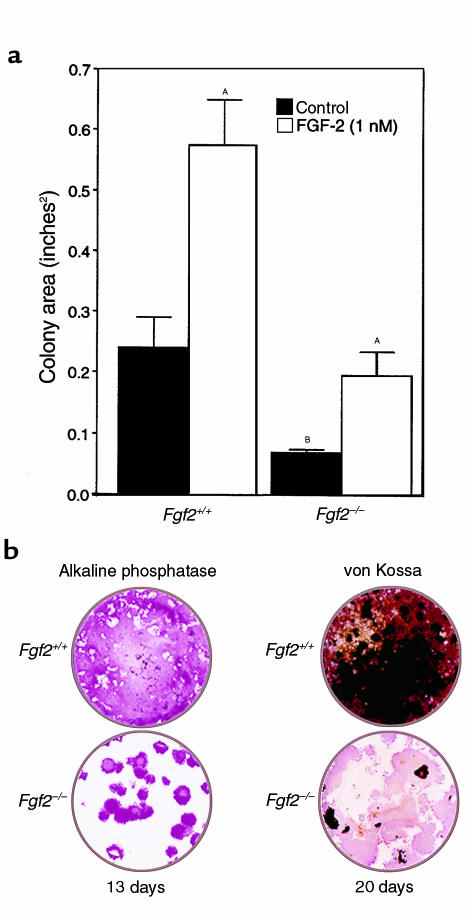
We assessed whether disruption of the Fgf2 gene would alter the formation of alkaline phosphatase–positive (ALP) colonies and mineralized nodules in bone marrow cultures from Fgf2–/– mice. Bone marrow cells were plated at a low density 1 × 10⁶ cells per well in the absence and presence of FGF-2 (10 nM), which was added for the first 3 days of the 14-day culture period. The number of ALP colonies were counted and colony area was measured using NIH Image (version 1.61). Comparison of vehicle-treated bone marrow cultures from both genotypes showed fewer ALP colonies (29 + 4 vs. 16 + 0.8; P < 0.05) and decreased colony area (0.24 + 0.05 vs. 0.07 + 0.01; P < 0.05) in bone marrow cultures from Fgf2–/– mice. The effect of FGF-2 treatment on colony area is shown in Figure 3a. There was a significant increase in colony area in response to FGF-2 treatment. However, colony area remained reduced in the bone marrow cultures of Fgf2–/– mice compared with the response to FGF-2 treatment in bone marrow cultures from Fgf2+/+ mice. In some experiments, bone marrow cells were plated at 206 cells per well and cultured for 13 or 21 days, stained for ALP, and then restained for mineral by the von Kossa method (Figure 3b). In these cultures, we were unable to count discrete ALP colonies in cultures from Fgf2+/+ because of the diffuse staining; however, even at such high initial plating densities, discrete colonies were seen in bone marrow cultures of the Fgf2–/– mice. There were fewer ALP colonies after 13 days and minimal staining for mineral after 20 days in the bone marrow cultures of Fgf2–/– mice compared with Fgf2+/+ cultures (Figure 3b).
Figure 3.
(a) Effect of FGF-2 on colony area in mouse bone marrow cultures from Fgf2+/+ and Fgf2–/– mice. Cells were plated at a density of 1 million cells per well in αMEM containing penicillin/streptomycin and 10% heat inactivated FCS in the absence or presence of FGF-2 (10 nM). On day 3, media were changed and cells were cultured in differentiation media (αMEM, 10 nM dexamethasone, 10% FCS, 8 mM β-glycerophosphate, 50 μg/mL ascorbic acid) for an additional 11 days. ASignificantly different from control cultures; P < 0.05. BSignificantly different from Fgf2+/+; P < 0.05. (b) Comparison of the ability to form ALP colonies and mineralized nodules as determined by von Kossa staining in mouse bone marrow cultures from Fgf2+/+ and Fgf2–/– mice. Cells were plated at a density of 20 million cells per well in αMEM containing penicillin/streptomycin and 10% heat inactivated FCS. On day 3, media were changed and cells were cultured in differentiation media (αMEM, 10 nM dexamethasone, 10% FCS, 8 mM β-glycerophosphate, 50 μg/mL ascorbic acid) for the indicated times.
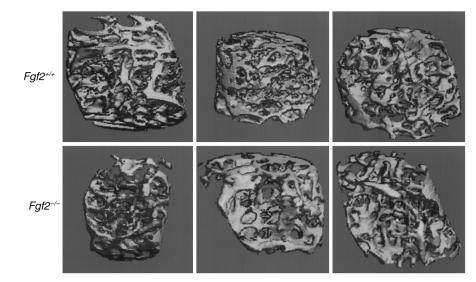
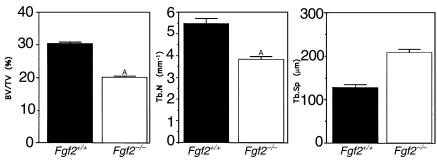
Micro-CT analysis of trabecular bone of the distal metaphysis of the femur of 4.5-month adult Fgf2+/+ and Fgf2–/– mice. We examined bone microarchitecture in adult mice of both genotypes by micro-CT (63). Three-dimensional images of the femoral metaphysis of 4.5-month-old male Fgf2+/+ and Fgf2–/– mice are shown in (Figure 4). The platelike structure of the trabecular bone was markedly reduced, and the connecting rods of trabeculae were disrupted in Fgf2–/– mice compared with Fgf2+/+ mice (Figure 4). Using 2-dimensional images, total area, bone area, and bone perimeter were determined from which the BV/TV, Tb.Th, Tb.N, and Tb.Sp were calculated. Figure 5 shows that the calculated 3-dimensional parameters. BV/TV and Tb.N were significantly decreased by 34% and 31%, respectively, and Tb.Sp was significantly increased by 63% in Fgf2–/– mice compared with Fgf2+/+ mice. Tb.Th was not different between the 2 genotypes at this age (data not shown).
Figure 4.
Morphological study by micro-CT scanning of trabecular bone of the femurs of 4.5-month-old Fgf2+/+ and Fgf2–/– mice. Three-dimensional trabecular bone architecture of distal femoral metaphysis of 4.5-month-old male Fgf2+/+ and Fgf2–/– mice were analyzed by micro-CT. Note that the platelike architecture of the trabecular bone is markedly reduced and the connecting rods of trabeculae are disrupted in Fgf2–/– mice compared with Fgf2+/+.
Figure 5.
Three-dimensional microstructural parameters calculated using 2-dimensional data obtained from micro-CT of femoral bones from 4.5-month-old Fgf2+/+ and Fgf2–/– mice. Calculated morphometric indices included bone volume density (bone volume [BV]/trabecular volume [TV]), trabecular number [Tb.N = (BV/TV)/Tb.Th], and trabecular separation [Tb.Sp = (1/Tb.N)–Tb.Th]. ASignificantly different from Fgf2+/+ group; P < 0.05, Tukey-Kramer multiple comparison test (ANOVA).
Static and dynamic histomorphometric analysis of tibiae of 4.5-month Fgf2+/+ and Fgf2–/– mice.
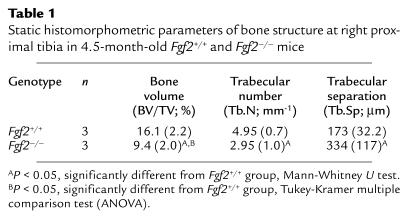
Static histomorphometric analysis of the right proximal tibiae of 4.5-month-old mice confirmed the micro-CT findings. Structural parameters of bone volume and trabecular number were significantly reduced and trabecular separation was significantly increased in Fgf2–/– mice compared with Fgf2+/+ mice (Table 1). As with micro-CT, trabecular thickness was unchanged (data not shown). Parameters of bone resorption were determined using the left proximal tibiae. Osteoclast surface and osteoclast number were reduced in Fgf2–/– bones, but the differences did not achieve statistical significance.
Table 1.
Static histomorphometric parameters of bone structure at right proximal tibia in 4.5-month-old Fgf2+/+ and Fgf2–/– mice
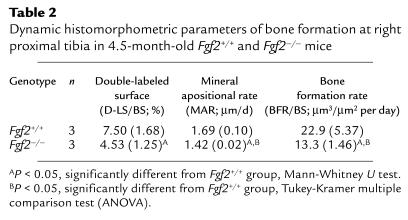
To determine whether the decrease in bone mass was due to a decrease in bone formation dynamic, histomorphometric parameters of bone formation were determined. Quantification of bone formation in the right proximal tibiae is shown in Table 2. Double-labeled surface, mineral apposition rate, and bone formation rate were all significantly reduced in Fgf2–/– mice. These data are consistent with low turnover state in Fgf2–/– bones compared with Fgf2+/+ bones and suggest that there is a marked defect in osteoblast proliferation and differentiation in Fgf2–/– mice.
Table 2.
Dynamic histomorphometric parameters of bone formation at right proximal tibia in 4.5-month-old Fgf2+/+ and Fgf2–/– mice
Histomorphometry of the distal femurs of 8-month-old Fgf2+/+ and Fgf2–/– mice.
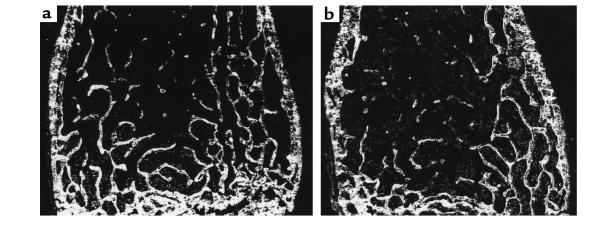
We also examined undecalcified sections of the distal femurs of 8-month-old male Fgf2+/+ (Figure 6a) and Fgf2–/– (Figure 6b) mice by dark-field illumination (60). The BV/TV and Tb.N in Fgf2–/– mice were reduced in the secondary spongiosa compared with Fgf2+/+ mice. The trabecular separation was also increased in Fgf2–/– mice.
Figure 6.
Undecalcified sections of the distal femur of (a) an 8-month-old Fgf2+/+ mouse and (b) a Fgf–/– mouse (dark-field illumination). Trabecular number is decreased in the secondary spongiosa of the Fgf2–/– mouse.
Micro-CT analysis of trabecular bone of the distal metaphysis of the femurs of 8-month-old Fgf2+/+ and Fgf2–/– mice.
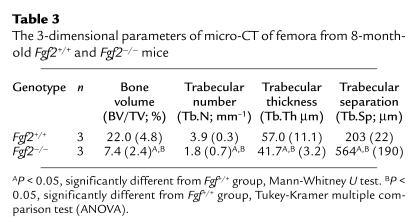
We examined bone microarchitecture in 8-month-old mice of both genotypes by micro-CT. Table 3 shows that the calculated 3-dimensional parameters of BV/TV and Tb.N were significantly decreased by 67% and 54%, respectively, and Tb.Sp was significantly increased by 249% in bones from the Fgf2–/– mice compared with Fgf2+/+ mice. In contrast to our observation in the 4.5-month-old mice, Tb.Th was decreased by 27% in bones from these older Fgf2–/– mice.
Table 3.
The 3-dimensional parameters of micro-CT of femora from 8-month-old Fgf2+/+ and Fgf2–/– mice
Static histomorphometric analysis of tibiae of 8-month-old Fgf2+/+ and Fgf2–/– mice.
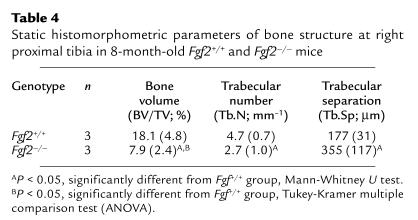
We performed static histomorphometric analysis of the right proximal tibiae of 8-month-old mice. As shown in Table 4, structural parameters of bone volume and trabecular number were significantly reduced and trabecular separation was significantly increased in Fgf2–/– mice compared with Fgf2+/+ mice. These data confirm the micro-CT results obtained from the distal femora of 8-month-old Fgf2–/– mice as shown in Table 3. Parameters of bone resorption were determined in the left proximal tibia. In these older mice, osteoclast surface was reduced by 48% in Fgf2–/–, but osteoclast number was not significantly decreased.
Table 4.
Static histomorphometric parameters of bone structure at right proximal tibia in 8-month-old Fgf2+/+ and Fgf2–/– mice
Discussion
We hypothesized that disruption of the Fgf2 gene, might result in decreased bone formation, as FGF-2 is a potent mitogen for osteoblasts and osteoblast precursors (20, 2) as well as a stimulator of bone formation (2, 25–30). Furthermore, FGF-2 is differentially expressed in the growth plate of long bones during the process of endochondral bone formation (64). Cross-sectional immunohistochemical studies of 18 day rat fetuses showed that FGF-2 staining was present in chondrocytes in the early stages of differentiation (64). The centers of ossification, calcified matrix, and osteoblasts also contained intense staining for FGF-2 (64). Other studies examined Fgf2 mRNA and protein by in situ hybridization and immunohistochemistry, respectively, and showed expression in resting and proliferative chondrocytes of the epiphyseal growth plate of human fetus (65). In earlier studies, bone marrow stromal cells were shown to synthesize and release FGF-2 (31) and to proliferate in response to FGF-2. These studies suggested a possible role for Fgf2 in endochondral bone formation.
In this report, we show that proliferation was decreased in calvarial osteoblastic cells derived from 8-week-old Fgf2–/– mice. As shown in Figure 2, at the end of 7 days of culture, thymidine labeling was significantly reduced in the Fgf2–/– calvarial osteoblast cultures compared with Fgf2+/+ calvarial osteoblast cultures. Thus, endogenous FGF-2 appears to be important in maintaining the basal rate of osteoblast replication. The addition of exogenous FGF-2 to the calvarial osteoblast cultures of both genotypes induced a mitogenic response. However, administration of recombinant FGF-2 (the 18-kDa isoform) did not completely restore the proliferative response in calvarial osteoblast cultures from the Fgf2–/– mice.
We also found that bone marrow stromal cells from Fgf2–/– mice formed fewer ALP mineralized colonies (Figure 3b). These results could be due to a decrease in osteoblast precursor number, secondary to decreased replication. We conducted experiments to determine whether short-term addition of exogenous FGF-2 to bone marrow cultures from Fgf2+/+ and Fgf2–/– mice would increase the number of ALP colonies and colony area. The ALP colony formation defect in bone marrow cultures of the Fgf2–/– mice was only partially restored by recombinant 18-kDa FGF-2 treatment (Figure 3a). These results are interesting, as several studies suggest that specific isoforms of FGF-2 may differentially modulate cell phenotype (66, 67).
In mouse bones, there are 3 isoforms of FGF-2 protein with molecular weights (MWs) of 18, 21, and 22 kDa. We confirmed in our previous report that deletion of the FGF-2 gene abrogated all isoforms of FGF-2 protein (51). Studies have shown that cells expressing only the low molecular wt (LMW; 18 kDa) FGF-2 isoform were more migratory than cells expressing only the higher molecular wt (HMW) forms (66, 67). Previous studies have demonstrated that the 18-kDa FGF-2 is primarily localized to the cytoplasm, whereas the HMW proteins are localized to the nucleus and may be important in mediating the mitogenic response (66). In an earlier study, we examined the growth of smooth muscle cells from transgenic mice overexpressing LMW, HMW, or all MW isoforms of FGF-2 (67). We demonstrated that serum-stimulated growth was highest in cultured smooth cells expressing the HMW hFGF-2 isoforms, intermediate in cells with the non-nuclear LMW isoform, and lowest in wild-type cells. Furthermore, neutralizing anti–FGF-2 antibody markedly decreased serum stimulated DNA synthesis, but only in the cell lines overexpressing the exported/non-nuclear LMW isoform (67). These studies suggest an important role for the nuclear forms of FGF-2 in the mitogenic response to this growth factor. Therefore, it is possibly that in the absence of the HMW isoforms, treatment with LMW FGF-2 cannot completely rescue the proliferation defect that we observed in the calvarial osteoblast cultures or the ALP colony formation defect in bone marrow stromal cell cultures from Fgf2–/– mice. Currently, the HMW proteins are not available to determine whether addition of these proteins would fully restore these responses.
Bone marrow stroma is a complex tissue that contains pluripotent cells capable of differentiating into a variety of mesenchymal cell types (68, 69) including osteoblasts, which can differentiate and express alkaline phosphatase, type I collagen, and osteocalcin and produce a mineralizable matrix (69–71). Rat bone marrow stromal culture models have been used to demonstrate in vivo, the stimulatory effect of FGF-2 on bone formation (72–74). In vitro studies, using human bone marrow stromal cells, have shown that FGF-2 modulates the growth and expression of the osteogenic phenotype of human bone marrow–derived bonelike cells (75–78). As shown in a representative experiment in Figure 3b, there were fewer ALP, mineralized colonies formed in the bone marrow cultures from the Fgf2–/– mice. It is possible that in the absence of FGF-2, a factor(s) that promotes osteoblast differentiation is reduced or absent. Studies have shown that FGF-2 can synergize with platelet-derived growth factor to maintain the osteogenic potential of rat marrow–derived mesenchymal cells (79). In addition, the combination of FGF-2 and bone morphogenic protein-2 was more potent than either factor alone in inducing new bone formation in rats (80).
Osteoblasts and adipocytes develop from multipotent mesenchymal stem cells of the bone marrow (81), and previous studies have shown that defective osteoblastogenesis and osteopenia in mice can be associated with increased adipogenesis and myelopoeisis (82). Because FGF-2 promotes development of other bone marrow lineage by affecting stromal cells and early committed hematopoetic progenitors (83), we examined the effect of disruption of the Fgf2 gene on hematopoetic bone marrow lineage in our previous publication (51). Methylcellulose culture of bone marrow cells revealed a decrease in hematopoetic colony formation in the Fgf2–/– mice, and increased number of megakaryocytes. Studies to examine adipogenesis in bone marrow cultures of the Fgf2–/– mice are planned.
The micro-CT data (Figures 4 and 5) and the static and dynamic histomorphometric studies in the 4.5-month-old Fgf2–/– mice (Tables 1 and 2) demonstrated a marked decrease in bone mass and a decreased rate of new bone formation that were quite consistent with each other. Increased trabecular separation was also found in the femora of 4.5-month-old Fgf2–/– mice. Dark-field examination of undecalcified distal femoral bones of older, 8-month-old Fgf2+/+ (Figure 6a) and Fgf2–/– (Figure 6b) mice show fewer trabeculae and loss of connectivity in the bones of Fgf2–/– mice compared with Fgf2+/+ mice. The micro-CT data (Table 3) and the static histomorphometric data (Table 4) from these 8-month-old mice demonstrate a more marked increase in trabecular separation, a further reduction in BV/TV and Tb.N and a decrease in Tb.Th. These data confirm the results observed in the 4.5-month-old Fgf2–/– mice and further suggest that these changes are progressive as these mice age.
A decrease in the amount of bone and the number of trabeculae in the primary spongiosa could occur in Fgf2–/– bones if cartilage maturation was delayed that resulted in low peak bone mass. However, the growth plates of these mice showed no gross abnormality (51). We cannot rule out from the present studies the possibility that trabecular bone resorption was increased in Fgf2–/– mice in the very early stage of trabecular bone development and declined rapidly as the animal grew. However, an alternate explanation for these results is that because bone mass and structure are determined by the balance of bone formed and resorbed during turnover, there could be a negative balance if the bone resorption rate is not altered but is still greater than the rate of bone formation.
Dynamic histomorphometry (Table 2) confirms that there is a significant decrease in DLS/BS, BFR/BS, and MAR in the bones of 4.5-month-old Fgf2–/– mice. These results are further supported by the in vitro bone formation data (Figure 3, a and b) that demonstrate a marked decrease in ALP colonies, colony area, and mineralized nodule formation in bone marrow stromal cultures from Fgf2–/– mice compared with Fgf2+/+. The decreased MAR is paradoxical, as several studies have shown that chronic FGF-2 treatment of osteoblastic cultures inhibited collagen synthesis, alkaline phosphatase activity, and osteocalcin synthesis (2). However, FGF-2 stimulates the proliferation of osteoblasts, and a number of in vitro and in vivo studies have shown that intermittent treatment with FGF-2 increases new bone formation (2, 25–30). This increase in new bone formation is only observed on the endosteal and trabecular bone surfaces. There is also increased newly formed cancellous bone filling the marrow spaces, suggesting that the target cells for this effect of FGF-2 are the osteoblast precursors present in the bone marrow. Thus, FGF-2 appears to inhibit the function of differentiated osteoblasts, whereas its anabolic action is probably due to an increase in the number of preosteoblasts that can then differentiate into mature osteoblasts capable of inducing new bone formation. Therefore, in the Fgf2–/– mice, with fewer osteoblast precursors, the mature osteoblast population would also be reduced and hence MAR may be decreased by this mechanism.
In summary, our studies show that disruption of the Fgf2 gene in mice results in decreased osteoblast replication, decreased mineralized nodule formation in bone marrow cultures, and decreased new bone formation in vivo. These data are the first to demonstrate an important role for endogenous FGF-2 in maintaining bone mass, as well as bone formation. We believe that the observations in the bones of the 4.5-month-old Fgf2–/– mice are significant and are more marked in the older 8-month-old animals. These data further suggest that redundancy of members of the FGF family cannot compensate to prevent bone loss when the Fgf2 gene is disrupted in mice.
Acknowledgments
The authors wish to thank Lawrence Raisz (University of Conneticut School of Medicine, Farmington, Connecticut) for helpful discussion. This work was supported in part by NIH grants AR-46025 (to M.M. Hurley) and HL-53631 (to J.D. Coffin). The authors would also like to thank Jan Figueroa for clerical assistance.
References
- 1.Gospodarowicz D. Basic science and pathology fibroblast growth factor chemical structure and biologic function. Clin Orthop Rel Res. 1990;257:231–248. [PubMed] [Google Scholar]
- 2.Hurley, M.M., and Florkiewicz, R. 1996. Fibroblast growth factor and vascular endothelial fibroblast growth factor families. In Principles of bone biology. Bilezikian, J.P., Raisz, L.G., and Rodan, G.A., editors. Academic Press. San Diego, CA. 627–645.
- 3.Hauschka PV, Mavrakos AE, Iafrati MD, Doleman SE, Klagsbrun M. Growth factors in bone matrix. J Biol Chem. 1986;261:12665–12674. [PubMed] [Google Scholar]
- 4.Shing Y, et al. Heparin affinity: duplication of a tumour derived capillary endothelial cell growth factor. Science. 1984;223:1926–1928. doi: 10.1126/science.6199844. [DOI] [PubMed] [Google Scholar]
- 5.Hurley MM, Kessler M, Gronowicz G, Raisz LG. The interaction of heparin and basic fibroblast growth factor on collagen synthesis in 21-day fetal rat calvariae. Endocrinology. 1992;130:2675–2681. doi: 10.1210/endo.130.5.1374012. [DOI] [PubMed] [Google Scholar]
- 6.Saksela O, Rifkin D. Release of basic fibroblast growth factor-heparan sulfate complexes from endothelial cells by plasminogen activator-mediated proteolytic activity. J Cell Biol. 1990;110:767–775. doi: 10.1083/jcb.110.3.767. [DOI] [PMC free article] [PubMed] [Google Scholar]
- 7.Globus RK, Plouet J, Gospodarowicz D. Cultured bovine bone cells synthesize basic fibroblast growth factor and store it in their extracellular matrix. Endocrinology. 1989;124:1539–1547. doi: 10.1210/endo-124-3-1539. [DOI] [PubMed] [Google Scholar]
- 8.Hurley MM, et al. Transcriptional regulation of the collagenase gene by basic fibroblast growth factor in osteoblastic MC3T3-E1 cells. Biochem Biophys Res Commun. 1995;214:331–339. doi: 10.1006/bbrc.1995.2292. [DOI] [PubMed] [Google Scholar]
- 9.Okazaki R, et al. Transcriptional activation of the c-fos and c-jun proto-oncogenes by serum growth factors in osteoblast-like MC3T3-E1 cells. J Bone Miner Res. 1992;7:1149–1155. doi: 10.1002/jbmr.5650071006. [DOI] [PubMed] [Google Scholar]
- 10.Hurley MM, Marcello K, Abreu C, Kessler M. Signal transduction by basic fibroblast growth factor in rat osteoblastic Py1a cells. J Bone Miner Res. 1996;11:1256–1263. doi: 10.1002/jbmr.5650110910. [DOI] [PubMed] [Google Scholar]
- 11.Coffin JD, et al. Abnormal bone growth and selective translational regulation in basic fibroblast growth factor (FGF-2) transgenic mice. Mol Biol Cell. 1995;6:1861–1873. doi: 10.1091/mbc.6.12.1861. [DOI] [PMC free article] [PubMed] [Google Scholar]
- 12.Partanen J, et al. FGFR4, a novel acidic fibroblast growth factor receptor with a distinct expression pattern. EMBO J. 1991;10:1347–1354. doi: 10.1002/j.1460-2075.1991.tb07654.x. [DOI] [PMC free article] [PubMed] [Google Scholar]
- 13.Orr-Urtreger A, Givol D, Yayon A, Yarden Y, Lonai P. Developmental expression of two murine fibroblast growth factor receptors, FLG and BEK. Development. 1991;113:1419–1439. doi: 10.1242/dev.113.4.1419. [DOI] [PubMed] [Google Scholar]
- 14.Russeau F, et al. Mutations in the gene encoding fibroblast growth receptor 3 in achondroplasia. Nature. 1994;371:252–254. doi: 10.1038/371252a0. [DOI] [PubMed] [Google Scholar]
- 15.Shiang R, et al. Mutations in the transmembrane domain of FGFR3 cause the most common genetic form of dwarfism, achondroplasia. Cell. 1994;78:335–342. doi: 10.1016/0092-8674(94)90302-6. [DOI] [PubMed] [Google Scholar]
- 16.Deng C, Wynshaw-Boris A, Zhou F, Kuo A, Leder P. Fibroblast growth factor receptor 3 is a negative regulator of bone growth. Cell. 1996;84:911–921. doi: 10.1016/s0092-8674(00)81069-7. [DOI] [PubMed] [Google Scholar]
- 17.Colvin JS, Bohne BA, Harding GW, McEwen DG, Ornitz DM. Skeletal overgrowth and deafness in mice lacking fibroblast growth factor receptor 3. Nat Genet. 1996;12:390–397. doi: 10.1038/ng0496-390. [DOI] [PubMed] [Google Scholar]
- 18.Lomri A, et al. Increased calvaria cell differentiation and bone matrix formation induced by fibroblast growth receptor 2 mutations in Apert syndrome. J Clin Invest. 1998;101:1310–1317. [PMC free article] [PubMed] [Google Scholar]
- 19.Xu X, Weinstein M, Li C, Deng CX. Fibroblast growth factor receptors (FGFRs) and their role in limb development. Cell Tissue Res. 1999;296:33–43. doi: 10.1007/s004410051264. [DOI] [PubMed] [Google Scholar]
- 20.Globus RK, Patterson-Buckendahl P, Gospodarowicz D. Regulation of bovine bone cell proliferation by fibroblast growth factor and transforming growth factor β. Endocrinology. 1988;123:98–105. doi: 10.1210/endo-123-1-98. [DOI] [PubMed] [Google Scholar]
- 21.Rodan SB, Wesolowski G, Yoon K, Rodan GA. Opposing effects of fibroblast growth factor and pertussis toxin on alkaline phosphatase, osteopontin, osteocalcin and type I collagen mRNA levels in ROS 17/2.8 Cells. J Biol Chem. 1989;264:19934–19941. [PubMed] [Google Scholar]
- 22.McCarthy TL, Centrella M, Canalis E. Effects of fibroblast growth factors on deoxyribonucleic acid and collagen synthesis in rat parietal bone cells. Endocrinology. 1989;125:2118–2126. doi: 10.1210/endo-125-4-2118. [DOI] [PubMed] [Google Scholar]
- 23.Canalis E, Centrella M, McCarthy T. Effects of basic fibroblast growth factor on bone formation in vitro. J Clin Invest. 1988;81:1572–1577. doi: 10.1172/JCI113490. [DOI] [PMC free article] [PubMed] [Google Scholar]
- 24.Hurley MM, et al. Basic fibroblast growth factor inhibits type I collagen gene expression in osteoblastic MC3T3-E1 cells. J Biol Chem. 1993;268:5588–5593. [PubMed] [Google Scholar]
- 25.Mayahara H, et al. In vivo stimulation of endosteal bone formation by basic fibroblast growth factor in rats. Growth Factors. 1993;9:73–80. doi: 10.3109/08977199308991583. [DOI] [PubMed] [Google Scholar]
- 26.Nakamura T, et al. Stimulation of endosteal bone formation by systemic injections of recombinant basic fibroblast growth factor in rats. Endocrinology. 1995;136:1276–1284. doi: 10.1210/endo.136.3.7867582. [DOI] [PubMed] [Google Scholar]
- 27.Nagai H, Tsukuda R, Mayahara H. Effects of basic fibroblast growth factor (bFGF) on bone formation in growing rats. Bone. 1995;16:367–373. doi: 10.1016/8756-3282(94)00049-2. [DOI] [PubMed] [Google Scholar]
- 28.Nakamura K, et al. Stimulation of bone formation by intraosseous injection of basic fibroblast growth factor in ovariectomized rats. Int Orthop. 1998;22:49–54. doi: 10.1007/s002640050207. [DOI] [PMC free article] [PubMed] [Google Scholar]
- 29.Dunstan CR, et al. Systemic administration of acidic fibroblast growth factor (FGF-1) prevents bone loss and increases new bone formation in ovariectomized rats. J Bone Miner Res. 1999;14:953–959. doi: 10.1359/jbmr.1999.14.6.953. [DOI] [PubMed] [Google Scholar]
- 30.Liang H, Pun S, Wronski TJ. Bone anabolic effects of basic fibroblast growth factor in ovariectomized rats. Endocrinology. 1999;140:5780–5788. doi: 10.1210/endo.140.12.7195. [DOI] [PubMed] [Google Scholar]
- 31.Brunner G, Gabrilove J, Rifkin DB, Wilson EL. Phospholipase C release of basic fibroblast growth factor from human bone marrow cultures as a biologically active complex with a phosphatidylinositol anchored heparan sulfate proteoglycan. J Cell Biol. 1991;114:1275–1283. doi: 10.1083/jcb.114.6.1275. [DOI] [PMC free article] [PubMed] [Google Scholar]
- 32.Oliver LJ, Rifkin DB, Gabrilove J, Hannocks MJ, Wilson EL. Long-term culture of human bone marrow stromal cells in the presence of basic fibroblast growth factor. Growth Factors. 1990;3:231–236. doi: 10.3109/08977199009043907. [DOI] [PubMed] [Google Scholar]
- 33.Thomson BM, et al. Preliminary characterization of porcine bone marrow stromal cells: skeletogenic potential, colony-forming activity, and response to dexamethasone, transforming growth factor β, and basic fibroblast factor. J Bone Miner Res. 1993;10:1173–1183. doi: 10.1002/jbmr.5650081004. [DOI] [PubMed] [Google Scholar]
- 34.Locklin RM, Williamson MC, Beresford JN, Triffitt JT, Owen ME. In vitro effects of growth factors and dexamethasone on rat marrow stromal cells. Clin Orthop Rel Res. 1995;313:27–35. [PubMed] [Google Scholar]
- 35.Long MW, Robinson JA, Ashcraft EA, Mann KG. Regulation of human bone marrow-derived osteoprogenitor cells by osteogenic growth factors. J Clin Invest. 1995;95:881–887. doi: 10.1172/JCI117738. [DOI] [PMC free article] [PubMed] [Google Scholar]
- 36.Kawaguchi H, et al. Stimulation of fracture repair by recombinant human basic fibroblast growth factor in normal and streptozotocin-diabetic rats. Endocrinology. 1994;135:774–781. doi: 10.1210/endo.135.2.8033826. [DOI] [PubMed] [Google Scholar]
- 37.Wildburger R, et al. Basic fibroblast growth factor (bFGF) immunoreactivity as a possible link between head injury and impaired bone fracture healing. J Bone Miner Res. 1994;27:183–193. doi: 10.1016/s0169-6009(08)80192-4. [DOI] [PubMed] [Google Scholar]
- 38.Scully SP, Joyce ME, Abidi N, Bolander ME. The use of polymerase chain reaction generated nucleotide sequences as probes for hybridization. Mol Cell Probes. 1990;4:485–495. doi: 10.1016/0890-8508(90)90007-m. [DOI] [PubMed] [Google Scholar]
- 39.Hurley MM, Lee SK, Raisz LG, Bernicker P, Lorenzo JA. Basic fibroblast growth factor induces osteoclast formation in murine bone marrow cultures. Bone. 1998;22:309–316. doi: 10.1016/s8756-3282(97)00292-5. [DOI] [PubMed] [Google Scholar]
- 40.Kawaguchi H, et al. Transcription induction of prostaglandin G/H synthase-2 by basic fibroblast growth factor. J Clin Invest. 1995;96:923–930. doi: 10.1172/JCI118140. [DOI] [PMC free article] [PubMed] [Google Scholar]
- 41.Hurley MM, Abreu C, Gronowicz G, Kawaguchi H, Lorenzo J. Expression and regulation of basic fibroblast growth factor mRNA levels in mouse osteoblastic MC3T3-E1 cells. J Biol Chem. 1994;269:9392–9396. [PubMed] [Google Scholar]
- 42.Sabbieti MG, et al. Prostaglandins regulate the expression of fibroblast growth factor-2 in bone. Endocrinology. 1999;140:434–444. doi: 10.1210/endo.140.1.6442. [DOI] [PubMed] [Google Scholar]
- 43.Hurley MM, et al. Parathyroid hormone regulates the expression of fibroblast growth factor-2 mRNA and fibroblast growth factor receptor mRNA in osteoblastic cells. J Bone Miner Res. 1999;14:776–783. doi: 10.1359/jbmr.1999.14.5.776. [DOI] [PubMed] [Google Scholar]
- 44.Cohen MM. Transforming growth factor Bs and fibroblast growth factors and their receptors: role in sutural biology and craniosynostosis. J Bone Miner Res. 1997;12:322–331. doi: 10.1359/jbmr.1997.12.3.322. [DOI] [PubMed] [Google Scholar]
- 45.Ornitz DM, et al. Receptor specificity of the fibroblast growth factor family. J Biol Chem. 1996;271:15292–15297. doi: 10.1074/jbc.271.25.15292. [DOI] [PubMed] [Google Scholar]
- 46.Buckland RA, Collinson JM, Graham E, Davison DR, Hill RE. Antagonistic effects of FGF-4 on BMP induction of apoptosis and chondrogenesis in the chick limb bud. Mech Dev. 1998;71:143–150. doi: 10.1016/s0925-4773(98)00008-2. [DOI] [PubMed] [Google Scholar]
- 47.Kim HJ, Rice DP, Kettunen PJ, Thesleff I. FGF-, BMP- and Shh-mediated signaling pathways in the regulation of cranial suture morphogenesis and calvarial bone development. Development. 1998;125:1241–1251. doi: 10.1242/dev.125.7.1241. [DOI] [PubMed] [Google Scholar]
- 48.Xu J, Lawshe A, MacArthur CA, Ornitz DM. Genomic structure, mapping, activity and expression of fibroblast growth factor 17. Mech Dev. 1999;83:165–178. doi: 10.1016/s0925-4773(99)00034-9. [DOI] [PubMed] [Google Scholar]
- 49.Sekine K, et al. FGF-10 is essential for limb and lung formation. Nat Genet. 1999;21:138–141. doi: 10.1038/5096. [DOI] [PubMed] [Google Scholar]
- 50.Hartung H, et al. Murine FGF-12 and FGF-13: expression in embryonic nervous system, connective tissue and heart. Mech Dev. 1997;64:31–39. doi: 10.1016/s0925-4773(97)00042-7. [DOI] [PubMed] [Google Scholar]
- 51.Zhou M, et al. Fibroblast growth factor 2 control of vascular tone. Nat Med. 1998;4:201–207. doi: 10.1038/nm0298-201. [DOI] [PMC free article] [PubMed] [Google Scholar]
- 52.Hattersley G, Chambers TJ. Effects of interleukin 3 and of granulocyte-macrophage and macrophage colony stimulating factors on osteoclast differentiation from mouse hematopoietic tissue. J Cell Physiol. 1990;142:201–209. doi: 10.1002/jcp.1041420125. [DOI] [PubMed] [Google Scholar]
- 53.Ortega S, Ittmann M, Tsang SH, Erlich M, Bailico C. Neuronal defects and delayed wound healing in mice lacking fibroblast growth factor 2. Proc Natl Acad Sci USA. 1998;97:5672–5677. doi: 10.1073/pnas.95.10.5672. [DOI] [PMC free article] [PubMed] [Google Scholar]
- 54.Dono R, Texido G, Dussel R, Ehmke H, Zeller R. Impaired cerebral cortex development and blood pressure regulation in FGF-2-deficient mice. EMBO J. 1998;17:4213–4225. doi: 10.1093/emboj/17.15.4213. [DOI] [PMC free article] [PubMed] [Google Scholar]
- 55.Scutt A, Bertram P. Bone marrow cells are targets for the anabolic actions of prostaglandin E2 on bone: Induction of a transition from nonadherent to adherent osteoblast precursors. J Bone Miner Res. 1995;10:474–487. doi: 10.1002/jbmr.5650100320. [DOI] [PubMed] [Google Scholar]
- 56.Chomczynski P, Sacchi N. Single-step method of RNA isolation by acid guanidinium thiocyanate-phenol-chloroform extraction. Anal Biochem. 1987;162:156–159. doi: 10.1006/abio.1987.9999. [DOI] [PubMed] [Google Scholar]
- 57.Towbin H, Staehelin T, Gordon J. Electrophoretic transfer of proteins from polyacrylamide gels to nitrocellulose sheets: Procedure and some applications. Proc Natl Acad Sci USA. 1979;76:4350–4354. doi: 10.1073/pnas.76.9.4350. [DOI] [PMC free article] [PubMed] [Google Scholar]
- 58.Hebert JM, Basilico C, Goldfarb M, Haub O, Martin GR. Isolation of cDNAs encoding four mouse FGF family members and characterization of their expression patterns during embryogenesis. Dev Biol. 1990;138:454–463. doi: 10.1016/0012-1606(90)90211-z. [DOI] [PubMed] [Google Scholar]
- 59.Narusawa K, et al. The effect of recombinant human insulin-like growth factor (rhIGF)-1 and rhIGF-1/IGF binding protein-3 administration on rat osteopenia induced by ovariectomy with concomitant bilateral sciatic neurectomy. J Bone Miner Res. 1995;10:1853–1864. doi: 10.1002/jbmr.5650101204. [DOI] [PubMed] [Google Scholar]
- 60.Murakami H, Nakamura T, Tsurukami H, Abe M, Barbier A, Suzuki K. Effects of tiludronate on bone mass, structure, and turnover at the epiphyseal, primary, and secondary spongiosa in the proximal tibia of growing rats after sciatic neurectomy. J Bone Miner Res. 1994;9:1355–1364. doi: 10.1002/jbmr.5650090906. [DOI] [PubMed] [Google Scholar]
- 61.Parfitt AM, et al. Relationships between surface, volume, and thickness of iliac trabecular bone in aging and osteoporosis. Implications for the microanatomic and cellular mechanisms of bone loss. J Clin Invest. 1983;72:1396–1409. doi: 10.1172/JCI111096. [DOI] [PMC free article] [PubMed] [Google Scholar]
- 62.Goulet RW, et al. The relationship between the structural and orthogonal compressive properties of trabecular bone. J Biomech. 1994;27:375–389. doi: 10.1016/0021-9290(94)90014-0. [DOI] [PubMed] [Google Scholar]
- 63.Ruegsegger P, Muller R. A microtomographic system for the nondestructive evaluation of bone architecture. Calcif Tissue Int. 1996;58:61–75. doi: 10.1007/BF02509542. [DOI] [PubMed] [Google Scholar]
- 64.Gonzalez A-M, Buscaglia M, Ong M, Baird A. Distribution of basic fibroblast growth factor in the 18-day rat fetus: localization in the basement membranes of diverse tissues. J Cell Biol. 1990;110:753–765. doi: 10.1083/jcb.110.3.753. [DOI] [PMC free article] [PubMed] [Google Scholar]
- 65.Gonzalez AM, Hill DJ, Logan A, Maher PA, Baird A. Distribution of fibroblast growth factor (FGF)-2 and FGF receptor-1 messenger RNA expression and protein presence in the mid-trimester human fetus. Pediatr Res. 1996;39:375–385. doi: 10.1203/00006450-199603000-00001. [DOI] [PubMed] [Google Scholar]
- 66.Bikfalvi A, Klein S, Pintucci G, Rifkin DB. Biological roles of fibroblast growth factor-2. Endocrine Rev. 1997;18:26–45. doi: 10.1210/edrv.18.1.0292. [DOI] [PubMed] [Google Scholar]
- 67.Davis MG, et al. Intracrine and autocrine effects of basic fibroblast growth factor in vascular smooth muscle cells. J Mol Cell Cardiol. 1997;29:1061–1072. doi: 10.1006/jmcc.1997.0383. [DOI] [PubMed] [Google Scholar]
- 68.Owen M. Lineage of osteogenic cells and their relationship to the stromal system. W.A. Peck, editor. Bone and mineral research. 1985;3:1–25. [Google Scholar]
- 69.Friedenstein AJ. Osteogenic stem cells in the bone marrow. J Bone Miner Res. 1990;7:243–272. [Google Scholar]
- 70.Stein GS, Lian JB. Molecular mechanisms mediating proliferation/differentiation interrelationships during progressive development of the osteoblast phenotype. Endocr Rev. 1993;14:424–442. doi: 10.1210/edrv-14-4-424. [DOI] [PubMed] [Google Scholar]
- 71.Aubin JE, Liu F, Malaval L, Gupta AK. Osteoblast and chondroblast differentiation. Bone. 1995;17:77S–83S. doi: 10.1016/8756-3282(95)00183-e. [DOI] [PubMed] [Google Scholar]
- 72.Lennon DP, Haynesworth SE, Young RG, Dennis JE, Caplan AI. A chemically defined medium supports in vitro proliferation and maintains the osteochondral potential of rat marrow-derived mesenchymal stem cells. J Exp Cell Res. 1995;219:211–222. doi: 10.1006/excr.1995.1221. [DOI] [PubMed] [Google Scholar]
- 73.Noff D, Pitaru S, Savion N. Basic fibroblast growth factor enhances the capacity of bone marrow cells to form bone-like nodules In Vitro. FEBS Lett. 1989;250:619–621. doi: 10.1016/0014-5793(89)80808-7. [DOI] [PubMed] [Google Scholar]
- 74.Pitaru S, Kotev-Emeth S, Noff D, Kaffuler S, Savion N. Effect of basic fibroblast growth factor on the growth and differentiation of adult stromal bone marrow cells: enhanced development of mineralized bone-like tissue in culture. J Bone Miner Res. 1993;8:919–926. doi: 10.1002/jbmr.5650080804. [DOI] [PubMed] [Google Scholar]
- 75.Wergedal JE, Mohan S, Lundy M, Baylink DJ. Skeletal growth factor and other growth factors known to be present in bone matrix stimulate proliferation and protein synthesis in human bone cells. J Bone Miner Res. 1990;5:179–185. doi: 10.1002/jbmr.5650050212. [DOI] [PubMed] [Google Scholar]
- 76.Pri-Chen S, Pitaru S, Lokiec F, Savion N. Basic fibroblast growth factor enhances the growth and expression of the osteogenic phenotype of dexamethasone-treated human bone marrow-derived bone-like cells in culture. Bone. 1998;23:111–117. doi: 10.1016/s8756-3282(98)00087-8. [DOI] [PubMed] [Google Scholar]
- 77.Berrada S, Lefebvre F, Harmand M-F. The effect of recombinant human basic fibroblast growth factor RHFGF-2 on human osteoblasts in growth and phenotype expression. In Vitro Cell Dev Biol-Anim. 1995;31:698–702. doi: 10.1007/BF02634091. [DOI] [PubMed] [Google Scholar]
- 78.Martin I, Muraglia A, Campanile G, Cancedda R, Quarto R. Fibroblast growth factor-2 supports ex vivo expansion and maintenance of osteogenic precursors from human bone marrow. Endocrinology. 1997;138:4456–4462. doi: 10.1210/endo.138.10.5425. [DOI] [PubMed] [Google Scholar]
- 79.Scutt A, Bertram P. Basic fibroblast growth factor in the presence of dexamethasone stimulates colony formation, expansion, and osteoblastic differentiation by rat bone marrow stromal cells. Calcif Tissue Int. 1999;64:69–77. doi: 10.1007/s002239900581. [DOI] [PubMed] [Google Scholar]
- 80.Hanada K, Dennis JE, Caplan AI. Stimulatory effects of basic fibroblast growth factor and bone morphogenetic protein-2 on osteogenic differentiation of rat bone marrow-derived mesenchymal stem cells. J Bone Miner Res. 1997;12:1606–1614. doi: 10.1359/jbmr.1997.12.10.1606. [DOI] [PubMed] [Google Scholar]
- 81.Triffitt, J.T. 1996. Fibroblast growth factor and vascular endothelial fibroblast growth factor families. In Principles of bone biology. Bilezikian, J.P., Raisz, L.G., and Rodan, G.A., editors. Academic Press. San Diego, CA. 627–645.
- 82.Kajkenova O, et al. Increased adipogenesis and myelopoiesis in the bone marrow of SAMP6, a murine model of defective osteoblastogenesis and low turnover osteopenia. J Bone Miner Res. 1997;12:1772–1779. doi: 10.1359/jbmr.1997.12.11.1772. [DOI] [PubMed] [Google Scholar]
- 83.Allouche M. Basic fibroblast growth factor and hematopoeisis. Leukemia. 1995;9:937–942. [PubMed] [Google Scholar]


