

Abstract
We have developed a new method to provide a comprehensive quantitative analysis of brain anatomy in cerebral palsy patients, which makes use of two techniques: diffusion tensor imaging and automated 3D whole brain segmentation based on our brain atlas and a nonlinear normalization technique (large-deformation diffeomorphic metric mapping). This method was applied to 13 patients and normal controls. The reliability of the automated segmentation revealed close agreement with the manual segmentation. We illustrate some potential applications for individual characterization and group comparison. This technique also provides a framework for determining the impact of various neuroanatomic features on brain functions.
Introduction
Cerebral palsy is the most common chronic motor disorder of childhood, affecting approximately 2 to 2.5 infants per 1,000 live births (Ashwal et al., 2004). The increase in survival rates for preterm infants has amplified the risk of brain injuries that potentially cause CP. In addition to immeasurable health, social, and psychological problems that the affected children and their families suffer, CP has a huge economic impact. Among 18 common congenital disorders, CP has the highest lifetime costs per new case (Grether, Cummins, Nelson 1992). Therefore, efforts to prevent its occurrence, minimize the morbidity, and improve the patient outcomes are important at both the individual and societal levels.
The term CP is descriptive and includes a number of etiologies and clinical presentations. Patients have in common a non-progressive motor deficit due to a cerebral abnormality. Independent of the etiology, CP patients typically have some type of white matter injury. Periventricular leukomalacia (PVL) is the most common pattern (Volpe 2009). Despite a plethora of accepted medical and rehabilitative interventions, there is often an incomplete understanding of the etiology, as well as the variability in treatment and outcomes. Remarkably, patients with similar etiology and clinical background can display different time courses and prognoses. Identifying and understanding the factors responsible for this variability might contribute not only to the understanding of brain function, but also to the design of novel therapeutic options at the early stages of brain development.
The effective planning of patient treatment, however, is confounded by the fact that the child must be 2–3 years of age to accurately measure normal functions. Magnetic resonance imaging (MRI), which often reveals anatomic abnormalities, even as early as the newborn stage, could offer a unique, non-invasive opportunity to predict neurological deficits (Hoon 2005; Krageloh-Mann and Horber 2007). Signal and volumetric abnormalities have been shown to correlate with the type and severity of neurologic sequelae (Arzoumanian et al., 2003). White matter abnormalities correlate with long-term motor outcome (Nanba et al., 2007; Woodward et al., 2006). Compared with other methods and neurological tests, MRI demonstrated the greatest accuracy in predicting combined motor outcomes, with 90% specificity; however, the sensitivity is low (Spittle et al., 2009). In this study, we hypothesized that quantitative analysis of the white matter anatomy, based on diffusion tensor imaging (DTI), enhances our ability to sensitively and specifically predict the outcome. With the detailed anatomy revealed by DTI, we now have access to a more complete picture of the patterns of white matter injury. Previously, DTI-based white matter analyses of CP patients have been reported, in which pre-defined and selected white matter structures were investigated using manually placed regions of interest or tractography (Fan et al., 2006; Hoon Jr et al., 2009; Nagae et al., 2007; Panigrahy et al., 2005; Son et al., 2007; Son et al., 2009; Thomas et al., 2005; Yoshida et al., 2010).
In this study, we attempt to segment the brain into 110 sub-regions using an atlas-based 3D image transformation method (Oishi et al., 2008). We believe that this comprehensive analysis is essential for the evaluation of white matter injuries in CP patients because of the following reasons. First, white matter injuries in CP may not be localized in one tract. The functional disabilities could be better explained by the interaction among multiple abnormal areas than by the effect of one or other isolated regions (Kinney et al., 1988). Second, as mentioned previously, CP describes a heterogeneous group in terms of etiology, type of lesions, functional status, and outcomes. An integrative and objective analysis of different parameters in different regions could help in determining what, if any, are the neuroanatomic similarities between different subgroups, and how different insults to the developing brain contribute to differences in motor and cognitive ability. The detection of these similarities may improve treatments and our ability to determine a neurodevelopmental prognosis.
In this paper, we first tested the accuracy of the whole brain segmentation. Although the segmentation accuracy was previously tested for pediatric, young adult (Faria et al., 2010), and elderly populations, including Alzheimer’s disease patients (Oishi et al., 2009), the severe anatomical deformation of the CP population poses unique challenges; namely, the extent of white matter injuries is often far greater and more specific to certain white matter tracts in CP than in the Alzheimer population. Second, from the normal pediatric data, we measured the extent of anatomical variability of 110 segmented structures, from which the sensitivity of the measurements was estimated. Third, we applied the normal data for automated abnormality detection of each CP patient, which leads to a “white matter injury profile,” and consists of a 110-element vector for regional white matter volume, FA, ADC, radial, and axial diffusivity (total 5 × 110 matrix). The advantages and potential pitfalls of this comprehensive quantitative analysis will be discussed.
Methods
Subjects
Data from 13 CP patients (8 males; ages ranging from 4 to 13 years old; mean, 6.4 years) were used in this study. The scans were clinically indicated for diagnosis or follow-up. Gestational age at birth ranged from 23 to 34 weeks (mean, 28 weeks). Most children had spastic diplegia (11/13, 85%); one had spastic quadriplegia; and one had hemiplegia. All of them had PVL diagnosed by neuroradiologic review of conventional MR imaging. The patients’ demographic characteristics, as well as the diagnosis, are listed in Appendix Table 1. This study was approved by the Institutional Review Board of each participating site, and written informed consent was obtained from each adult or from the child’s parents. The patients required sedation for the conventional clinical images and remained sedated for the DTI research images.
Data from a total of 35 subjects from a pediatric database (lbam.med.jhmi.edu) (Hermoye et al., 2006), acquired with the same imaging protocol employed for CP patients, were used in this study. This database included nine healthy pediatric volunteers (> 4 years old) and 17 pediatric patients referred for a clinical MR examination for extracranial symptoms (14 male; > 2 years-old; mean age, 6.7 years). The clinical indications were pathologies related to the internal ear, the orbits, the spine, epilepsy, trauma, infectious disease, genetic disease, and vascular/cisternal malformation. The clinical history of each patient was carefully reviewed by a pediatric neurologist to exclude associated neurological disorders. All the subjects were full-term. In all the patients, the cerebral anatomy was normal. The present study also includes image data from nine healthy adult volunteers (five males, ages ranging from 22 to 40 years old; mean age, 30 years).
MRI data
Images were acquired using a SENSE head coil on a 1.5 T whole body MRI scanner (Philips Medical Systems, Best, The Netherlands). All patients had routine clinical pulse sequences, including fat-saturated axial T2-weighted (TR/TE, 3992.36–4524.67/110 ms) sequence. For DTI acquisitions, a single-shot spin echo, echo planar imaging (EPI) was used, with diffusion gradients applied in 31 or 34 non-collinear directions and b = 700 s/mm2. One reference image with least diffusion weighting (b = 33 s/mm2) was also acquired (called the b0 image in this paper). Fifty axial slices were acquired, parallel to the AC–PC line. The field of view (FOV), the size of the acquisition matrix, and the slice thickness were 240 × 240 mm/96 × 96/2.5 mm. All images were zero-filled to the final reconstruction matrix of 256 × 256. Other imaging parameters were: TR = 6.2 to 9.4 s; TE = 80 ms; and SENSE reduction factor = 2.5.
Imaging process
The six elements of the diffusion tensor, the fractional anisotropy, the eigenvectors, and the eigenvalues were calculated using DtiStudio (H. Jiang and S. Mori, Johns Hopkins University, Kennedy Krieger Institute). The procedure of the subsequent normalization process, performed by DiffeoMap (Li, X.; Jiang, H.; and Mori, S.; Johns Hopkins University, www.MriStudio.org), is shown in Fig. 1. LDDMM was performed to correct distortion caused by b0 susceptibility according to a previous publication (Huang et al., 2008), using T2-WI as the target and the b0 image as the DTI data. The images were then normalized to the ICBM-DTI-81 coordinates (Mori et al., 2008) using 12-mode affine transformation and further transformed non-linearly to a single-subject template using LDDMM (Miller et al., 2005; Zhang et al., 2007).
Figure 1.
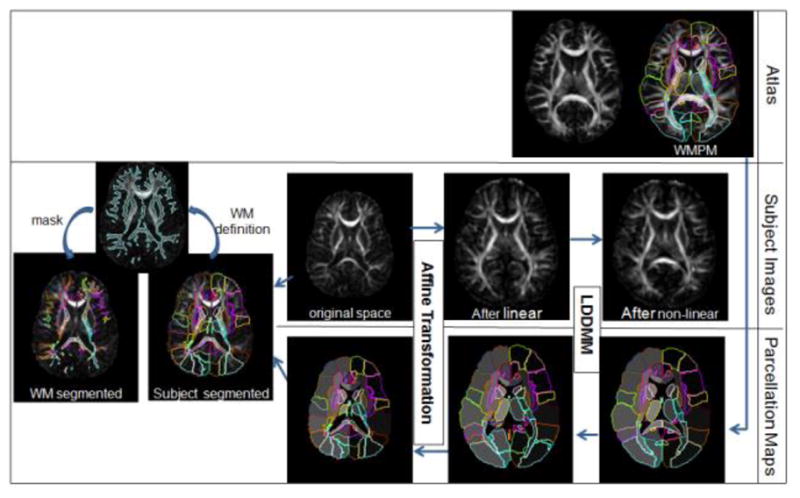
Schematic diagram of the image normalization process. The initial images for the image analysis are the subject’s MRI in the original space and the atlas with the white matter parcellation map (WMPM). For the “forward” transformation, the subject image was first linearly normalized (affine transformation), followed by non-linear normalization (LDDMM). After this procedure, all subject images were transformed to a shape similar to that of the atlas. For the “backward” transformation, the WMPM was transformed to the original MRI using the same transformation matrices and deformation maps that were used for the forward transformation. This allowed automated segmentation of the original images into 110 subregions. Because the peripheral white matter has a large amount of anatomical variability, it was further defined using a threshold (FA > 0.25), followed by minimum manual adjustments for each subject.
For the template, the JHU-DTI-MNI “Eve” atlas was chosen, which is a single-subject template in the ICBM-DTI-81 space and is extensively segmented (Oishi et al., 2009). We call this the “WMPM” (white matter parcellation map) hereafter. Because of the reciprocal nature of the LDDMM, the transformation results can be used to warp the WMPM to the original MRI data, thus automatically segmenting each brain into subregions. This is basically a “reverse transformation” compared to the process described before. These initial segmentation results (110 regions) were further segmented to separate the cortex and the associated peripheral white matter, as shown in Fig. 1, using the FA threshold (FA ≥ 0.25). Finally, five measurements were quantified for each region, in each subject: volume; FA; ADC; and axial and radial diffusivities.
Accuracy of the Transformation-based Segmentation
The transformation-based segmentation was examined for accuracy by comparing the results with manual segmentation. To ensure the accuracy, we tested our method in patients with different types of large anatomic deformations. Thus, we chose ten CP patients with very different types of injuries, based on the classification established in one of our previous publications (Nagae et al., 2007). Because it is impossible to perform the entire 110 3D segmentation by hand, we extracted representative 2D slices, and eight structures were manually delineated using RoiEditor (Li, X.; Jiang, H.; and Mori, S.; Johns Hopkins University, www.MriStudio.org or mri.kennedykrieger.org). Six white matter and two subcortical gray matter structures were delineated, as shown in Fig. 2. To investigate intra-rater variability of the manual delineation, a rater (AVF) repeated this manual delineation three times at a more than two-week interval. Two other raters (KO and JH) performed manual delineation to investigate inter-rater variability. The reliability analysis was performed to estimate Kappa statistics, sensitivity, and specificity, false positive and negative rates, positive and negative predictive values, Jaccard similarity metrics, and the Dice coefficient (Shattuck et al., 2009; Zou et al., 2004).
Figure 2.
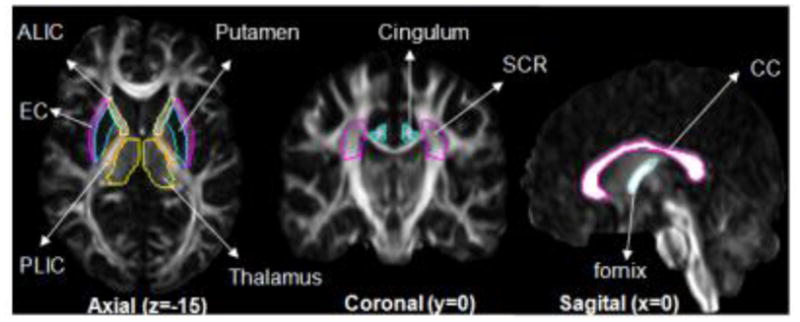
Regions and 2D slices defined for the test of accuracy.
In addition, to check the agreement between automated measurements and visual analysis, the volumes of nine white matter tracts (bilateral posterior thalamic radiations, retrolenticular part of internal capsule, superior corona radiate, and three corpus callosum regions: genu, body, and splenium) in all the 13 CP patients were correlated with the qualitative scoring of atrophy performed by three evaluators. The protocol for the visual scoring followed our previous publications (Nagae et al., 2007) mentioned above and correlation was calculated by Spearman (ranking) test.
Anatomical evaluation of CP patients
The volume, FA, and ADC of each parcellated area were measured in the images of the normal individuals and processed using the same procedure described for the CP patients. Using a subset of 13 controls, paired by age and gender with the CP patients, we obtained the average and standard deviation values for a normal population with demographic characteristics similar to those of the CP population. Using these values, we performed power analyses to determine the number of patients and controls that would be required for future studies. Particularly here, we calculated the number of participants needed for an unpaired t-test with 95% power and statistical significance less than 0.05 to detect an effect size of 10%.
For demonstrating the “individual classification” application, we applied this WMPM, enriched by the normal data of the 35 subjects, for the quantitative detection of abnormalities in the CP patients. The values of FA and volume of each one of the 110 ROIs of the normal development subjects (the Y axis) were plotted against age (the X axis) in a logarithmic scale. We then calculated the linear curve that best fitted the normal data in each ROI and created z-score maps for each CP patient in which the amount of deviations from the normal fitted value was color-coded. These kinds of maps can be created for each patient, allowing quantitative evaluation of their anatomy at a glance.
Results
Accuracy of the Transformation-based Segmentation
Figure 3 demonstrates the brain normalization by LDDMM for one of the most severely affected CP patients, with large lateral ventricles and global volume reduction, particularly of the white matter. As the native patient image (3B) was transformed by affine (3C) and LDDMM (3D), matching between the patient anatomy and the WMPM progressively improved. After the affine transformation (3C), there was still a considerable amount of mismatch in the white matter, such as the corpus callosum, the internal capsules, the cingulum, the thalamus and, more evidently, in the ventricles. After LDDMM, the matching seems almost perfect visually (3D). Similar observations could be found when the WMPM defined in the template space was warped to the subject space using the “backward” LDDMM and the “inverse” linear matrix (3E).
Figure 3.

Demonstration of the normalization process and accuracy. (A) The Eve atlas used as the normalization target image; (B) a subject in the native space; (C) then warped to the atlas using the linear normalization, and finally (D) after LDDMM normalization. The WMPM defined for “Eve” was overlaid in A, B, C, and D. The superimposed lines are the template anatomical definition (WMPM). Note the complete mismatch between the WMPM and the subject in the native space (B) and the improvement of the matching in the image after LDDMM (D), compared to the same image after affine (C) in regions such as the corpus callosum, the cingulum, the internal capsula, the thalamus, the posterior thalamic radiation, and the ventricles. (E) The WMPM warped to the subject original image, where the measurement of volume and diffusivity indices was performed.
Figure 4 shows the means and standard deviations of the volume, FA, and ADC obtained using the manual and the automated segmentation, as well as the result of the quantitative measurements for accuracy using the Kappa analysis. The overall Kappa for “manual vs. automated” delineation of ROIs was 0.81, which means good agreement according to Landis and Koch criteria. The cingulum had the smallest index of agreement (Kappa = 0.68) and the putamen had the best agreement (Kappa = 0.89). Please note that the Kappa analysis results tend to be smaller for narrow and long structures, such as the cingulum. In seven of the eight regions, the Kappas from “manual vs. automated” are not significantly different from the inter-rater Kappas, suggesting that the automated approach has accuracy similar to one of the raters. The only exception was the corpus callosum for which all methods reached high Kappas (> 0.8), but manual methods outperformed automated, due to the ease of accurate and reproducible manual definition. Not surprisingly, the intra-rater Kappas are higher than “manual vs. automated” or inter-rater Kappas for most of the regions. By averaging the results from the eight regions, the Kappa values for “manual vs automated,” intra-rater, and inter-rater measurements were 0.81, 0.89, and 0.83, respectively. The Dice coefficients were virtually the same as the Kappa analysis.
Figure 4.
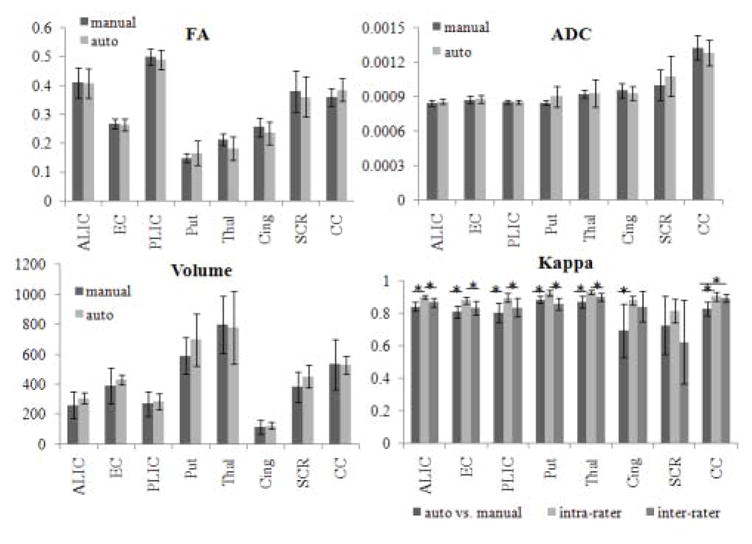
Bar graphs showing the means and standard deviations of the volume (mm3), FA, and ADC (mm2/s) obtained using the manual and the automated segmentation and the results of Kappa analysis. ALIC: anterior limb of internal capsule; EC: external capsule; PLIC: posterior limb of internal capsule; Put: putamen; Thal: thalamus; Cing: cingulum; SCR: superior corona radiata; CC: corpus callosum. * indicates statistical differences at p-value<0.05. Note that there is no significant difference between the automated and manual measurements of volume, FA, and ADC for any structure.
The overall sensitivity of the “manual vs. automated” measurements was 82%, similar to that obtained by the intra- and inter-raters measurements (88% and 86%, respectively). The overall positive predictive value was 0.8 for both “manual vs. automated” and inter-rater measurements, and 0.9 for the intra-rater measurements. The overall false negative rate was 18% for the “manual vs. automated,” compared to 14% for the inter-raters and 12% for the intra-rater measurements. The sensitivity was extremely high (higher than 99%) and the false positive ratio was extremely low (lower than 2%) in all the areas, and in all the comparisons. The overall Jaccard similarity metric was 0.68 for the “manual vs. automated,” compared with 0.73 for inter-raters and 0.81 for intra-raters metrics. All the accuracy measurements are shown in the Appendix Table 2.
The correlation between the automatically measured volumes and the average scores of atrophy based on the visual analysis performed by three evaluators was as strong as the correlation between the scoring among evaluators (Rho = 0.63).
Power Analysis
WMPM-based measurements applied to the 13 normal participants were used for the initial estimation of power analysis. Table 1 and Fig. 5 summarize the results of power analysis to detect a 10% change in FA, ADC, and volume (5A), and the amount of change needed in each of these parameters to detect significant differences (5B). With the progressive increase of the sample size and/or the progressive increase of the amount of “abnormalities,” we are able to detect differences in an increasing number of regions, with a statistical power of 95%, using p-values<0.05. The former analysis provides information by which to design group-based analysis (how many sample numbers are needed to detect 10% change), while the latter analysis can be used to determine how many anatomical changes are required to detect statistically significant abnormalities. For example, a sample size of 20 subjects would be enough to detect 10% changes in approximately 80% of brain regions if one is interested in FA and ADC changes (Fig. 5A), but the same sample size is not enough to detect 10% volume changes in any of the anatomical regions. This is because regional volumes have much higher variability among normal subjects. On the other hand, if there is 40% volume change, such change can be statistically detected in 80% of the regions (Fig. 5B).
Table 1.
Number of participants needed, on average, to detect a 10% of change in FA, ADC, and volume, and percentage of change in these parameters needed, on average, to detect differences in an unpaired t-test, with a p-value significance of 0.05 and 95% power.
| n° of regions | Sample size to detect 10% of change (per group) | % of change to detect difference (n=13 per group) | |||||
|---|---|---|---|---|---|---|---|
| FA | ADC | Volume | FA | ADC | Volume | ||
| Peripheral white matter | 44 | 6 | 10 | 230 | 5.6 | 7.7 | 37.5 |
| Deep white matter | 58 | 12 | 10 | 100 | 8.1 | 7.5 | 25 |
| Subcortical gray matter | 8 | 25* | 20** | 60 | 12.7 | 10 | 19.5 |
Globus pallidum, caudate, and putamen required more than 30 patients;
Caudate required 58 patients.
Figure 5.
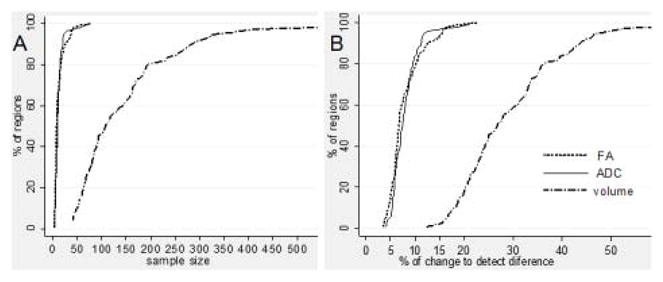
(A) Cumulative graphic of the sample size needed to detect 10% of change in FA, ADC, and volume in each region defined by the WMPM, in an unpaired t-test, with a p-value significance of 0.05 and 95% power. (B) Cumulative graphic of the percentage of change in FA, ADC, and volume required to detect a difference between groups, in the same conditions (n=13 subjects per group).
Individual classification of the degree of abnormalities
In Fig. 6, individual-based quantitative anatomical evaluation is demonstrated, in which z-score maps of the volume and FA values of two very different subjects, with regard to anatomy and a control subject of similar age, were analyzed. The most evident characteristic of Patient #1 is the ventricle enlargement and the reduction of the white matter. Patient #2 is marked by abnormal intensities in the white matter (hyper ADC and hypo FA areas) due to PVL, even though he also has large ventricles and a certain degree of white matter reduction. Focusing on the superior longitudinal fasciculus left (SLF, arrows), for example, visual inspection of the FA images of the patients reveals a smaller SLF, particularly in Patient #1, with possibly lower FA values, particularly in Patient #2. However, it is not straightforward to determine whether these maps are beyond the normal range of variability. For each segment, age-dependence and variability range was calculated from the control data, and deviations were delineated by z-scores, as shown in Fig. 6, second and third lines. The actual fitting results for the left SLF are shown in the graphics. Our results indicate that the CP patients (yellow squares) had smaller FA and volumes than the average control value. Patients #1 and #2 had FA values lower by more than four standard deviations than controls, and volumes lower by more than three standard deviations than controls. Note that the SLF of Patient #2 showed even lower FA values, with a z-score near −10, while the SLF in Patient #1 had an even lower volume, with a z-score near −4, which is in agreement with our visual impression.
Figure 6.

Demonstration of automated abnormality detection using the atlas enriched by a normal database of developing brains. The ADC and FA maps of one control and two CP patients show the large ventricles and white matter atrophy, particularly in Patient #1, and the abnormal contrast in the deep white matter, secondary to PVL, particularly in Patient #2. The FA and volume Z-score maps (second and third lines) show the degree of deviation from control values. These maps are shown in the atlas space, with which abnormal white matter tracts can be identified at a glance. Linear regressions of FA and the volume (mm3) of the left superior longitudinal fasciculus (SLF, arrows and surrounded area) of normal subjects (green dots) are shown by the continuous lines. Shaded area is 95% confidence interval of the curve and dashed lines are the prediction interval for z-scores of +/−2 (gray and red lines, respectively), -3 (blue line), and -4 (yellow line). Yellow squares are the results from CP patients. The color surrounding the images and circle colors in the scatter plots identify the subjects.
Discussion
In this paper, we tested the atlas-based quantification tool for the anatomical evaluation of CP patients. Typically, with the large extent of anatomical alteration in the CP population, the detection of anatomical abnormality by MRI is often straightforward and, thus, the aid of sophisticated image analyses may not be needed if only abnormality detection is the concern. What is not straightforward; however, is the quantification of the visible abnormalities, which could be an important resource for understanding the pathology, classifying patients, studying the anatomy-functional correlation, and possibly in the future, predicting functional outcomes and designing an intervention at the early phase of brain development.
In the quest to establish correlation between anatomical damages and functional outcomes, several attempts have been made in the past (Glenn et al., 2007; Hoon and Melhem 2000; Huppi and Dubois 2006; Kanda et al., 2004; Ludeman et al., 2008; Maenpaa et al., 2003; Nagae et al., 2007; Rose et al., 2007). One of the major targets of these past studies had been to identify anatomically important areas, the injury of which could be a surrogate marker of functional impairment. By focusing on several hypothetically important areas, these approaches, however, had a limited power for functional correlation. For example, even for a well-established relationship between motor function and the corticospinal tract, the correlation in CP patients is far from clear, and, in fact, there is evidence that injuries in the sensory pathway may also be a significant factor (Hoon Jr et al., 2009). We apparently need a more comprehensive and quantitative approach to describe the anatomical status of the patients. The proposed atlas-based quantification would provide means by which to quantitatively analyze the status of multiple areas at once. This is an essential first step toward comprehensive anatomy-function correlation studies of the CP population.
In this study, we introduced several new information and tools to further investigate the anatomical description of the pathology. First, the use of DTI allows us to delineate many substructures within the white matter, which are not visible with conventional MRI. Using this contrast, there is the potential that we can characterize injuries in specific white matter structures sensitively (Neil et al., 2002; Son et al., 2007). Second, we introduced 3D quantitative analyses based on the atlas-based segmentation of the entire brain into 110 areas. By measuring the volume, FA, ADC, and axial and radial diffusivity, we created a 5 × 110 matrix to profile the anatomical status of each patient quantitatively.
Accuracy of the brain segmentation and power analysis
The results of the whole-brain segmentation, based on the WMPM, were compared with manual segmentation (Appendix Table 2). The Kappa value, Jaccard similarity metrics, and Dice coefficients showed that the segmentation accuracy rivals that of inter-rater variability in all measured structures except for the corpus callosum, for which the inter-rater accuracy was significantly better than the automated method, but all measurements showed a high level of accuracy (Kappa > 0.80). The atlas-based segmentation showed noticeably lower accuracy for the cingulum, which was expected for this type of long and narrow structure; even a one-pixel shift along the entire length would lead to substantially lower accuracy. High inter-rater variability (large standard deviation) and accuracy (low Kappa) were observed for the superior corona radiata (SCR). This is understandable because there is no clear boundary of the corona radiata to separate it from the anterior, superior, and posterior portions. There is the potential that the WMPM-based segmentation could introduce objective criteria to delineate such structures.
The specificity was high (>99%) and the false negative rate was low (<2%) for all the regions, in all the comparisons. However, the overall sensitivity (82%) was slightly lower and the false negative rate (18%) was slightly higher for the automated segmentation compared to that achieved with inter (86% and 14%) and intra-raters (88% and 12%). Nevertheless, the correlation between automated measurements and visual scoring for atrophy was as strong as the correlation between visual scorings performed by different evaluators, indicating that the automated method is a practical alternative for the labor intense and time consuming visual semi-quantitative analysis.
The required level of accuracy depends on the expected effect size and the normal range of anatomical variability. The preliminary power analysis data, based on the 13 normal subjects is, thus, important for judging the usefulness of this approach. The variability observed for each of the 5 × 110 anatomical matrices is influenced by the true anatomical variability and accuracy of the measurements. Fig. 4 indicates the amount of abnormality needed in each variable to detect a difference between groups using an unpaired t-test, with an alpha less than 0.05. It also indicates the number of subjects needed per group to detect a 10% change in each variable in the same conditions, with a power of 0.95. We need, for example, larger samples or a larger degree of abnormalities to detect volumetric differences than is needed to detect FA or ADC differences. In the same way, the sample size or the differences in subcortical gray matter must be larger than that for structures in the white matter to detect the same degree of contrast difference. On the other hand, smaller differences or a smaller sample size is needed to detect volume differences in the subcortical gray matter compared to the white matter.
Quantitative anatomical profiling of each patient
Based on the atlas-based segmentation tool, we performed quantitative whole-brain evaluation of the anatomical status of each CP patient, as shown in Fig. 6. In agreement with the results from the power analysis, smaller variations in FA, compared to volume, can be detected as beyond the normal limits (predicted values ± 2 standard deviations - SD). In this example, a decrease of 12% in the left superior longitudinal fasciculus FA places the subject under the normal curve −2SD, while a decrease of 45% in volume is needed to have the same effect. Regardless of the relative insensitivity of the volume measurements, the volume z-score maps of the CP patients detected as many abnormal regions as the FA z-score maps, indicating the large amount of brain atrophy in this population. Once segmented, we can create an extensive report that will capture the characteristic anatomic features of each patient. For diseases like CP, which is known as a highly inhomogeneous entity, this type of evaluation would provide a highly individualized view of brain anatomic status. The proposed approach may provide information to identify not only anomalous regions, compared to normal subjects, but also their correlation with clinical performance. It is potentially possible to identify regions that determine subgroups in terms of anatomical and/or functional characteristics. In CP, this ‘global’ approach of analyzing the combined effect of multiple regions, tracts, or systems is particularly promising since clinical evidence points to multiple abnormalities that, together, determine the clinical status. In this paper, our results are descriptive and are limited to quantitative presentation of the abnormalities. For future investigations, this type of quantitative analysis will be a key to the effective utilization of MRI data acquired at an early phase of brain development to enable better prediction of prognosis.
Conclusion
We have developed a method that will provide a comprehensive quantitative analysis of brain anatomy based on DTI, as well as an automated 3D whole-brain segmentation supported by our brain atlas and a nonlinear diffeomorphic normalization technique. The accuracy measurements indicate the automated approach can deliver accuracy similar to manual delineation. We applied this tool to characterize the anatomical status of individual CP patients. The results of this quantitative analysis can be used for diagnosis guidance, group analysis, functional correlation, or even for the creation of prognostic models, which is particularly useful for diseases that heterogeneously involve multiple systems, such as CP.
Supplementary Material
Diagnosis and patients’ demographic characteristics.
Results from accuracy determination of the automated segmentation (WMPM-based) compared with manual structures delineation, as well as the intra-rater and inter-rater accuracy. PPV = positive predictive value; NPV = negative predictive value; FPR = false positive rate; FNR = false negative rate; Jaccard = Jaccard similarity metric; Dice = Dice coefficient.
Acknowledgments
We thank Dr. Lidia Nagae for the contribution in the MRI visual analysis. This research was made possible by the grants NINDS/NIH F05NS059230 (AVF), P41RR15241, RO1AG022012, and RO1NS058299 (SM), and NIH/NIA R21AG033774 and P50AG05146 (KO). Dr. Peter C.M. van Zijl is a paid lecturer for Philips Medical Systems. This arrangement has been approved by Johns Hopkins University in accordance with its conflict of interest policies.
Footnotes
Publisher's Disclaimer: This is a PDF file of an unedited manuscript that has been accepted for publication. As a service to our customers we are providing this early version of the manuscript. The manuscript will undergo copyediting, typesetting, and review of the resulting proof before it is published in its final citable form. Please note that during the production process errors may be discovered which could affect the content, and all legal disclaimers that apply to the journal pertain.
References
- Arzoumanian Y, Mirmiran M, Barnes PD, Woolley K, Ariagno RL, Moseley ME, Fleisher BE, Atlas SW. Diffusion tensor brain imaging findings at term-equivalent age may predict neurologic abnormalities in low birth weight preterm infants. American Journal of Neuroradiology. 2003;24(8):1646–1653. [PMC free article] [PubMed] [Google Scholar]
- Ashwal S, Russman BS, Blasco PA, Miller G, Sandler A, Shevell M, Stevenson R Quality Standards Subcommittee of the American Academy of Neurology, Practice Committee of the Child Neurology Society. Practice parameter: Diagnostic assessment of the child with cerebral palsy: Report of the quality standards subcommittee of the american academy of neurology and the practice committee of the child neurology society. Neurology. 2004;62(6):851–863. doi: 10.1212/01.wnl.0000117981.35364.1b. [DOI] [PubMed] [Google Scholar]
- Basser PJ, Mattiello J, LeBihan D. Estimation of the effective self-diffusion tensor from the NMR spin echo. Journal of Magnetic Resonance Series B. 1994;103(3):247–254. doi: 10.1006/jmrb.1994.1037. [DOI] [PubMed] [Google Scholar]
- Fan GG, Yu B, Quan SM, Sun BH, Guo QY. Potential of diffusion tensor MRI in the assessment of periventricular leukomalacia. Clinical Radiology. 2006;61(4):358–364. doi: 10.1016/j.crad.2006.01.001. [DOI] [PubMed] [Google Scholar]
- Faria AV, Zhang J, Oishi K, Li X, Jiang H, Akhter K, Hermoye L, Lee SK, Hoon A, Stachinko E, et al. Atlas-based analysis of neurodevelopment from infancy to adulthood using diffusion tensor imaging and applications for automated abnormality detection. NeuroImage. 2010;52(2):415–428. doi: 10.1016/j.neuroimage.2010.04.238. [DOI] [PMC free article] [PubMed] [Google Scholar]
- Glenn OA, Ludeman NA, Berman JI, Wu YW, Lu Y, Bartha AI, Vigneron DB, Chung SW, Ferriero DM, Barkovich AJ, et al. Diffusion tensor MR imaging tractography of the pyramidal tracts correlates with clinical motor function in children with congenital hemiparesis. American Journal of Neuroradiology. 2007;28(9):1796–1802. doi: 10.3174/ajnr.A0676. [DOI] [PMC free article] [PubMed] [Google Scholar]
- Grether JK, Cummins SK, Nelson KB. The california cerebral palsy project. Paediatric and Perinatal Epidemiology. 1992;6(3):339–351. doi: 10.1111/j.1365-3016.1992.tb00774.x. [DOI] [PubMed] [Google Scholar]
- Hermoye L, Saint-Martin C, Cosnard G, Lee SK, Kim J, Nassogne MC, Menten R, Clapuyt P, Donohue PK, Hua K, et al. Pediatric diffusion tensor imaging: Normal database and observation of the white matter maturation in early childhood. NeuroImage. 2006;29(2):493–504. doi: 10.1016/j.neuroimage.2005.08.017. [DOI] [PubMed] [Google Scholar]
- Hoon AH, Jr, Stashinko EE, Nagae LM, Lin DD, Keller J, Bastian A, Campbell ML, Levey E, Mori S, Johnston MV. Sensory and motor deficits in children with cerebral palsy born preterm correlate with diffusion tensor imaging abnormalities in thalamocortical pathways. Developmental Medicine and Child Neurology. 2009;51(9):697–704. doi: 10.1111/j.1469-8749.2009.03306.x. [DOI] [PMC free article] [PubMed] [Google Scholar]
- Hoon AH., Jr Neuroimaging in cerebral palsy: Patterns of brain dysgenesis and injury. Journal of Child Neurology. 2005;20(12):936–939. doi: 10.1177/08830738050200120201. [DOI] [PubMed] [Google Scholar]
- Hoon AH, Jr, Melhem ER. Neuroimaging: Applications in disorders of early brain development. Journal of Developmental and Behavioral Pediatrics. 2000;21(4):291–302. doi: 10.1097/00004703-200008000-00007. [DOI] [PubMed] [Google Scholar]
- Huang H, Ceritoglu C, Li X, Qiu A, Miller MI, van Zijl PC, Mori S. Correction of B0 susceptibility induced distortion in diffusion-weighted images using large-deformation diffeomorphic metric mapping. Magnetic Resonance Imaging. 2008;26(9):1294–1302. doi: 10.1016/j.mri.2008.03.005. [DOI] [PMC free article] [PubMed] [Google Scholar]
- Huppi PS, Dubois J. Diffusion tensor imaging of brain development. Seminars in Fetal & Neonatal Medicine. 2006;11(6):489–497. doi: 10.1016/j.siny.2006.07.006. [DOI] [PubMed] [Google Scholar]
- Jiang H, van Zijl PC, Kim J, Pearlson GD, Mori S. DtiStudio: Resource program for diffusion tensor computation and fiber bundle tracking. Computer Methods and Programs in Biomedicine. 2006;81(2):106–116. doi: 10.1016/j.cmpb.2005.08.004. [DOI] [PubMed] [Google Scholar]
- Kanda T, Pidcock FS, Hayakawa K, Yamori Y, Shikata Y. Motor outcome differences between two groups of children with spastic diplegia who received different intensities of early onset physiotherapy followed for 5 years. Brain & Development. 2004;26(2):118–126. doi: 10.1016/S0387-7604(03)00111-6. [DOI] [PubMed] [Google Scholar]
- Kinney HC, Brody BA, Kloman AS, Gilles FH. Sequence of central nervous system myelination in human infancy. II. patterns of myelination in autopsied infants. Journal of Neuropathology and Experimental Neurology. 1988;47(3):217–234. doi: 10.1097/00005072-198805000-00003. [DOI] [PubMed] [Google Scholar]
- Krageloh-Mann I, Horber V. The role of magnetic resonance imaging in elucidating the pathogenesis of cerebral palsy: A systematic review. Developmental Medicine and Child Neurology. 2007;49(2):144–151. doi: 10.1111/j.1469-8749.2007.00144.x. [DOI] [PubMed] [Google Scholar]
- Ludeman NA, Berman JI, Wu YW, Jeremy RJ, Kornak J, Bartha AI, Barkovich AJ, Ferriero DM, Henry RG, Glenn OA. Diffusion tensor imaging of the pyramidal tracts in infants with motor dysfunction. Neurology. 2008;71(21):1676–1682. doi: 10.1212/01.wnl.0000304084.59964.e2. [DOI] [PubMed] [Google Scholar]
- Maenpaa H, Salokorpi T, Jaakkola R, Blomstedt G, Sainio K, Merikanto J, von Wendt L. Follow-up of children with cerebral palsy after selective posterior rhizotomy with intensive physiotherapy or physiotherapy alone. Neuropediatrics. 2003;34(2):67–71. doi: 10.1055/s-2003-39598. [DOI] [PubMed] [Google Scholar]
- Miller MI, Beg MF, Ceritoglu C, Stark C. Increasing the power of functional maps of the medial temporal lobe by using large deformation diffeomorphic metric mapping. Proceedings of the National Academy of Sciences of the United States of America. 2005;102(27):9685–9690. doi: 10.1073/pnas.0503892102. [DOI] [PMC free article] [PubMed] [Google Scholar]
- Mori S, Oishi K, Jiang H, Jiang L, Li X, Akhter K, Hua K, Faria AV, Mahmood A, Woods R, et al. Stereotaxic white matter atlas based on diffusion tensor imaging in an ICBM template. NeuroImage. 2008;40(2):570–582. doi: 10.1016/j.neuroimage.2007.12.035. [DOI] [PMC free article] [PubMed] [Google Scholar]
- Nagae LM, Hoon AH, Jr, Stashinko E, Lin D, Zhang W, Levey E, Wakana S, Jiang H, Leite CC, Lucato LT, et al. Diffusion tensor imaging in children with periventricular leukomalacia: Variability of injuries to white matter tracts. American Journal of Neuroradiology. 2007;28(7):1213–1222. doi: 10.3174/ajnr.A0534. [DOI] [PMC free article] [PubMed] [Google Scholar]
- Nanba Y, Matsui K, Aida N, Sato Y, Toyoshima K, Kawataki M, Hoshino R, Ohyama M, Itani Y, Goto A, et al. Magnetic resonance imaging regional T1 abnormalities at term accurately predict motor outcome in preterm infants. Pediatrics. 2007;120(1):e10–9. doi: 10.1542/peds.2006-1844. [DOI] [PubMed] [Google Scholar]
- Neil J, Miller J, Mukherjee P, Huppi PS. Diffusion tensor imaging of normal and injured developing human brain -a technical review. NMR in Biomedicine. 2002;15(7–8):543–552. doi: 10.1002/nbm.784. [DOI] [PubMed] [Google Scholar]
- Oishi K, Faria A, Jiang H, Li X, Akhter K, Zhang J, Hsu JT, Miller MI, van Zijl PC, Albert M, et al. Atlas-based whole brain white matter analysis using large deformation diffeomorphic metric mapping: Application to normal elderly and alzheimer’s disease participantstlas. NeuroImage. 2009;46(2):486–499. doi: 10.1016/j.neuroimage.2009.01.002. [DOI] [PMC free article] [PubMed] [Google Scholar]
- Oishi K, Zilles K, Amunts K, Faria A, Jiang H, Li X, Akhter K, Hua K, Woods R, Toga AW, et al. Human brain white matter atlas: Identification and assignment of common anatomical structures in superficial white matter. NeuroImage. 2008;43(3):447–457. doi: 10.1016/j.neuroimage.2008.07.009. [DOI] [PMC free article] [PubMed] [Google Scholar]
- Panigrahy A, Barnes PD, Robertson RL, Sleeper LA, Sayre JW. Quantitative analysis of the corpus callosum in children with cerebral palsy and developmental delay: Correlation with cerebral white matter volume. Pediatric Radiology. 2005;35(12):1199–1207. doi: 10.1007/s00247-005-1577-5. [DOI] [PubMed] [Google Scholar]
- Pierpaoli C, Basser PJ. Toward a quantitative assessment of diffusion anisotropy. Magnetic Resonance in Medicine. 1996;36(6):893–906. doi: 10.1002/mrm.1910360612. [DOI] [PubMed] [Google Scholar]
- Rose J, Mirmiran M, Butler EE, Lin CY, Barnes PD, Kermoian R, Stevenson DK. Neonatal microstructural development of the internal capsule on diffusion tensor imaging correlates with severity of gait and motor deficits. Developmental Medicine and Child Neurology. 2007;49(10):745–750. doi: 10.1111/j.1469-8749.2007.00745.x. [DOI] [PubMed] [Google Scholar]
- Shattuck DW, Prasad G, Mirza M, Narr KL, Toga AW. Online resource for validation of brain segmentation methods. NeuroImage. 2009;45(2):431–439. doi: 10.1016/j.neuroimage.2008.10.066. [DOI] [PMC free article] [PubMed] [Google Scholar]
- Son SM, Park SH, Moon HK, Lee E, Ahn SH, Cho YW, Byun WM, Jang SH. Diffusion tensor tractography can predict hemiparesis in infants with high risk factors. Neuroscience Letters. 2009;451(1):94–97. doi: 10.1016/j.neulet.2008.12.033. [DOI] [PubMed] [Google Scholar]
- Son SM, Ahn YH, Sakong J, Moon HK, Ahn SH, Lee H, Yu IK, Shin YJ, Jang SH. Diffusion tensor imaging demonstrates focal lesions of the corticospinal tract in hemiparetic patients with cerebral palsy. Neuroscience Letters. 2007;420(1):34–38. doi: 10.1016/j.neulet.2007.04.054. [DOI] [PubMed] [Google Scholar]
- Spittle AJ, Boyd RN, Inder TE, Doyle LW. Predicting motor development in very preterm infants at 12 months’ corrected age: The role of qualitative magnetic resonance imaging and general movements assessments. Pediatrics. 2009;123(2):512–517. doi: 10.1542/peds.2008-0590. [DOI] [PubMed] [Google Scholar]
- Thomas B, Eyssen M, Peeters R, Molenaers G, Van Hecke P, De Cock P, Sunaert S. Quantitative diffusion tensor imaging in cerebral palsy due to periventricular whitematter injury. Brain. 2005;128(Pt 11):2562–2577. doi: 10.1093/brain/awh600. [DOI] [PubMed] [Google Scholar]
- Volpe JJ. Brain injury in premature infants: A complex amalgam of destructive and developmental disturbances. Lancet Neurology. 2009;8(1):110–124. doi: 10.1016/S1474-4422(08)70294-1. [DOI] [PMC free article] [PubMed] [Google Scholar]
- Woods RP, Grafton ST, Holmes CJ, Cherry SR, Mazziotta JC. Automated image registration: I. general methods and intrasubject, intramodality validation. Journal of Computer Assisted Tomography. 1998;22(1):139–152. doi: 10.1097/00004728-199801000-00027. [DOI] [PubMed] [Google Scholar]
- Woodward LJ, Anderson PJ, Austin NC, Howard K, Inder TE. Neonatal MRI to predict neurodevelopmental outcomes in preterm infants. The New England Journal of Medicine. 2006;355(7):685–694. doi: 10.1056/NEJMoa053792. [DOI] [PubMed] [Google Scholar]
- Xu D, Mori S, Shen D, van Zijl PC, Davatzikos C. Spatial normalization of diffusion tensor fields. Magnetic Resonance in Medicine. 2003;50(1):175–182. doi: 10.1002/mrm.10489. [DOI] [PubMed] [Google Scholar]
- Yoshida S, Hayakawa K, Yamamoto A, Okano S, Kanda T, Yamori Y, Yoshida N, Hirota H. Quantitative diffusion tensor tractography of the motor and sensory tract in children with cerebral palsy. Developmental Medicine and Child Neurology. 2010 Apr 12; doi: 10.1111/j.1469-8749.2010.03669.x. [Epub ahead of print] [DOI] [PubMed] [Google Scholar]
- Zhang J, Evans A, Hermoye L, Lee SK, Wakana S, Zhang W, Donohue P, Miller MI, Huang H, Wang X, et al. Evidence of slow maturation of the superior longitudinal fasciculus in early childhood by diffusion tensor imaging. NeuroImage. 2007;38(2):239–247. doi: 10.1016/j.neuroimage.2007.07.033. [DOI] [PMC free article] [PubMed] [Google Scholar]
- Zou KH, Warfield SK, Bharatha A, Tempany CM, Kaus MR, Haker SJ, Wells WM, 3rd, Jolesz FA, Kikinis R. Statistical validation of image segmentation quality based on a spatial overlap index. Academic Radiology. 2004;11(2):178–189. doi: 10.1016/S1076-6332(03)00671-8. [DOI] [PMC free article] [PubMed] [Google Scholar]
Associated Data
This section collects any data citations, data availability statements, or supplementary materials included in this article.
Supplementary Materials
Diagnosis and patients’ demographic characteristics.
Results from accuracy determination of the automated segmentation (WMPM-based) compared with manual structures delineation, as well as the intra-rater and inter-rater accuracy. PPV = positive predictive value; NPV = negative predictive value; FPR = false positive rate; FNR = false negative rate; Jaccard = Jaccard similarity metric; Dice = Dice coefficient.