Abstract
Nonalcoholic steatohepatitis (NASH) and alcoholic liver disease have similar pathological features. Because CYP2E1 plays a key role in alcoholic liver disease with its ability to stimulate lipid peroxidation, we tested the proposal that CYP2E1 could also be a factor in the development of NASH. In a dietary model — mice fed a methionine- and choline-deficient (MCD) diet — liver injury was associated with both induction of CYP2E1 and a 100-fold increase in hepatic content of lipid peroxides. Microsomal NADPH-dependent lipid oxidases contributed to the formation of these lipid peroxides, and in vitro inhibition studies demonstrated that CYP2E1 was the major catalyst. To further define the role of CYP2E1 as an initiator of oxidative stress in NASH, Cyp2e1–/–mice were administered the MCD diet. CYP2E1 deficiency neither prevented the development of NASH nor abrogated the increased microsomal NADPH-dependent lipid peroxidation, indicating the operation of a non-CYP2E1 peroxidase pathway. In Cyp2e1–/– mice with NASH (but not in wild-type mice), CYP4A10 and CYP4A14 were upregulated. Furthermore, hepatic microsomal lipid peroxidation was substantially inhibited by anti-mouse CYP4A10 antibody in vitro. These results show that experimental NASH is strongly associated with hepatic microsomal lipid peroxidation. CYP2E1, the main enzyme associated with that process in wild-type mice, is not unique among P450 proteins in catalyzing peroxidation of endogenous lipids. We have now identified CYP4A enzymes as alternative initiators of oxidative stress in the liver.
Introduction
Nonalcoholic steatohepatitis (NASH) is a common liver injury in which the histopathological abnormalities mimic those of alcoholic steatohepatitis (1). The histopathological features include steatosis, evidence of liver cell injury, a mixed inflammatory lobular infiltrate, and variable fibrosis (1–4). The pathophysiological mechanisms leading to the development of NASH remain unclear. The disorder is commonly associated with obesity, type 2 diabetes, hyperlipidemia, and rapid weight loss (5, 6). Hepatic steatosis has been proposed to be an essential precursor of NASH, but the chronic accumulation of fat, as seen in rodent models of genetic obesity such as obese (ob/ob) mice and fatty (fa/fa) Zucker rats, or in some obese humans, does not lead to necroinflammatory lesions (7–9). Thus, triggering host or environmental factors seem to be required to precipitate a cascade of events leading to cell necrosis, inflammation, and fibrosis. Two proposed causes are toxic lipid peroxidation and portal endotoxemia (9–15).
The similarity of hepatic lesions between NASH and alcoholic steatohepatitis suggests the possibility of common elements of pathogenesis. Numerous studies have emphasized the critical importance of oxidative stress as part of the pathophysiological mechanism of alcoholic steatohepatitis (16). For instance, antioxidants such as polyenylphosphatidylcholine that correct oxidative stress and lipid peroxidation prevent liver cirrhosis in baboons chronically fed alcohol (17, 18). There is accumulating evidence that alcohol-mediated upregulation of cytochrome P450 2E1 (CYP2E1) may initiate lipid peroxidation by the production of reactive oxygen species (16, 19, 20). In view of the cytotoxic effect of reactive oxygen species and lipid peroxides (21, 22) and the capacity of CYP2E1 to generate such intermediates (19, 20, 23, 24), it is likely that this enzyme plays a key role in the pathogenesis of liver injury.
Previous studies from this laboratory have demonstrated that upregulation of hepatic CYP2E1 occurs in patients with NASH (25). Interestingly, diabetes and starvation — factors reported to be clinically associated with more severe development of NASH (7, 9) — also upregulate CYP2E1. Furthermore, rats fed a methionine- and choline-deficient (MCD) diet develop NASH in which the extent and lobular distribution of CYP2E1 expression are closely related to the distribution of steatosis and inflammation (14).
In this study, we tested the proposal that hepatic CYP2E1 plays a central role in the development of NASH by initiating lipid peroxidation. Establishment of a murine model of NASH (mice fed the MCD diet) confirmed that extensive liver injury was associated with induction of CYP2E1 and high levels of liver lipoperoxides. We then demonstrated that in wild-type mice, CYP2E1 was the main enzyme responsible for the enhanced microsomal lipid peroxidation observed in NASH. Finally, we tested whether CYP2E1 was essential for the development of NASH by feeding the MCD diet to Cyp2e1–/– mice. Surprisingly, the absence of CYP2E1 neither prevented the development of NASH nor abrogated the operation of microsomal lipid peroxidation. However, we provide evidence that an alternative CYP-mediated pathway is effective in generating microsomal lipid peroxidation in Cyp2e1-deficient mice.
Methods
Animals.
All protocols for animal experimentation and maintenance were approved by the Westmead Hospital Animal Ethics Committee and conformed to the highest international standards of humane care. C57BL6/J mice were obtained from Monash University Animal Service (Melbourne, Australia). Cyp2e1–/– mice were provided by F.J. Gonzalez (National Cancer Institute, National Institutes of Health, Bethesda, Maryland, USA). Heterozygous Cyp2e1+/– littermates acted as controls. Animals (4 per cage) were provided with unrestricted amounts of food and water, housed in temperature- and humidity-controlled rooms, and kept on a 12-hour light/dark cycle. All experiments used female mice 8–10 weeks of age, weighing 20–25 g. At the end of the experimental period (up to 10 weeks), livers were rapidly excised and weighed. Aliquots were snap frozen and stored at –70°C until analysis, or were fixed in 4% buffered formaldehyde solution. Sections were stained with hematoxylin and eosin (H&E) for routine histology or Sirius red for collagen. Blood was obtained by cardiac puncture at the time of sacrifice, and the resulting serum was stored at –20°C until analysis.
Diet.
Mice of each genotype were randomly divided into 2 experimental groups and fed either a plain MCD diet (14) or the MCD diet supplemented with choline bitartrate (2 g/kg) and DL-methionine (3 g/kg); the latter was designated the control diet. MCD and control diets were purchased from ICN Biomedicals Inc. (Sydney, Australia). During the experimental period, individual body weights and food intake (for the 4 mice per cage) were recorded 3 times per week.
Biochemical analyses.
Assays for serum alanine aminotransferase (ALT), triglycerides, and cholesterol were performed by the Department of Clinical Chemistry at Westmead Hospital using automated procedures. Serum concentrations of β-hydroxybutyrate were measured using commercial reagents (Sigma Aldritch, St. Louis, Missouri, USA).
Total liver lipids were extracted from 50 mg of liver homogenate using methanol and chloroform (26), and were quantitated using the vanillin–phosphoric acid reaction (27). Total triglycerides were determined in the same homogenate using the triglyceride GPO-Trinder kit (Sigma-Aldritch).
For the determination of total lipoperoxides, a 50-mg aliquot of liver was homogenized in a 1.14% KCl solution containing desferrioxamine (50 mM; total volume 500 μL) to prevent the endogenous peroxidation of lipids during the procedure. Thiobarbituric acid–reactive substances (TBARs) were measured in 100 μL liver homogenate according to the technique described by Ohkawa et al. (28).
Preparation of hepatic microsomes and determination of microsomal proteins and enzyme activities.
Microsomal fractions were prepared from liver homogenate using differential centrifugation (29). Pellets were resuspended in 50 mM potassium phosphate buffer (pH 7.4) and snap frozen. These were kept at –70°C until further analysis. EDTA was omitted from the preparation and storage buffers because it acts as a potent inhibitor of lipid peroxidation (19). Microsomal protein was assayed by the method of Lowry et al. (30), using BSA as a standard.
Chlorzoxazone 6-hydroxylase activity was measured as an indicator of microsomal CYP2E1 activity; the method has been previously described (31).
Levels of individual CYP proteins were determined by Western immunoblot analysis, using either a rabbit polyclonal anti-rat CYP2E1 antibody (kindly supplied by M. Ingelman-Sundberg, Department of Physiological Chemistry, Karolinska Institute, Stockholm, Sweden) or polyclonal goat anti-rat CYP3A1, CYP1A1, or CYP4A1 antibodies (Gentest Corp., Woburn, Massachusetts, USA). Secondary antibodies were anti-rabbit or anti-goat peroxidase-conjugated antibodies (Sigma-Aldritch), as required. Proteins were viewed using enhanced chemiluminescence (ECL; Amersham Life Sciences, Amersham, United Kingdom). The exposed film was analyzed using a laser densitometer linked to the ImageQuant analysis program (both from Molecular Dynamics Inc., Sunnyvale, California, USA).
Determination of microsomal NADPH-dependent lipid peroxidation.
The capability of microsomal protein to peroxidize endogenous lipids in the presence of NADPH was determined using a technique described by Ekström and Ingelman-Sundberg (19). Briefly, the reaction mixture (100 μL) containing 200 μg protein in 50 mM potassium phosphate buffer (treated with Chelex-100) was incubated in the presence of 0.5 mM NADPH at 37°C for 10 minutes. The reaction was stopped by the addition of 25% acetic acid. After centrifugation, an aliquot of the supernatant was added to an equal volume of 7.3% thiobarbituric acid aqueous solution and heated at 95°C for 15 minutes. TBARs were extracted using 3 volumes of n-butanol. The absorbance of the organic phase was monitored at 535 nm, and the concentration of TBARs was calculated by reference to a calibration curve using authentic malondialdehyde-bis(dimethylacetal) (Sigma-Aldritch).
For pharmacological and immunological inhibition studies, microsomal protein was preincubated for 10–30 minutes at room temperature in the presence of either diethyldithiocarbamate (DETC; 10 μM) or rabbit polyclonal anti-rat CYP2E1 IgG, both of which are CYP2E1 inhibitors. Rabbit anti-rat CYP4A1 IgG (which has previously been demonstrated to cross-react specifically with mouse CYP4A10 [32] and is therefore referred to as anti-mouse CYP4A10) and anti-mouse CYP4A12 IgG (both provided by D.R. Bell, University of Nottingham, United Kingdom) were also used for inhibition studies. Control samples were incubated with vehicle or preimmune serum, as appropriate. Results are expressed as the percentage of inhibition; the maximal activity (no inhibition) is the activity of the control.
Determination of mRNA levels.
Total RNA was extracted from pulverized frozen liver using TRIzol reagent (GIBCO BRL, Gaithersburg, Maryland, USA). CYP2E1 mRNA levels were determined by Northern analysis using a riboprobe derived from bp 815-516 of the mouse CYP2E1 cDNA (33). The membranes were subsequently stripped and reprobed with an 18S rRNA oligonucleotide probe as a standard for the equivalence of loading and RNA integrity. For quantitation of individual mouse CYP4A mRNA species, RNase protection assays were performed using a standard technique (34). Specific probes for mouse CYP4A10, CYP4A12, and CYP4A14 have been described previously (32, 35) (GenBank accession numbers X71478, X71479, and Y11638, respectively). A pTRI–β-actin mouse antisense control template containing a 245-bp fragment of the mouse cytoplasmic β-actin gene (nucleotides 739–989 of GenBank accession number X03672) was purchased from Ambion Inc. (Austin, Texas, USA). The DNA templates were used to synthesize probes labeled with [α-32P]CTP (Amersham Life Science) in the presence of AGU-TP (0.5 μM each) using SP6 or T7 RNA polymerase (Promega Corp., Madison, Wisconsin, USA). The probes were subsequently purified using a NucTrap probe purification column (Stratagene, La Jolla, California, USA). Total RNA was cohybridized overnight at 48°C with either CYP4A10, CYP4A14 and β-actin, or CYP4A12 and β-actin riboprobes. After treatment with RNase T1 (Roche Molecular Biochemicals, Mannheim, Germany), protected fragments were separated on denaturing acrylamide-urea gels. Individual bands were made visible with autoradiography and were quantified using the PhosphorImager and ImageQuant analysis programs from Molecular Dynamics Inc. The level of a given CYP4A mRNA was expressed relative to β-actin mRNA.
Statistics.
All measurements were performed on blood samples, liver samples, protein, or RNA from individual animals. The results are presented as mean ± SD of 4 animals per genotype, treatment, and time point, unless otherwise indicated in the figure legends. The effects of dietary regimen and genotype on the different parameters were analyzed by 2-way ANOVA. If F was found to be significant, the Student’s t test was used to test individual differences. A value of P < 0.05 was considered to be statistically significant.
Results
Effects of MCD diet on C57BL6/J mice.
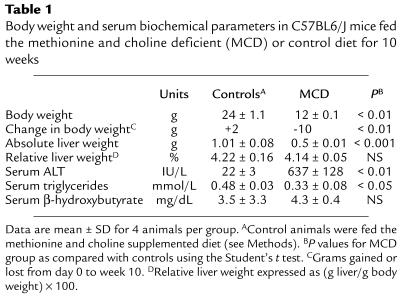
Despite a higher food intake relative to body weight, C57BL6/J mice fed the MCD diet lost weight compared with animals fed the control diet (Table 1). This weight loss was apparent immediately after starting the diet, and stabilized after 5 weeks. Despite the extent of weight loss, the general condition of the animals remained good and their behavior appeared normal throughout the experimental period. Furthermore, whereas serum triglyceride levels were decreased, levels of β-hydroxybutyrate remained unchanged in MCD diet–fed mice (Table 1), indicating that the reduction in body weight was not associated with a biochemical effect of fasting.
Table 1.
Body weight and serum biochemical parameters in C57BL6/J mice fed the methionine and choline deficient (MCD) or control diet for 10 weeks
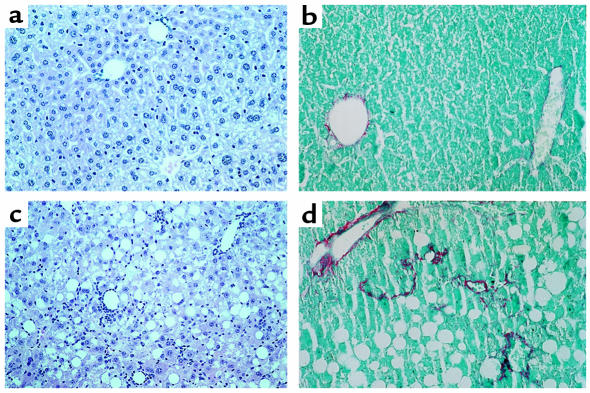
Feeding the MCD diet resulted in a major increase in serum ALT levels compared with controls, reaching 637 ± 128 IU/L after 10 weeks of the dietary regimen (Table 1). At this time, livers revealed lipid droplets as clear macrovacuoles affecting all but zone 1 hepatocytes (periportal hepatocytes) (Figure 1c). Staining with oil red O confirmed the lipid content of these vacuoles (not shown). Consistent with these morphological changes, total hepatic lipid content was increased by a factor of 2, and the triacylglycerol fraction increased 3-fold, compared with controls (Table 2). In addition to hepatic steatosis, there were large areas of mixed inflammatory cell infiltration and hepatocyte necrosis dissecting the liver parenchyma (Figure 1c), together with discrete perivenular and pericellular fibrosis (Figure 1d).
Figure 1.
Liver sections from female C57BL6/J mice fed the MCD diet and the control diet for 10 weeks. (a) Control mouse, H&E staining (×100). (b) Control mouse, Sirius red staining (×160). (c) MCD diet–fed mouse, H&E staining (×100). In addition to the macrovesicular steatosis mainly localized in zone 2, large areas of mixed inflammatory infiltrate with lymphocyte and polymorphonuclear neutrophil necroinflammation can be seen throughout the hepatic lobule. (d) MCD diet–fed mouse, Sirius red staining (×160). The collagen fiber deposits (stained red) confirm the discrete perivenular and pericellular fibrosis.
Table 2.
Effects of the methionine and choline deficient (MCD) diet on hepatic lipids and lipid peroxides, and CYP2E1 expression and activity in C57BL6/J mice
Effect of MCD diet on hepatic CYP2E1 expression.
To characterize hepatic CYP2E1 expression in C57BL6/J mice fed the MCD or control diet, we determined the levels of liver CYP2E1 mRNA, microsomal protein, and enzyme activity. As shown in Table 2, intake of the MCD diet was associated with pretranslational upregulation of CYP2E1, and the resultant increased level of CYP2E1 protein was catalytically active.
To establish the specificity of upregulation of CYP2E1, the expression of other major cytochromes P450 was examined. The levels of CYP1A and CYP3A proteins were slightly decreased in mice administered the MCD diet, whereas there was no significant change in mRNA levels of the 3 members of the mouse CYP4A subfamily (CYP4A10, CYP4A12, and CYP4A14) (data not shown).
Evidence of lipid peroxidation in C57BL6/J mice with NASH.
As indicated by the accumulation of TBARs, total lipid peroxides were dramatically increased (about 100-fold) in the livers of mice fed the MCD diet (Table 2). The possibility that microsomal proteins contributed to this increase was examined by determining NADPH-dependent lipid peroxidation in microsomal fractions. This activity was increased 3-fold in microsomal fractions prepared from MCD diet–fed mice compared with controls (1.52 ± 0.23 μmol and 0.45 ± 0.07 μmol TBARs/mg protein per min, respectively; P < 0.001).
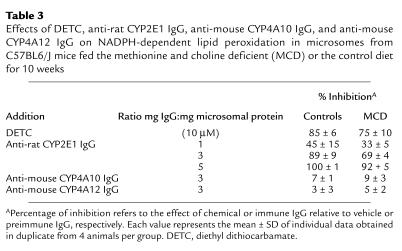
To determine the extent to which CYP2E1 contributed to microsomal NADPH-dependent lipid peroxidation, the effects of chemical and immunological inhibitors of CYP2E1 were studied. DETC was added to microsomal proteins at a concentration (10 μM) that inhibits chlorzoxazone 6-hydroxylase activity by 72% (data not shown), and that has been shown to specifically block CYP2E1-dependent activity (23, 36). DETC significantly inhibited NADPH-dependent lipid peroxidation in microsomes from MCD and control diet–fed mice by 75% and 85%, respectively. Furthermore, addition of anti-rat CYP2E1 antibody inhibited this activity in a dose-dependent manner in both groups (Table 3). In contrast, mouse-specific CYP4A10 and CYP4A12 antibodies failed to modify the rate of formation of lipid peroxides in hepatic microsomes from C57BL6/J mice (Table 3).
Table 3.
Effects of DETC, anti-rat CYP2E1 IgG, anti-mouse CYP4A10 IgG, and anti-mouse CYP4A12 IgG on NADPH-dependent lipid peroxidation in microsomes from C57BL6/J mice fed the methionine and choline deficient (MCD) or the control diet for 10 weeks
Effects of MCD diet in Cyp2e1–/– mice.
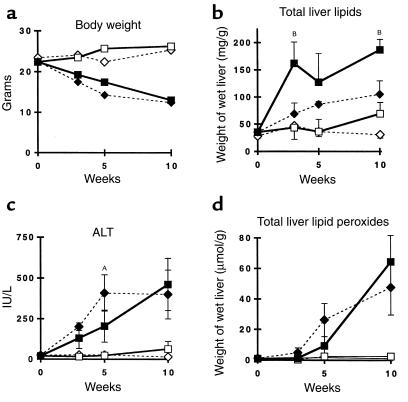
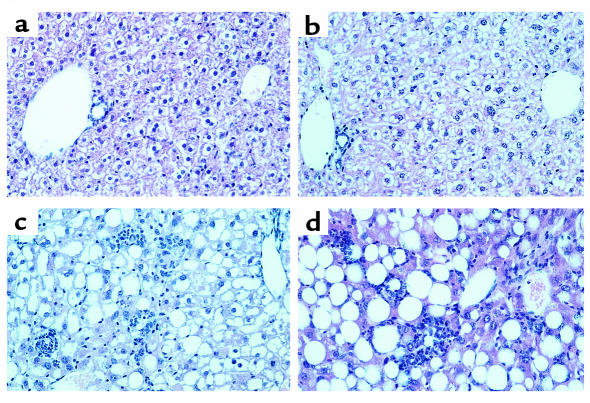
The previous results indicate that CYP2E1 is responsible for the enhanced lipid peroxidation observed in hepatic microsomes from mice fed the MCD diet. To test the hypothesis that increased expression of this enzyme is involved in the pathogenesis of NASH through the generation of oxidative stress, Cyp2e1–/– mice lacking expression of functional CYP2E1 protein were fed the MCD diet. The results were compared with Cyp2e1+/– mice challenged with the same dietary regimen. Compared with their respective controls, both Cyp2e1+/– and Cyp2e1–/– mice fed the MCD diet lost weight to the same extent (Figure 2a). Cyp2e1–/– mice subjected to the MCD diet also developed histological evidence of gross hepatic steatosis, focal hepatocellular necrosis, and mixed inflammatory infiltrate (Figure 3). The extent and severity of necroinflammatory changes were similar in Cyp2e1–/– and Cyp2e1+/– mice, but Cyp2e1–/– mice exhibited more fat accumulation than did their genetic controls (Figure 2b). Correspondingly, serum ALT levels were significantly higher (P < 0.001) in the MCD diet–fed mice of both genotypes relative to their respective controls (Figure 2c).
Figure 2.
Characteristics of Cyp2e1+/– mice (diamonds) and Cyp2e1–/– (squares) mice fed the MCD diet (filled symbols) or the control diet (open symbols) for up to 10 weeks. Changes in (a) body weight, (b) total hepatic lipids, (c) serum ALT levels, and (d) total hepatic lipid peroxides. AP < 0.05 and BP < 0.01 for MCD diet–fed Cyp2e1–/– mice compared with MCD diet–fed Cyp2e1+/– mice.
Figure 3.
Liver sections from Cyp2e1+/– mice and Cyp2e1–/– mice fed the MCD diet or the control diet for 10 weeks. (a) Cyp2e1+/– mouse and (b) Cyp2e1–/– mouse fed the control diet. The appearance of the hepatic parenchyma is similar in both genotypes. (c) Cyp2e1+/– mouse and (d) Cyp2e1–/– mouse fed the MCD diet. Administration of the MCD diet to both genotypes produced a severe macrovesicular, panlobular steatosis, hepatic necrosis, and mixed inflammatory infiltrate. H&E staining; ×160.
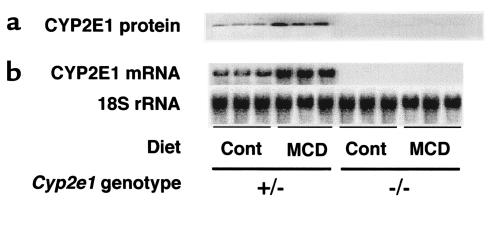
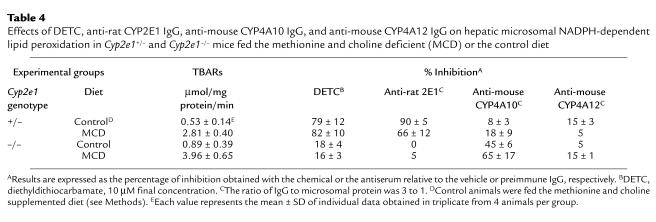
In both Cyp2e1–/– and Cyp2e1+/– mice fed the MCD diet, there was a major increase of lipid peroxides in the liver (Figure 2d). Likewise, despite the absence of CYP2E1 expression (confirmed by Northern and Western analyses; Figure 4), the basal level of microsomal NADPH-dependent lipid peroxidase activity appeared similar in Cyp2e1–/– and Cyp2e1+/– mice fed the control diet (Table 4). Moreover, administration of the MCD diet significantly increased this activity in both genotypes by a factor of 4.5 (Table 4). As observed in wild-type C57BL6/J mice, addition of DETC or CYP2E1 antiserum to the reaction mixture abrogated NADPH-dependent lipid peroxidation in Cyp2e1+/– mice. However, these reagents had no significant effect in microsomes prepared from Cyp2e1–/– mice (Table 4).
Figure 4.
Hepatic CYP2E1 expression in Cyp2e1+/– mice and Cyp2e1–/– mice fed the MCD diet or the control diet for 10 weeks. (a) Immunoblots obtained with anti-rat CYP2E1 antibody. (b) Northern blot analysis using a mouse-specific CYP2E1 riboprobe (see Methods). The signal for 18S rRNA is shown as a control for loading and RNA integrity.
Table 4.
Effects of DETC, anti-rat CYP2E1 IgG, anti-mouse CYP4A10 IgG, and anti-mouse CYP4A12 IgG on hepatic microsomal NADPH-dependent lipid peroxidation in Cyp2e1+/– and Cyp2e1–/– mice fed the methionine and choline deficient (MCD) or the control diet
These observations indicated that CYP2E1 is the major enzyme responsible for microsomal lipid peroxidation in mice expressing CYP2E1 protein (Cyp2e1+/– and wild-type C57BL6/J). However, the absence of CYP2E1 in microsomes from Cyp2e1–/– mice did not correlate with a decrease in lipid peroxidase activity. Furthermore, such activity was inducible in the Cyp2e1–/– mice to the same extent as in Cyp2e1+/– mice by feeding the MCD diet. We interpret these data as indicating that in the absence of CYP2E1, an alternative, inducible biochemical pathway operates to mediate microsomal NADPH-dependent lipid peroxidase activity.
Effects of MCD diet on cytochromes P450 in Cyp2e1–/– mice.
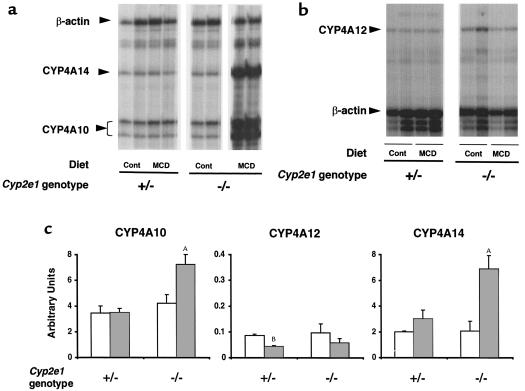
To test the above assertion, further studies were conducted to characterize MCD-induced changes in hepatic microsomal proteins in Cyp2e1–/– mice. Levels of CYP1A and CYP3A proteins were similar in Cyp2e1–/– mice and Cyp2e1+/– mice fed the control diet, whereas feeding the MCD diet produced an apparent slight (not significant) decrease in both proteins (not shown). The 2 major members of the mouse Cyp4a subfamily are Cyp4a10 and Cyp4a14; expression of Cyp4a12 is barely detectable in female mice. There were no differences in the RNA levels of these 3 genes between Cyp2e1–/– mice and Cyp2e1+/– mice fed the control diet (Figure 5c). However, feeding the MCD diet significantly increased hepatic CYP4A10 and CYP4A14 expression in Cyp2e1–/– mice, by 150% (P = 0.001) and 300% (P < 0.001), respectively (Figure 5, a and c). There was no change in CYP4A12 transcripts (Figure 5, b and c). In contrast, in Cyp2e1+/– mice, the MCD diet produced no significant change in the major forms of CYP4A (CYP4A10 and CYP4A14), although CYP4A12, a minor form, was decreased (Figure 5).
Figure 5.
Hepatic levels of CYP4A10, CYP4A12, and CYP4A14 mRNA in Cyp2e1+/– mice and Cyp2e1–/– mice fed the MCD diet or the control diet for 10 weeks. (a) Representative autoradiograph of an RNase protection assay showing the levels of β-actin, CYP4A14, and CYP4A10 mRNA in 2 Cyp2e1+/– and Cyp2e1–/– mice fed the control diet or the MCD diet. (b) Representative autoradiograph of an RNase protection assay showing the levels of β-actin and CYP4A12 mRNA in Cyp2e1+/– mice and Cyp2e1–/– mice fed the control diet or the MCD diet. (c) mRNA levels (mean ± SD; n = 4 in each group) of the 3 mouse CYP4A genes in Cyp2e1+/– mice and Cyp2e1–/– mice fed the control diet (open bars) or the MCD diet (filled bars). Bands were quantified using the PhosphorImager and ImageQuant analysis programs from Molecular Dynamics Inc., with normalization to the β-actin signal (see Methods). Note the different scale used for CYP4A12, which is expressed at very low levels compared with CYP4A10 and CYP4A14. AP < 0.001 and BP < 0.05 compared with controls. Cont, control.
To establish whether CYP4A enzymes might be involved in the generation of lipid peroxides in Cyp2e1–/– mice, we analyzed the effects of anti-mouse CYP4A10 and CYP4A12 antibodies on NADPH-dependent lipid peroxidase activity in microsomal fractions. Significant and substantial immunoinhibition of TBARs production was observed using the anti-CYP4A10 antibody (Table 4). This antibody had only minor effects in microsomes from Cyp2e1+/– mice. No significant effect was noted using the CYP4A12 antiserum (Table 4). Given the lack of information regarding the specificity of immunoinhibition by the antibody, this observation is not conclusive, but is consistent with the low expression level of this isoform and the finding that it was not upregulated by dietary manipulation (Figure 5).
Discussion
The purpose of this study was to determine whether hepatic CYP2E1 is responsible for catalyzing injurious peroxidative pathways involved in the pathogenesis of NASH, and if so, to establish whether upregulation of CYP2E1 associated with NASH is an essential step in the development of this disease. With use of the MCD dietary model, mice rapidly and consistently developed a severe form of steatohepatitis. The characteristic pathology of steatosis, mixed cell inflammatory infiltrate, hepatocellular necrosis, and eventual pericellular fibrosis mimics that found in humans with NASH. In addition, the elevated serum ALT concentrations indicate that the hepatic inflammatory process observed histologically in the MCD diet–fed mice was associated with hepatocellular injury.
The first important finding was that this form of NASH was associated with a dramatic increase in total lipid peroxides in the liver. This was consistent with the hypothesis that the necroinflammatory lesions might result from (or cause) oxidative stress. Several studies have indicated that lipid peroxidation products are important factors in the development of alcoholic liver disease, a condition that histologically resembles NASH (1, 15, 36, 37). Furthermore, there is increasing evidence that CYP2E1, a microsomal enzyme that is highly inducible by ethanol, plays a key role in the pathogenesis of alcoholic liver disease with its ability to initiate oxidative stress (19, 20, 24, 38–40). It was therefore interesting that, as previously described in rats (14) and in humans with NASH (25), hepatic CYP2E1 was upregulated in the murine model of NASH. This induction occurred through a pretranslational mechanism and resulted in the overexpression of catalytically active CYP2E1 protein, as assessed by chlorzoxazone 6-hydroxylase activity.
To determine whether the increased expression of CYP2E1 could be involved in generating the oxidative stress observed in the murine model of NASH, we measured microsomal NADPH-dependent lipid peroxidation. This activity was dramatically increased in animals with NASH compared with controls. Furthermore, lipid peroxidation was substantially inhibited by DETC (at a concentration that significantly inhibits CYP2E1-related chlorzoxazone activity). The use of specific CYP2E1 antiserum confirmed the predominant participation of CYP2E1 in this process. The anti-CYP2E1 antibody abolished 89% of NADPH-dependent lipid peroxidase activity in microsomes from C57BL6/J mice fed the MCD diet, and 66% in the Cyp2e1+/– strain. These findings implicate CYP2E1 as a catalyst for hepatic lipid peroxidation in these animals, and link the increased microsomal lipid peroxidation seen in this model of NASH with the upregulation of CYP2E1. It is important to note that like NASH in humans, this dietary mouse model is associated not only with increased CYP2E1 expression but also with increased hepatic storage of triglycerides, which provides a reservoir of substrate for lipid peroxidation. Interestingly, in humans, more severe NASH is observed in the context of rapid weight loss and noninsulin-dependent diabetes mellitus, both conditions that are characterized by increased CYP2E1 expression and increased mobilization of FFAs within the liver (8). Thus, the constellation of findings noted in C57BL6/J mice fed the MCD diet includes florid steatohepatitis, increased total hepatic triglycerides, high levels of lipoperoxides, overexpression of CYP2E1, and enhanced CYP2E1-catalyzed production of lipid peroxides by hepatic microsomes.
Clearly, all these observations are consistent with a mechanism whereby CYP2E1, induced by the dietary regimen, can act as an initiator of oxidative stress in a steatotic liver. However, it does not prove that this enzyme is an essential requirement for the production of this pattern of liver injury. We therefore used Cyp2e1–/– mice to further investigate the involvement of CYP2E1 in the pathogenesis of NASH. Despite the lack of CYP2E1 protein, when Cyp2e1–/– mice were fed the MCD diet they also developed severe steatohepatitis that was histologically similar to that observed in heterozygous control mice expressing 1 allele of the Cyp2e1 gene. Consistent with the histological findings, we also observed increased serum ALT levels and a dramatic increase in total hepatic lipid peroxides in MCD diet–fed Cyp2e1–/– mice, just as in Cyp2e1+/– mice fed the same diet. Moreover, microsomal NADPH-dependent lipid peroxidation was increased to a similar extent in both strains of mice. These results show unequivocally that CYP2E1 is not the only catalyst of microsomal lipid peroxidation during the development of steatohepatitis.
In hepatic microsomes, NADPH-dependent reduction of oxygen leading to lipid peroxidation is catalyzed predominantly by CYP2E1, but other forms of P450 can also act as catalysts to a certain extent (23, 24, 40). It is also possible that P450 enzymes produce TBARs by direct peroxidase activity (19). We therefore considered the possibility that another microsomal enzyme was responsible for the initiation of lipid peroxidation in Cyp2e1–/– mice. In Cyp2e1–/– mice, but not in Cyp2e1+/– mice, feeding the MCD diet increased expression of the 2 major CYP4A isoforms, CYP4A10 and CYP4A14. In contrast, the protein levels of CYP1A and CYP3A were not altered. Like CYP2E1, CYP4A enzymes are fatty acid hydroxylases. Together with CYP2E1, they play an important role in the metabolism of various endogenous lipid substrates such as fatty acids and arachidonic acid (20, 41). It has been suggested that CYP4A enzymes could catalyze the production of active oxygen and lipid peroxides during peroxisome proliferation (42). Moreover, CYP4A genes are coregulated with other genes that encode proteins involved in fatty acid β-oxidation (e.g., acetyl CoA oxidase and ketothiolase) and transport (liver fatty acid–binding protein and acyl-CoA–binding protein). It is therefore clear that CYP4A proteins are key intermediaries in an adaptive response to perturbation of hepatic lipid metabolism (43–46). Consequently, the upregulation of CYP4A we have observed in MCD diet–fed Cyp2e1–/– mice could be a physiological response in the unusual context of aberrant lipid accumulation and absence of CYP2E1 activity. Therefore, we conducted additional experiments to establish whether these CYP4A proteins could also mediate NADPH-dependent lipid peroxidation. The specific anti-mouse CYP4A10 antibody significantly inhibited NADPH-dependent lipid peroxidation both in microsomes prepared from Cyp2e1–/– mice fed the control diet (45% inhibition), and to a greater extent in microsomes from animals fed the MCD diet (65% inhibition). The difference in the immunoinhibition levels between these groups is consistent with the higher expression of CYP4A10 in MCD diet–fed mice. However, this antibody had only a minor effect in microsomes from mice expressing CYP2E1. These results demonstrate that, in this in vitro system, CYP4A10 can effectively mediate NADPH-dependent lipid peroxidation, but only as an alternative pathway that is recruited in the absence of CYP2E1.
Taken together, the results of this study conclusively demonstrate that the dietary model of NASH is associated with oxidative stress and lipid peroxidation in the liver. This process can lead to membrane damage and cellular injury (47). In addition, the end-products of lipid peroxidation are potent chemoattractants for inflammatory cells (21); they can also activate hepatic stellate cells and hence stimulate hepatic fibrosis (22). Our data provide the first direct evidence that CYP2E1 is the major enzyme responsible for microsomal lipid peroxidation in NASH. This further strengthens the potential mechanistic link between upregulation of CYP2E1 and steatohepatitis. Nevertheless, we have shown that CYP2E1 is not an absolute requirement for the development of NASH, because in its absence, the MCD diet still provoked microsomal lipid peroxidation and led to the development of NASH.
The most interesting novel finding of this work is the identification, on the basis of in vitro studies, of CYP4A enzymes as alternative catalysts for the microsomal oxidative stress that is operative in the absence of CYP2E1. This pathway is not effective in generating lipoperoxides when CYP2E1 is expressed, probably because of the relative abundance and prominent capacity of this enzyme for lipid peroxidation. Similar observations regarding CYP2E1 in the context of early alcohol-induced liver injury have been recently reported by Kono et al. (48), suggesting a replacement of CYP2E1 function, although CYP4A proteins were not studied in this work. The role of CYP4A enzymes in mediating deleterious lipid peroxidation in vivo remains to be established.
One implication of the redundancy in expression of microsomal enzymes involved in the management of lipid stores during increased load of hepatic triglycerides is that targeting individual enzymes may not ablate lipoperoxide production in NASH. Further studies are required to clarify the role of the intrahepatic pool of peroxidizable lipids and the cellular defense mechanisms against oxidative stress in the initiation and evolution of NASH, particularly because this information may provide the basis for designing rational strategies for therapy in this common disorder.
Acknowledgments
G.R. Robertson is a recipient of Australian National Health and Medical Research Council project grant 980065. G.C. Farrell is the Robert W. Storr Professor of Hepatic Medicine at the University of Sydney. The authors gratefully acknowledge Sandra Bierach for expert assistance in animal experimentation and Pauline Hall (Department of Anatomical Pathology, University of Cape Town, Cape Town, South Africa) for her constructive review of the hepatic pathology.
References
- 1.Ludwig J, Viggiano TR, McGill DB, Oh BJ. Nonalcoholic steatohepatitis: Mayo Clinic experiences with a hitherto unnamed disease. Mayo Clin Proc. 1980;55:434–438. [PubMed] [Google Scholar]
- 2.Diehl AM, Goodman Z, Ishak KG. Alcohollike liver disease in nonalcoholics. A clinical and histologic comparison with alcohol-induced liver injury. Gastroenterology. 1988;95:1056–1062. [PubMed] [Google Scholar]
- 3.Powell EE, et al. The natural history of nonalcoholic steatohepatitis: a follow-up study of forty-two patients for up to 21 years. Hepatology. 1990;11:74–80. doi: 10.1002/hep.1840110114. [DOI] [PubMed] [Google Scholar]
- 4.Burt AD, Mutton A, Day CP. Diagnosis and interpretation of steatosis and steatohepatitis. Semin Diagn Pathol. 1998;15:246–258. [PubMed] [Google Scholar]
- 5.James OFW, Day CP. Non-alcoholic steatohepatitis (NASH): a disease of emerging identity and importance. J Hepatol. 1998;29:495–501. doi: 10.1016/s0168-8278(98)80073-1. [DOI] [PubMed] [Google Scholar]
- 6.Sheth SG, Gordon FD, Chopra S. Nonalcoholic steatohepatitis. Ann Intern Med. 1997;126:137–145. doi: 10.7326/0003-4819-126-2-199701150-00008. [DOI] [PubMed] [Google Scholar]
- 7.Teli MR, James OF, Burt AD, Bennett MK, Day CP. The natural history of nonalcoholic fatty liver. Hepatology. 1995;22:1714–1719. [PubMed] [Google Scholar]
- 8.Day CP, Yeaman SJ. The biochemistry of alcohol-induced fatty liver. Biochem Biophys Acta. 1994;1215:33–48. doi: 10.1016/0005-2760(94)90089-2. [DOI] [PubMed] [Google Scholar]
- 9.Matteoni CA, et al. Nonalcoholic fatty liver disease: a spectrum of clinical and pathological severity. Gastroenterology. 1999;116:1413–1419. doi: 10.1016/s0016-5085(99)70506-8. [DOI] [PubMed] [Google Scholar]
- 10.Day CP, James OFW. Steatohepatitis: a tale of two “hits”? Gastroenterology. 1998;114:842–844. doi: 10.1016/s0016-5085(98)70599-2. [DOI] [PubMed] [Google Scholar]
- 11.Day CP, James OFW. Hepatic steatosis: innocent bystander or guilty party? Hepatology. 1998;27:1463–1466. doi: 10.1002/hep.510270601. [DOI] [PubMed] [Google Scholar]
- 12.Letteron P, Fromenty B, Terris B, Degott C, Pessayre D. Acute and chronic hepatitic steatosis lead to in vivo lipid peroxidation in mice. J Hepatol. 1996;24:200–208. doi: 10.1016/s0168-8278(96)80030-4. [DOI] [PubMed] [Google Scholar]
- 13.Fromenty B, Berson A, Pessayre D. Microvesicular steatosis and steatohepatitis: role of mitochondrial dysfunction and lipid peroxidation. J Hepatol. 1997;26(Suppl. 1):13–22. doi: 10.1016/s0168-8278(97)82328-8. [DOI] [PubMed] [Google Scholar]
- 14.Weltman MD, Farrell GC, Liddle C. Increased hepatocyte CYP2E1 expression in a rat nutritional model of hepatic steatosis with inflammation. Gastroenterology. 1996;111:1645–1653. doi: 10.1016/s0016-5085(96)70028-8. [DOI] [PubMed] [Google Scholar]
- 15.Yang SQ, Lin HZ, Lane MD, Clemens M, Diehl AM. Obesity increases sensitivity to endotoxin liver injury: implications for the pathogenesis of steatohepatitis. Proc Natl Acad Sci USA. 1997;94:2557–2562. doi: 10.1073/pnas.94.6.2557. [DOI] [PMC free article] [PubMed] [Google Scholar]
- 16.Lieber CS. Cytochrome P-4502E1: its physiological and pathological role. Physiol Rev. 1997;77:517–544. doi: 10.1152/physrev.1997.77.2.517. [DOI] [PubMed] [Google Scholar]
- 17.Lieber CS, Leo MA, Aleynik SI, Aleynik MK, DeCarli LM. Polyenylphosphatidylcholine decreases alcohol-induced oxidative stress in the baboon. Alcohol Clin Exp Res. 1997;21:375–379. [PubMed] [Google Scholar]
- 18.Lieber CS, et al. Phosphatidylcholine protects against fibrosis and cirrhosis in the baboon. Gastroenterology. 1994;106:152–159. doi: 10.1016/s0016-5085(94)95023-7. [DOI] [PubMed] [Google Scholar]
- 19.Ekström G, Ingelman-Sundberg M. Rat liver microsomal NADPH-supported oxidase activity and lipid peroxidation dependent on ethanol-inducible cytochrome P-450 (P-450IIE1) Biochem Pharmacol. 1989;38:1313–1319. doi: 10.1016/0006-2952(89)90338-9. [DOI] [PubMed] [Google Scholar]
- 20.Ronis, M.J.J., Lindros, K.O., and Ingelman-Sundberg, M. 1996. The CYP2E1 family. In Cytochrome P-450: metabolic and toxicological aspects. C. Ioannides, editor. CRC Press. Boca Raton, FL. 211–239.
- 21.Curzio M, Esterbauer H, Dianzani MU. Possible role of aldehydic lipid peroxidation products as chemoattractants. Int J Tissue React. 1987;9:295–306. [PubMed] [Google Scholar]
- 22.Lee KS, Buck M, Houglum K, Chojkier M. Activation of hepatic stellate cells by TGF alpha and collagen type I is mediated by oxidative stress through c-myb expression. J Clin Invest. 1995;96:2461–2468. doi: 10.1172/JCI118304. [DOI] [PMC free article] [PubMed] [Google Scholar]
- 23.Gorsky LD, Koop DR, Conn MJ. On the stoichiometry of the oxidase and monooxygenase reactions catalyzed by liver microsomal cytochrome P-450. Products of oxygen reduction. J Biol Chem. 1984;259:6812–6817. [PubMed] [Google Scholar]
- 24.Dai Y, Rashba-Step J, Cederbaum AI. Stable expression of human cytochrome P4502E1 in HepG2 cells: characterization of catalytic activities and production of reactive oxygen intermediates. Biochemistry. 1993;32:6928–6937. doi: 10.1021/bi00078a017. [DOI] [PubMed] [Google Scholar]
- 25.Weltman MD, Farrell GC, Hall P, Ingelman-Sundberg M, Liddle C. Hepatic cytochrome P450 2E1 is increased in patients with nonalcoholic steatohepatitis. Hepatology. 1998;27:128–133. doi: 10.1002/hep.510270121. [DOI] [PubMed] [Google Scholar]
- 26.Bligh EG, Dyer WJ. A rapid method of total lipid extraction and purification. Canadian Journal of Biochemistry and Physiology. 1959;37:911–917. doi: 10.1139/o59-099. [DOI] [PubMed] [Google Scholar]
- 27.Tietz. N. 1976. Total lipids. In Fundamentals of clinical chemistry. N. Teitz, editor. W.B. Saunders Co. Philadelphia. 492–494.
- 28.Ohkawa H, Ohishi N, Yagi K. Assay for lipid peroxides in animal tissues by thiobarbituric acid reaction. Anal Biochem. 1979;95:351–358. doi: 10.1016/0003-2697(79)90738-3. [DOI] [PubMed] [Google Scholar]
- 29.Murray M, Zaluzny L, Farrell GC. Drug metabolism in cirrhosis. Selective changes in cytochrome P-450 isoenzymes in the choline-deficient rat model. Biochem Pharmacol. 1986;35:1817–1824. doi: 10.1016/0006-2952(86)90298-4. [DOI] [PubMed] [Google Scholar]
- 30.Lowry OH, Rosebrough NJ, Farr AL, Randall RJ. Protein measurement by the Folin phenol reagent. J Biol Chem. 1951;193:265–276. [PubMed] [Google Scholar]
- 31.Leclercq I, Horsmans Y, Desager JP. Estimation of chlorzoxazone hydroxylase activity in liver microsomes and of the plasma pharmacokinetic of chlorzoxazone by the same high-performance liquid chromatographic method. J Chromatogr A. 1998;828:291–296. doi: 10.1016/s0021-9673(98)00588-3. [DOI] [PubMed] [Google Scholar]
- 32.Heng YM, et al. A novel murine P-450 gene, Cyp4a14, is part of a cluster of Cyp4a and Cyp4b, but not of CYP4F, genes in mouse and humans. Biochem J. 1997;325:741–749. doi: 10.1042/bj3250741. [DOI] [PMC free article] [PubMed] [Google Scholar]
- 33.Freeman JE, Stirling D, Russell AL, Wolf CR. cDNA sequence, deduced amino acid sequence, predicted gene structure and chemical regulation of mouse Cyp2e1. Biochem J. 1992;281:689–695. doi: 10.1042/bj2810689. [DOI] [PMC free article] [PubMed] [Google Scholar]
- 34.Gilman, M. 1993. Ribonuclease protection assay. In Current protocols in molecular biology. Volume 1. F.M. Ausubel, R. Brent, R.E. Kingston, D.D. Moore, J.G. Seidman, J.A. Smith, and K. Stuhl, editors. John Wiley and Sons, Inc. New York, NY. 4.7.1–4.7.8.
- 35.Bell DR, et al. Species-specific induction of cytochrome P-450 4A RNAs: PCR cloning of partial guinea-pig, human and mouse CYP4A cDNAs. Biochem J. 1993;294:173–180. doi: 10.1042/bj2940173. [DOI] [PMC free article] [PubMed] [Google Scholar]
- 36.Guengerich FP, Kim DH, Iwasaki M. Role of human cytochrome P-450 IIE1 in the oxidation of many low molecular weight cancer suspects. Chem Res Toxicol. 1991;4:168–179. doi: 10.1021/tx00020a008. [DOI] [PubMed] [Google Scholar]
- 37.French SW, et al. Lipid peroxidation, CYP2E1 and arachidonic acid metabolism in alcoholic liver disease in rats. J Nutr. 1997;127:907S–911S. doi: 10.1093/jn/127.5.907S. [DOI] [PubMed] [Google Scholar]
- 38.Nanji AA, et al. Marked enhanced cytochrome P450 2E1 induction and lipid peroxidation is associated with severe liver injury in fish oil-ethanol-fed rats. Alcohol Clin Exp Res. 1994;18:1280–1285. doi: 10.1111/j.1530-0277.1994.tb00119.x. [DOI] [PubMed] [Google Scholar]
- 39.Koop DR. Oxidative and reductive metabolism by cytochrome P450 2E1. FASEB J. 1992;6:724–730. doi: 10.1096/fasebj.6.2.1537462. [DOI] [PubMed] [Google Scholar]
- 40.Ingelman-Sundberg M, Johansson I. Mechanisms of hydroxyl radical formation and ethanol oxidation by ethanol-inducible and other forms of rabbit liver microsomal cytochromes P-450. J Biol Chem. 1984;259:6447–6458. [PubMed] [Google Scholar]
- 41.Chen Q, Galleano M, Cederbaum AI. Cytotoxicity and apoptosis produced by arachidonic acid in HepG2 cells overexpressing human cytochrome P4502E1. J Biol Chem. 1997;272:14532–14541. doi: 10.1074/jbc.272.23.14532. [DOI] [PubMed] [Google Scholar]
- 42.Lock EA, Mitchell AM, Elcombe CR. Biochemical mechanisms of induction of hepatic peroxisome proliferation. Annu Rev Pharmacol Toxicol. 1989;29:145–63. doi: 10.1146/annurev.pa.29.040189.001045. [DOI] [PubMed] [Google Scholar]
- 43.Kroetz DL, Yook P, Costet P, Bianchi P, Pineau T. Peroxisome proliferator-activated receptor α controls the hepatic CYP4A induction adaptative response to starvation and diabetes. J Biol Chem. 1998;273:31581–31589. doi: 10.1074/jbc.273.47.31581. [DOI] [PubMed] [Google Scholar]
- 44.Barnett CR, Gibson GG, Wolf CR, Flatt PR, Ioannides C. Induction of cytochrome P450III and P450IV family proteins in streptozotocin-induced diabetes. Biochem J. 1990;268:765–769. doi: 10.1042/bj2680765. [DOI] [PMC free article] [PubMed] [Google Scholar]
- 45.Leone TC, Weinheimer CJ, Kelly DP. A critical role for peroxisome proliferator-activated receptor α (PPARα) in the cellular fasting response: the PPARα-null mouse as a model of fatty acid oxidation disorders. Proc Natl Acad Sci USA. 1999;96:7473–7478. doi: 10.1073/pnas.96.13.7473. [DOI] [PMC free article] [PubMed] [Google Scholar]
- 46.Kersten S, et al. Peroxisome proliferator-activated receptor α mediates the adaptative response to fasting. J Clin Invest. 1999;103:1489–1498. doi: 10.1172/JCI6223. [DOI] [PMC free article] [PubMed] [Google Scholar]
- 47.Estebauer H. Cytotoxicity and genotoxicity of lipid-oxidation products. Am J Clin Nutr. 1996;57:779S–785S. doi: 10.1093/ajcn/57.5.779S. [DOI] [PubMed] [Google Scholar]
- 48.Kono H, et al. CYP2E1 is not involved in early alcohol-induced liver injury. Am J Physiol. 1999;277:G1259–G1267. doi: 10.1152/ajpgi.1999.277.6.G1259. [DOI] [PubMed] [Google Scholar]


