

Abstract
Gastrointestinal stromal tumors (GISTs) were historically grouped with leiomyosarcomas (LMSs) based on their morphological similarities, but recently they have been unequivocally established as a distinct type of sarcoma based on the molecular features and response to imatinib treatment. To gain further insight into the genomic differences between GISTs and LMSs, we mapped gene copy number aberrations (CNAs) in 42 GISTs and 30 LMSs and integrated them with gene expression profiles. Our studies revealed distinct patterns of CNAs between GISTs and LMSs. Losses in chromosomes 1p, 14q, 15q, and 22q were significantly more frequent in GISTs than in LMSs (P < 0.001), whereas losses in chromosomes 10 and 16 as well as gains in 1q, 14q, and 15q (P < 0.001) were more common in LMSs. By integrating CNAs with gene expression data and clinical information, we found several clinically relevant CNAs that were prognostic of survival in patients with GIST. Furthermore, GISTs were categorized into four groups according to an accumulating pattern of genetic alterations. Many key cellular pathways were differently expressed in the four groups and the patients had increasingly worse prognosis as the extent of genomic alterations increased. These findings lead us to propose a new tumor-progression genetic staging system termed Genomic Instability Stage (GIS) to complement the current prognostic predictive system based on tumor size, mitotic index (MI), and KIT mutation.
Keywords: imatinib, CNA, GIST, leiomyosarcoma, array CGH, survival, KIT
Introduction
Gastrointestinal stromal tumors (GISTs) were previously grouped with spindle cell and other soft-tissue sarcomas, including leiomyosarcoma (LMS) (1). But in recent years, GIST has emerged as a distinct mesenchymal tumor type that is frequently associated with a gain-of-function mutation in the KIT (80-85% of GIST) or platelet-derived growth factor-alpha (PDGFRA) gene (5-7% of GIST) (1, 2, 3). The presence of these mutations allows for targeted therapy using imatinib (Gleevec, STI-571, Novartis Pharmaceuticals, Basel, Switzerland), which has demonstrated efficacy in 60-80% of GIST patients (4). Conversely, LMSs are not associated with KIT gene mutations or overexpression and do not benefit from imatinib therapy. Treatment of LMS patients with contemporary cytotoxic chemotherapy has resulted in a 53% objective response rate, whereas GIST patients treated with traditional cytotoxic chemotherapy have not shown a measurable response (4, 5). Although mutations in KIT and PDGFRA explain why 60-80% of GIST patients initially benefit from imatinib, the duration of benefit that patients receive from this therapy remains considerably variable. Furthermore, even rarely, some patients with KIT exon 11 mutations are resistant to imatinib; and secondary mutations of KIT have been shown to occur in patients who initially responded to imatinib therapy (6). Thus, robust and biologically relevant prognostic factors, especially those for predicting survival of GIST patients, are still needed.
Growing evidence indicates that the accumulation of specific genetic alterations ultimately leads to a highly unstable genome underlying in cancer development and progression (7). Although some recurrent changes in GIST and LMS genomes have been investigated before, the deficiencies of early measurement technologies or small sample sizes used in early studies makes it necessary to further accumulate genomic information in additional samples and create a more refined map of the recurrent aberrations. Towards this goal, we conducted a comprehensive high-resolution whole-genome array comparative genomic hybridization (aCGH) analysis to map the recurrent copy number aberrations (CNAs) in GISTs and LMSs. We further investigated the clinical relevance of our results by integrative analysis of the CNAs, gene expression profiles, and patient survival information. This study lead us to propose a new tumor-progression genetic staging system termed Genomic Instability Stage (GIS) to complement the present GIST staging system that is based on tumor size, mitotic index (MI), and c-kit mutation.
Materials and Methods
Primary tumors and pathological evaluation
A total of 72 primary tumors comprised of 42 GISTs and 30 LMSs were acquired from surgical specimens during 1989-2005 at The University of Texas M. D. Anderson Cancer Center under an Institutional Review Board–approved protocol. For transcriptome analysis, high quality RNA was acquired from 32 GISTs and 25 LMSs. For genomic profiling we used these samples as well as 15 additional samples (10 GIST and 5 LMS). The diagnoses were made on the basis of clinicopathological evaluation and molecular marker studies. The clinical information is summarized in Table 1.
Table 1. Clinical information of GISTs and LMSs.
| GIST (n=42) | ||
|---|---|---|
| Category | Subcategory | Result (%) |
| Age* | Mean | 62 |
| Standard deviation | 14 | |
| Tumor size (cm) | Mean | 12.7 |
| Standard deviation | 8.8 | |
| Gender | Male | 19 (45) |
| Female | 23 (55) | |
| Primary site | Stomach | 19 (45) |
| Small Bowel | 20 (48) | |
| Large Bowel | 2 (5) | |
| Uterus | 1 (2) | |
| Disease status | Primary no metastasis | 19 (45) |
| Primary with metastasis | 7 (17) | |
| Local recurrence without metastasis | 6 (14) | |
| Recurrence metastasis | 10 (24) | |
| KIT status | Wild type | 11 (27) |
| Exon 11 mutation | 27 (64) | |
| Exon 9 mutation | 3 (7) | |
| No data | 1 (2) | |
| Gleevec-treatment | PreOp Gleevec | 25 (60) |
| No preOp Gleevec | 17 (40) | |
| Length of follow-up (months)** | Mean | 61 |
| Standard deviation | 44 | |
| LMS (n=30) | ||
| Category | Subcategory | Result (%) |
| Age | Mean | 57 |
| Standard deviation | 12 | |
| Tumor size (cm) | Mean | 15.3 |
| Standard deviation | 9.1 | |
| Gender | Male | 7 (23) |
| Female | 23 (77) | |
| Primary site | Uterus | 9 (30) |
| Retroperitoneal mass | 6 (20) | |
| Inferior vena cava | 5 (17) | |
| Other | 10 (33) | |
| Length of follow-up (months)** | Mean | 41 |
| Standard deviation | 27 | |
Age refers to patient age at which the sample was obtained;
Length of follow-up is the time between the first diagnosis and the last contact
Array experiments and preprocessing
Genomic DNA from tumors and pooled normal tissue was isolated according to standard procedure. Labeled genomic DNA was hybridized to the Agilent Human Genome CGH Microarray (4×44k) according to the manufacturer's instructions (Agilent Technologies, Palo Alto, CA). The data were extracted from microarrays with Agilent Feature Extraction software version 9.5 with default settings and were further analyzed with Matlab version R2007b and R version 2.6.2. Intensity values were lowess-normalized to compensate for common nonlinear biases. Ratios of normalized intensity values from tumor tissues and normal tissue were transformed to log2-space. Log ratio data were then subjected to a circular binary segmentation (CBS) algorithm (8) (R implementation DNA copy version 1.6.0) to reduce the effect of noise. CGHcall algorithm (9) (version 1.2.2. in R) was used for labeling the segments as lost, normal, or gained.
Gene expression data were measured by using whole human genome oligo arrays with 44K 60-mer probes (Agilent Technologies) with 500 ng of total RNA starting material according to the manufacturer's protocol. Arrays were scanned with Agilent's dual laser-based scanner. Features were extracted from arrays with use of Agilent's Feature Extraction software version 8.0. Then, the expression data were quantile normalized and is publicly available in http://www3.mdanderson.org/∼genomics/sarcoma_data_matrix_for_supplemental.zip. The aCGH data is available in http://www.cs.tut.fi/∼ylipaa/normalized_data_GIST.txt and http://www.cs.tut.fi/∼ylipaa/normalized_data_LMS.txt.
Statistical analyses
DNA sequences were classified as recurrently aberrated if the number of aberrations in individual samples exceeded a threshold of statistical significance estimated using a permutation test. The 95th percentile values were chosen as the threshold of significance. Using this procedure, we estimated that similar aberrations in at least 14 samples (33%) for GIST and 12 samples (40%) for LMS were required for a sequence to be called recurrently aberrant. Probe average recurrence (PAR) was used to quantify the aberration rate of a recurrently aberrated DNA segment. PAR is formed by averaging the aberration rate over the probes in a contiguous recurrently aberrated DNA segment. Differences in aberration frequencies between GIST and LMS were tested with Fisher's exact test for each probe independently. To account for the resulting multiple comparisons problem, the level of significance in these tests was set to 0.001. Differential expression between sample sets was determined with the Wilcoxon rank sum test with a threshold of 0.05. In finding the subgroups within the GIST samples, hierarchical clustering with inner squared linkage was applied. The most informative genes for clustering were selected by a two-tailed t-test. In estimating patient survival curves, Kaplan-Meier survival estimators were applied. A Mantel-Cox test was then used to determine the statistical significance of the difference of these survival estimators. A significance threshold of 0.05 was selected for all survival tests. A hypergeometric distribution with a significance threshold of 0.05 was used in computing gene set enrichments.
Results
GISTs and LMSs have distinct differences in their genomes
After carrying out comprehensive aCGH profiling experiments with 42 primary GISTs and 30 primary LMSs, we analyzed the recurrent CNAs in these tumors. Our analysis revealed several distinct loci throughout the genome that were frequently aberrant in GISTs (Fig. 1A) and in LMSs (Fig. 1B), similar to the reported data (10). Statistical comparisons of the inferred cancer genomes revealed that losses in chromosomes 1p, 14q, 15q, and 22q were significantly more frequent in GISTs than in LMSs (P < 0.001), whereas losses in chromosomes 10 and 16 were more common in LMSs (P < 0.001). We not only confirmed previous CNAs such as loss of 1p, 14q, 15q, and 22q (10-21), but also showed that the deletion of 22q was the most common recurrent deletion in GISTs (84% PAR), with parts of 22q deleted in more than 95% of GIST samples, significantly higher than the reported data (12, 21). In addition, although losses in 1p were commonly found in both sarcoma types, many more and much larger deletions in 1p were observed in GISTs than in LMSs. In comparison, tumors from LMS patients more frequently had gains in chromosomes 1q, 14q, and 15q (P < 0.001).
Figure 1. Signature gene copy number aberrations of GIST and LMS.
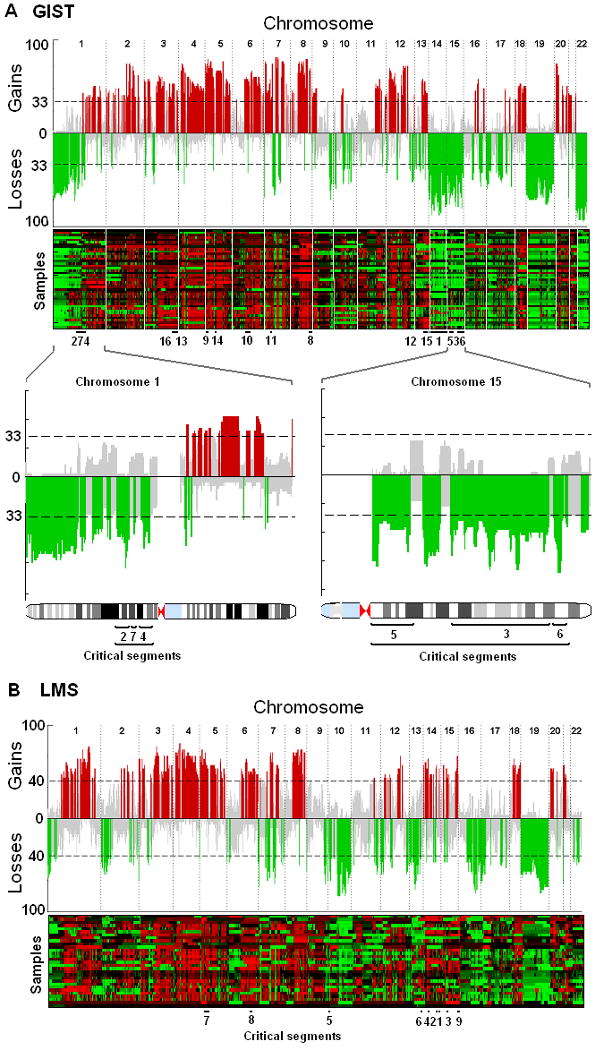
The recurrence of copy number aberrations throughout the genomes is shown both in skyline plot and heatmap for GIST (A) and LMS (B). The value on the y-axis of the skyline plot is the percentage of patients whose tumors have gains (positive axis, in red) or losses (negative axis, in green) in corresponding genomic loci. The probes are aligned evenly in chromosome order on the x-axis. The dashed line indicates the threshold for a significant number of patients whose tumors share the same aberration (14 patients for GIST). The significance threshold is computed with use of a permutation test. Recurrence rates that exceed this threshold are deemed significantly recurrent and are color-coded to emphasize the locations. Gray color represents a nonsignificant amount of aberrations in the locus. The lower panels highlight chromosomes 1 and 15, both of which contain three critical segments. Critical segments are contiguous genomic regions of recurrent aberration that harbor at least one dosage-sensitive survival-affecting gene. Details of these segments are listed in Table 2. Losses in chromosomes 1p, 14q, 15q, and 22q are markedly more common in GIST, whereas losses in 10 and 13 are more common in LMS. Gains in chromosomes 1, 14q, and 15q are defining features of LMS.
From the aberration profiles illustrated in Fig. 1, we created a gene-level map of the recurrent CNAs in GISTs and LMSs. A total of 328 recurrently aberrant segments of DNA were identified in GISTs (202 gains and 126 losses) and 373 in LMSs (194 gains and 179 losses) based on the probe average recurrence (PAR), which was defined as the average recurrence rate of the probes that were included in a segment. We matched CNAs with corresponding gene expression profiles and identified the genes whose expression significantly correlated with gene dosage. We next investigated the effect of each dosage-sensitive gene on patient survival and identified recurrent CNAs harboring at least one dosage-sensitive gene that significantly correlated with patient survival (Table 2). These clinically relevant CNA segments and the putative target genes offer a promising starting point from which functional validations can be carried out in future studies.
Table 2. Copy number aberrations that harbor at least one gene-dosage sensitive gene that is associated with poor prognosis in GIST and LMS.
| # | Chr | Locus boundary | PAR* | Cytogenetic band | Candidate genes | |||
|---|---|---|---|---|---|---|---|---|
| Start (bp) | Stop(bp) | Start | Stop | |||||
| GIST losses | ||||||||
| 1 | 14 | 19365081 | 106329840 | 65% | q11.2 | q32.33 | OXA1L | PPP2R5E |
| 2 | 1 | 84129665 | 95422234 | 53% | p31.1 | p21.3 | RWDD3 | |
| 3 | 15 | 48206991 | 84693976 | 52% | q21.2 | q25.3 | AKAP13 | C15orf5 |
| GLCE | MESDC2 | |||||||
| MTHFS | SENP8 | |||||||
| SUHW4 | USP3 | |||||||
| 4 | 1 | 106334457 | 114964386 | 49% | p21.1 | p13.2 | AMPD1 | AP4B1 |
| BCAS2 | ||||||||
| 5 | 15 | 19109154 | 33140043 | 48% | q11.2 | q14 | APBA2 | ARHGAP11A |
| KLF13 | ||||||||
| 6 | 15 | 96783935 | 99643192 | 46% | q26.3 | q26.3 | IGF1R | |
| 7 | 1 | 99947682 | 100601821 | 46% | p21.2 | p21.2 | AGL | HIAT1 |
| GIST gains | ||||||||
| 8 | 8 | 131377346 | 140782724 | 67% | q24.21 | q24.3 | DDEF1 | |
| 9 | 5 | 1492821 | 16643214 | 65% | p15.33 | p15.1 | DNAH5 | FBXL7 |
| 10 | 6 | 44466155 | 73840214 | 54% | p21.1 | q13 | HMGCLL1 | |
| 11 | 7 | 36220617 | 39454216 | 51% | p14.2 | p14.1 | VPS41 | |
| 12 | 13 | 52523853 | 72250500 | 49% | q21.1 | q22.1 | TDRD3 | |
| 13 | 3 | 157321066 | 170967793 | 47% | q25.31 | q26.2 | CCNL1 | VEPH1 |
| 14 | 5 | 71052382 | 72832629 | 46% | q13.2 | q13.2 | MAP1B | |
| 15 | 13 | 73160881 | 93888882 | 46% | q22.1 | q32.1 | C13orf7 | |
| 16 | 3 | 143995402 | 156589223 | 41% | q23 | q25.31 | P2RY1 | SMARCA3 |
| LMS losses | ||||||||
| 1 | 14 | 76889274 | 77394297 | 46% | q24.3 | q24.3 | C14orf133 | C14orf156 |
| 2 | 14 | 72470216 | 73993089 | 46% | q24.2 | q24.3 | C14orf168 | PSEN1 |
| ZADH1 | ZFYVE1 | |||||||
| ZNF410 | ||||||||
| 3 | 15 | 48417864 | 48815590 | 46% | q21.2 | q21.2 | SPPL2A | USP8 |
| 4 | 14 | 33942779 | 34940779 | 44% | q13.1 | q13.2 | C14orf10 | C14orf24 |
| 5 | 10 | 5878820 | 6526558 | 43% | p15.1 | p15.1 | FBXO18 | PFKFB3 |
| RBM17 | ||||||||
| 6 | 13 | 97404021 | 99434703 | 43% | q32.2 | q32.3 | CLYBL | STK24 |
| TM9SF2 | ||||||||
| LMS gains | ||||||||
| 7 | 5 | 17766514 | 31520799 | 69% | p15.1 | p13.3 | CDH12 | |
| 8 | 6 | 90704743 | 99500862 | 59% | q15 | q16.2 | FBXL4 | |
| 9 | 15 | 89596628 | 100168689 | 55% | q26.1 | q26.3 | MEF2A | |
PAR stands for Probe average recurrence, which is the mean aberration rate of all the probes that belong to that segment
Genomic Instability Stage (GIS) may prove to be a valuable prognostic system for GISTs
We carried out a clustering analysis in an attempt to identify clinically relevant subgroups that are defined by chromosome-level CNAs. In contrast to LMS, which did not cluster well into clear genomic subtypes, GIST aberration profiles revealed four distinct groups with varying degrees of genetic alterations (n1 = 12, n2 = 8, n3 = 12, n4 =10) (Fig. 2A). A survival analysis of these groups showed that patient survival is increasingly worse as more and more genomic aberrations take place (Fig. 2B). All of the four groups featured partial losses in distal 1p, 19, and 22q which suggested that these deletions must be early events in GIST development. The defining chromosome-scale difference between group 1 (with the least amount of aberrations) and group 2 (with slightly more aberrations than group 1) was the added deletion of chromosome 14q in group 2. Patients with tumors classified in groups 1 or 2 have a significantly longer survival rate (Fig. 2C) than those with a tumor in group 3 or group 4 (which feature more aberrations than the tumors in previous groups). Group 3 harbored the same aberrations that characterized groups 1 and 2 but also an additional deletion of chromosome 15q and the proximal part of chromosome 1p. Tumors in group 4 were distinguished from group 3 by the additional loss of chromosome 10. Although group 4 retains the characteristics of the first three groups, it also contains a more diverse set of tumors, which is seen as a more heterogeneous pattern of CNAs compared with the other three groups. This is reflected also in the survival estimator, which falls between the first two groups and the third group.
Figure 2. Subtypes of GISTs by chromosomal aberrations.
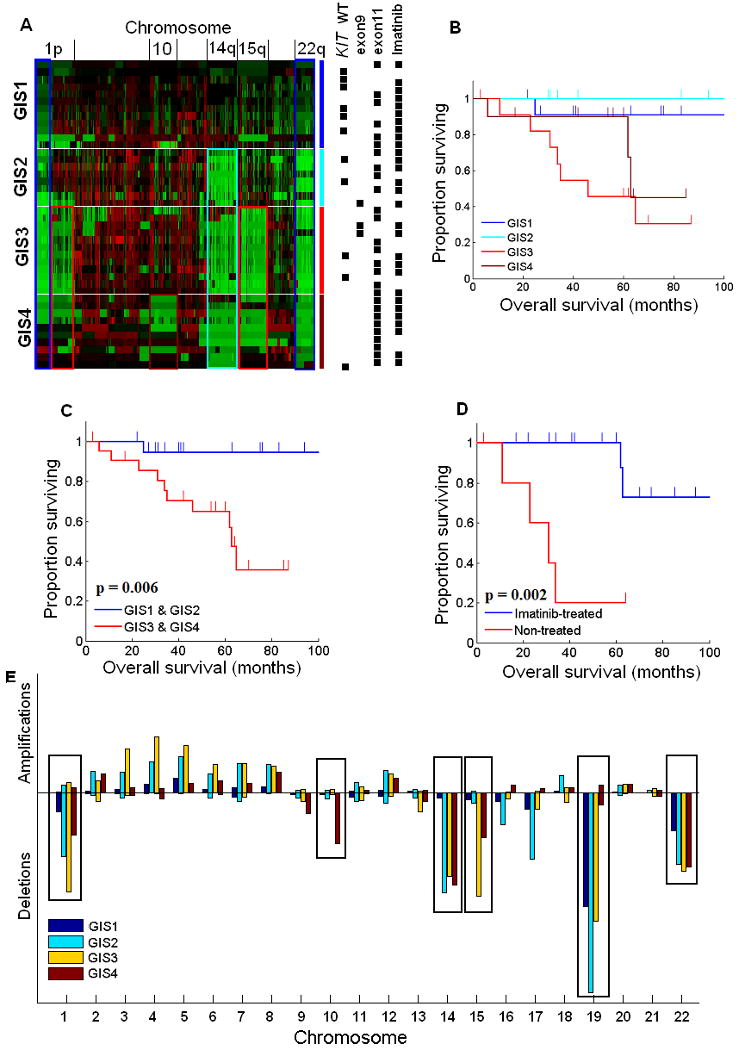
A, Hierarchical clustering of copy number data reveals four subtypes of GIST (Genomic Instability Stage [GIS] 1-4). Green color indicates losses and red indicates gains. Locations of the key chromosomes are indicated on the top of the heatmap. On the right, the four groups identified by hierarchical clustering are shown with blue (GIS1, n=12), light blue (GIS2, n=8), red (GIS3, n=12), and dark red (GIS4, n=10). The same colors highlight the most distinct aberrations in each group that are visible in the heatmap, in which the main characteristics of group 1 are the losses of distal 1p and 22q; group 2 has losses of distal 1p, 22q, and an additional loss of chromosome 14q; group 3 has losses of 1p, 22q, 14q, and further features a loss of 15q; group 4, although more heterogeneous, is characterized by losses of 1p, 22q, 14q, 15q, and loss of chromosome 10. Black boxes on the right side of the heatmap illustrate some of the known survival-affecting characteristics of individual tumors. B, Kaplan-Meier survival estimators for each group. C, Patients with late-stage GIST (GIS3 and GIS4; n = 22), according to our hypothesis, have a significantly worse prognosis (P = 0.006) than do patients with early-stage GIST (GIS1 and GIS2; n = 20). D, Although KIT exon 9 and 11 mutations and imatinib treatment significantly affect survival, they are distributed among all four groups, thus not affecting the survival estimate of any one group significantly more than another. E, Aberration prevalence is plotted for each GIST subtype and chromosome. The heights of the boxes are computed as the square of the amount of aberrant probes divided by the total amount of probes in the chromosome. It emphasizes both the relative size of aberrations with respect to the length of the chromosome and the total amount of aberrated loci. This procedure is needed for illustrating the importance of both completely aberrant small chromosomes and partially aberrant large chromosomes in the same scale. The plot illustrates the sequential nature of chromosome-scale aberrations in the four GIST subtypes, which is shown best in the highlighted chromosomes but is also visible, for example, in the increased amplification of chromosomes 3, 4, 5, and 6. The overall lower aberration prevalence in GIS4 is explained by the higher genomic heterogeneity within that group.
These results lead us to propose a new tumor-progression genetic staging system termed Genomic Instability Stage (GIS) to complement the present prognostic staging system of GIST based on tumor size, mitotic index (MI), and KIT mutation. Although we did not have MI information for all the cases we have studied, we did have sequencing data on the KIT and PDGFRA gene mutations (Fig. 2A). This allowed us to investigate the relationship between the mutation of these genes, especially KIT, and genomic instability manifested by the accumulation of CNAs. High mutation rate of KIT exon 11 in groups 1 and 2 suggested that KIT mutation is an early event in GIST, which is consistent with its role as a driver oncogene. Increased KIT mutation frequency was seen in groups 3 and 4, and this observation is consistent with reports that secondary mutations of KIT occur at later stages in GIST progression (6). Imatinib-treated patients with mutations in KIT exon 11 survived significantly longer than did the patients with the same mutation who were not treated with imatinib in a group-independent manner (Fig. 2D; P = 0.002), suggesting that the differences in genomic survival estimators are not significantly affected by neither imatinib treatment or KIT mutations. Furthermore, other common risk-assessment and clinical parameters such as patient age, tumor size, gender, primary site and the presence of metastases did not significantly correlate with the groups. Due to the lack of data on mitotic indices we were unable to fully compare the existing risk assessment system (4) with the genomic stages. Further prospective characterization of these genomic profiles coupled with full risk assessment (2007 NCCN guidelines) and clinical outcome is needed to validate this proposed model.
The incremental occurrence of the observed CNA patterns, increasing KIT mutations, and independence from clinical parameters other than survival suggested that the four stages reflect progressive accumulation of chromosome-scale genetic abnormalities during GIST progression. We further confirmed the sequential nature of the chromosome-scale events by determining which aberrations are the most prominent in each stage. This analysis clearly revealed that losses of 1p, 14q, 15q, 19, and 22q are the most distinct events in the four groups, although many smaller-scale events may play a critical role in GIST progression as well (Fig. 2E). Notably, the prominence of less aberrated chromosomes also increased from the first stage to the third, as seen in the amplifications of chromosomes 3, 4, 5, and 6. The dosage-sensitive genes in critical segments were also found to change their expression in a corresponding manner between the hypothesized GIS stages (Fig. 3A-D). We could clearly observe the copy number change of the chromosomes that harbor the genes from their expression rates, such as loss of 15q for AKAP13 and C15orf5, loss of 14q for OXA1L, and gains in 3q for SMARCA3. As genes that significantly affect survival, these possible target genes may also be ultimately responsible for the worse outcome seen in patients in groups 3 and 4.
Figure 3. Sequential chromosomal aberrations correlate with gene expression in survival-critical genes.
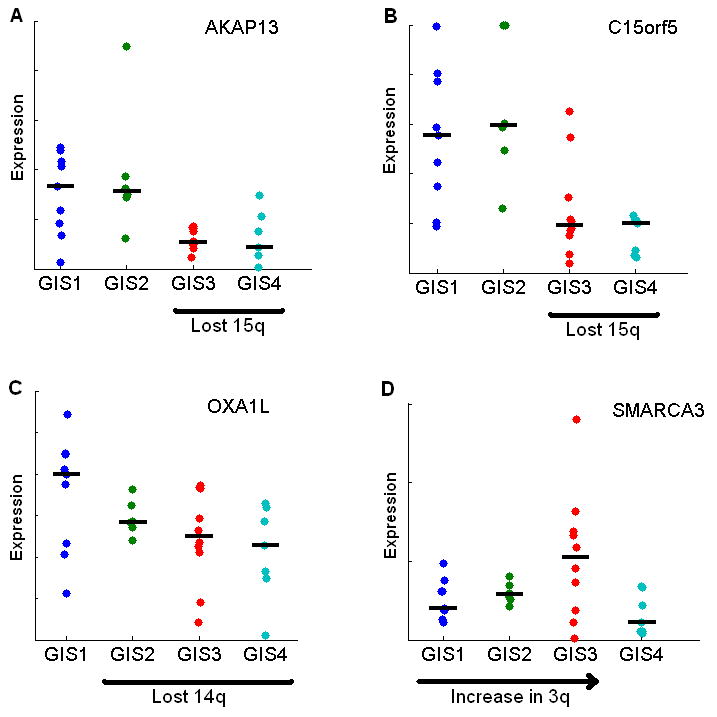
A and B, The stepwise loss of chromosome 15q, where AKAP13 and C15orf5 are located, is reflected also in lower median gene expression in GIS3 and GIS4. C, OXA1L exhibits clear gene dosage effect according to lost chromosome 14q in GIS2-4. D, Although amplifications affected gene expression less than deletions, SMARCA3 expression shows a similar pattern as chromosome 3 in panel E of Fig. 2. All four genes are recurrently aberrated and affect survival significantly.
Different cellular pathways are altered in GISTs with different Genomic Instability Stages
The genes that were expressed differently between two adjacent GIS groups were used in an enrichment analysis that aimed at finding the biological processes that were significantly altered during the progression from one stage to the next. We used the list of biological processes in the Gene Ontology database (23) as our reference. Differences in genome level translate into several distinct cancer-related processes at the transcriptome level (Fig. 4). The changes from GIS1 to GIS2 impaired mainly apoptotic, DNA repair, and damage-response pathways, whereas the progression from GIS2 to GIS3 affected mitotic, cell cycle, and growth pathways. The final transition from GIS3 to GIS4 had substantially more gene expression differences, most notably in cell-cell adhesion and chromosomal organization pathways.
Figure 4. Key changes in genome level confer changes in transcriptome level.
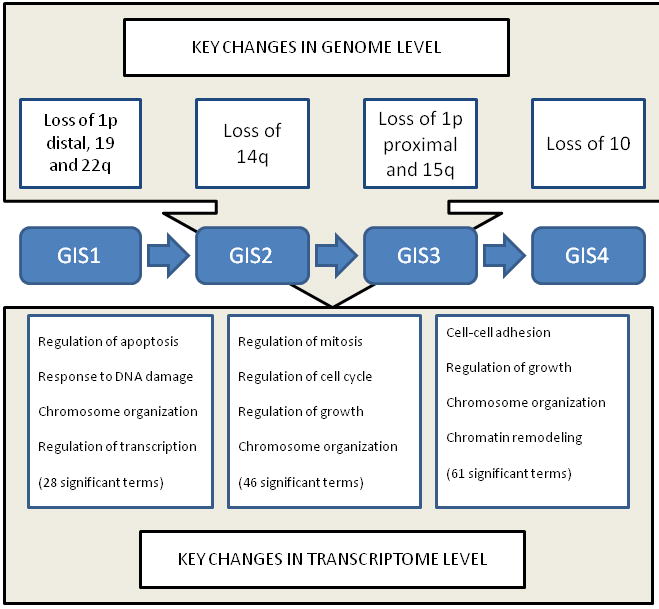
The most prominent copy number changes that characterize the four stages are shown on the top of the figure. These and smaller-scale aberrations convey various tumor-promoting properties to the cell by disrupting key biochemical pathways and biological processes. The transition from GIS1 to GIS2 is characterzed by altered antiapoptotic processes and DNA repair as well as chromosomal organization and regulation of transcription. Mitotic, cell cycle, and growth terms were abundant in the transition from GIS2 to GIS3. The list of altered processes in the last transition was longer and more diverse than the previous, probably due to the fact that group 4 is the most heterogeneous. Chromosomal changes, growth, and cell-cell adhesion were among the most relevant cancer-related processes.
Discussion
Recent progress in cancer genomics highlighted by the advancement of the Cancer Genome Atlas program has shown that comprehensive genomic characterization of a large number of cancer samples is highly valuable in fully understanding the molecular basis for human cancer and for classifying cancer into clinically meaningful subtypes (24, 25). In this study, we carried out an integrated analysis of high-resolution genomic maps, gene expression data, and clinical information of GIST and LMS. Our genomic analysis provided further evidence that GISTs are distinct from LMS at genomic levels and pointed out the exact chromosomal locations of the greatest difference and similarity. Most importantly though, our analysis provided a genomic view for the progression of GIST and that staging by specific genomic alteration may offer a clinically meaningful system for prognosis for GIST even in the patients who receive imatinib therapy.
Although a number of previous studies have profiled genomic alterations in GISTs and LMSs using different generations of technologies and relatively small sample cohorts, a key aspect for the present analysis is the correlation of genomic alterations with gene expression data and clinical information. Using this integrative approach we were able to pinpoint clinically relevant copy number aberrations from the vast amount of biologically irrelevant aberrations. Whereas simple mapping of recurrently aberrant genes can yield hundreds or thousands of clinically irrelevant passenger genes, the clinically relevant genomic segments (critical segments) that were uncovered here provide a reasonable amount of putative targets for future validation studies.
Our integrated analysis also led us to a new appreciation for the genetic basis of the progression of GISTs. Pattern recognition analysis of the genomic alteration revealed that there is an obvious incremental accumulation of gene copy number alterations in GIST. As a result, we propose a new tumor-progression genetic staging system, Genomic Instability Staging or GIS, to complement the standard tumor site, size, and proliferation risk-assessment system (4). Under the GIS staging system, deletions of distal 1p, 19, and 22q are likely the key early chromosome-scale events that may have triggered the transformation from normal tissue to GIS1 tumor. Whether these events occur before or after KIT mutation is not apparent from our data, since KIT mutation is a high-frequency event in every GIS stage. The most distinct event that follows these deletions is the deletion of 14q, which can clearly be seen as the defining feature in GIS2. Further key deletions of proximal 1p, 15q mark the disease stage GIS3. Loss of chromosome 10, which has also been associated with late stage in many solid tumors (26), defines the final stage, GIS4. Our GISs are consistent with the previous reported data (21, 22), but provide more specific information in the key aberrant events. Lack of significant difference in KIT and PDGFA mutations as well as imatinib response in different GIS groups showed that GIS system may have independent prognostic values for GISTs.
Our pathway analysis provides additional insight into the process of tumorigenesis in which early-stage GISTs (GIS1 to GIS2) evade apoptosis, intermediate-stage GISTs (GIS2 to GIS3) undergo accelerated proliferation, and late-stage GISTs (GIS3 to GIS4) lose their dependence on cell adhesion, allowing invasion and metastasis. These different key pathways aberrations in different GISs validate the accumulative progressive character of GISTs. We think that these findings are compelling but functionally confirming them would require a much larger study. We should also point out that although we did not observe similar findings for LMSs, this may only mean LMSs are a more heterogeneous disease and a larger sample size would be needed to reveal key signatures that underlie disease progression and prognosis.
Acknowledgments
We thank Drs. Bogdan Czerniak, Jean-Pierre Issa, and Janet Bruner for their critical review of this manuscript and valuable comments. We also want to thank David Cogdell and Limei Hu for performing the microarray experiments and Drs. Robert Benjamin, Olli Yli-Harja, and Ilya Shmulevich for their significant contribution to the experimental design and interpretation of the results. We also thank Ms. Tamara Locke of the Department of Scientific Publications at M. D. Anderson Cancer Center for editing this manuscript.
Financial support: This study was supported by an NIH R01 CA098570 grant (WZ), an NIH Career Development Award (JT), Commonwealth Foundation for Cancer Research grant (WZ and JT), Academy of Finland Projects 213462 and 122973 (AY, MN), and National Natural Science Foundation of China (30901715/C171002, to JY). This research is supported in part by the National Institutes of Health through M. D. Anderson's Cancer Center Support Grant CA016672.
References
- 1.Price ND, Trent J, El-Naggar AK, et al. Highly accurate two-gene classifier for differentiating gastrointestinal stromal tumors and leiomyosarcomas. Proc Natl Acad Sci U S A. 2007;104:3414–19. doi: 10.1073/pnas.0611373104. [DOI] [PMC free article] [PubMed] [Google Scholar]
- 2.Heinrich MC, Corless CL, Duensing A, et al. PDGFRA activating mutations in gastrointestinal stromal tumors. Science. 2003;299:708–10. doi: 10.1126/science.1079666. [DOI] [PubMed] [Google Scholar]
- 3.Demetri GD, Benjamin RS, Blanke CD, et al. NCCN Task Force report: management of patients with gastrointestinal stromal tumor (GIST)--update of the NCCN clinical practice guidelines. J Natl Compr Canc Netw. 2007;5 2:S1–29. [PubMed] [Google Scholar]
- 4.Joensuu H. Gastrointestinal stromal tumor (GIST) Ann Oncol. 2006;17 10:x280–6. doi: 10.1093/annonc/mdl274. [DOI] [PubMed] [Google Scholar]
- 5.Hensley ML, Maki R, Venkatraman E, et al. Gemcitabine and docetaxel in patients with unresectable leiomyosarcoma: results of a phase II trial. J Clin Oncol. 2002;20:2824–31. doi: 10.1200/JCO.2002.11.050. [DOI] [PubMed] [Google Scholar]
- 6.Chen LL, Trent JC, Wu EF, et al. A missense mutation in KIT kinase domain 1 correlates with imatinib resistance in gastrointestinal stromal tumors. Cancer Res. 2004;64:5913–9. doi: 10.1158/0008-5472.CAN-04-0085. [DOI] [PubMed] [Google Scholar]
- 7.Fearon ER, Vogelstein B. A genetic model for colorectal tumorigenesis. Cell. 1990;61:759–67. doi: 10.1016/0092-8674(90)90186-i. [DOI] [PubMed] [Google Scholar]
- 8.Olshen AB, Venkatraman ES, Lucito R, Wigler M. Circular binary segmentation for the analysis of array-based DNA copy number data. Biostatistics. 2004;5:557–72. doi: 10.1093/biostatistics/kxh008. [DOI] [PubMed] [Google Scholar]
- 9.van de Wiel MA, Kim KI, Vosse SJ, van Wieringen WN, Wilting SM, Ylstra B. CGHcall: calling aberrations for array CGH tumor profiles. Bioinformatics. 2007;23:892–4. doi: 10.1093/bioinformatics/btm030. [DOI] [PubMed] [Google Scholar]
- 10.Meza-Zepeda LA, Kresse SH, Barragan-Polania AH, et al. Array comparative genomic hybridization reveals distinct DNA copy number differences between gastrointestinal stromal tumors and leiomyosarcomas. Cancer Res. 2006;66:8984–93. doi: 10.1158/0008-5472.CAN-06-1972. [DOI] [PubMed] [Google Scholar]
- 11.Wang R, Lu YJ, Fisher C, Bridge JA, Shipley J. Characterization of chromosome aberrations associated with soft-tissue leiomyosarcomas by twenty-four-color karyotyping and comparative genomic hybridization analysis. Genes Chromosomes Cancer. 2001;31:54–64. doi: 10.1002/gcc.1118. [DOI] [PubMed] [Google Scholar]
- 12.El-Rifai W, Sarlomo-Rikala M, Knuutila S, Miettinen M. DNA copy number changes in development and progression in leiomyosarcomas of soft tissues. Am J Pathol. 1998;153:985–90. doi: 10.1016/S0002-9440(10)65640-4. [DOI] [PMC free article] [PubMed] [Google Scholar]
- 13.Otaño-Joos M, Mechtersheimer G, Ohl S, et al. Detection of chromosomal imbalances in leiomyosarcoma by comparative genomic hybridization and interphase cytogenetics. Cytogenet Cell Genet. 2000;90:86–92. doi: 10.1159/000015640. [DOI] [PubMed] [Google Scholar]
- 14.Riva P, Dalprá L, Gualandri V, et al. 19p deletion in recurring leiomyosarcoma lesions from the same patient. Cancer Genet Cytogenet. 2000;119:102–8. doi: 10.1016/s0165-4608(99)00222-8. [DOI] [PubMed] [Google Scholar]
- 15.Derré J, Lagacé R, Nicolas A, et al. Leiomyosarcomas and most malignant fibrous histiocytomas share very similar comparative genomic hybridization imbalances: an analysis of a series of 27 leiomyosarcomas. Lab Invest. 2001;81:211–5. doi: 10.1038/labinvest.3780229. [DOI] [PubMed] [Google Scholar]
- 16.Mandahl N, Fletcher CD, Dal Cin P, et al. Comparative cytogenetic study of spindle cell and pleomorphic leiomyosarcomas of soft tissues: a report from the CHAMP Study Group. Cancer Genet Cytogenet. 2000;116:66–73. doi: 10.1016/s0165-4608(99)00114-4. [DOI] [PubMed] [Google Scholar]
- 17.Yang J, Du X, Chen K, et al. Genetic aberrations in soft tissue leiomyosarcoma. Cancer Letters. 2009;275:1–8. doi: 10.1016/j.canlet.2008.06.013. [DOI] [PMC free article] [PubMed] [Google Scholar]
- 18.Wang R, Titley JC, Lu YJ, et al. Loss of 13q14-q21 and gain of 5p14-pter in the progression of leiomyosarcoma. Mod Pathol. 2003;16:778–85. doi: 10.1097/01.MP.0000083648.45923.2B. [DOI] [PubMed] [Google Scholar]
- 19.Hu J, Rao UN, Jasani S, Khanna V, Yaw K, Surti U. Loss of DNA copy number of 10q is associated with aggressive behavior of leiomyosarcomas: a comparative genomic hybridization study. Cancer Genet Cytogenet. 2005;161:20–7. doi: 10.1016/j.cancergencyto.2005.01.011. [DOI] [PubMed] [Google Scholar]
- 20.Larramendy ML, Kaur S, Svarvar C, Böhling T, Knuutila S. Gene copy number profiling of soft-tissue leiomyosarcomas by array-comparative genomic hybridization. Cancer Genet Cytogenet. 2006;169:94–101. doi: 10.1016/j.cancergencyto.2006.01.008. [DOI] [PubMed] [Google Scholar]
- 21.El-Rifai W, Sarlomo-Rikala M, Andersson LC, Knuutila S, Miettinen M. DNA sequence copy number changes in gastrointestinal stromal tumors: tumor progression and prognostic significance. Cancer Res. 2000;60:3899–903. [PubMed] [Google Scholar]
- 22.Yang J, Du X, Lazar AJ, et al. Genetic Aberrations of Gastrointestinal Stromal Tumor. Cancer. 2008;113:1532–43. doi: 10.1002/cncr.23778. [DOI] [PMC free article] [PubMed] [Google Scholar]
- 23.Ashburner M, Ball CA, Blake JA, et al. Gene ontology: tool for the unification of biology. The Gene Ontology Consortium. Nature Genet. 2000;25:25–29. doi: 10.1038/75556. [DOI] [PMC free article] [PubMed] [Google Scholar]
- 24.Verhaak RGW, Hoadley KA, Purdom E, et al. Integrated genomic analysis identifies clinically relevant subtypes of glioblastoma characterized by abnormalities in PDGFRA, IDH1, EGFR, and NF1. Cancer Cell. 2010;17:98–110. doi: 10.1016/j.ccr.2009.12.020. [DOI] [PMC free article] [PubMed] [Google Scholar]
- 25.Purow B, Shiff D. Advances in the genetics of glioblastoma: are we reaching the critical mass? Nat.Rev. Neurol. 2009;5:419–426. doi: 10.1038/nrneurol.2009.96. [DOI] [PMC free article] [PubMed] [Google Scholar]
- 26.Cavenee WK, Scrable HJ, James CD. Molecular genetics of human cancer predisposition and progression. Mutat Res. 1991;247:199–202. doi: 10.1016/0027-5107(91)90015-g. [DOI] [PubMed] [Google Scholar]