

Abstract
Reproducibility of three different aspects of fMRI activations—namely binary activation maps, effect size and spatial distribution of local maxima—was evaluated for an auditory sentence comprehension task with high attention demand on a group of 17 subjects that were scanned on five different occasions. While in the scanner subjects were asked to listen to series of six short everyday sentences from the CUNY sentence test. Comprehension and attention to the stimuli was monitored after each listen condition epoch by having subjects answer a series of multiple choice questions. Statistical maps of activation for the listen condition were computed at three different levels: overall results for all imaging sessions, group-level/single-session results for each of the five imaging occasions, and single-subject/single-session results computed for each subject and each scanning occasion independently. The experimental task recruited a distributed bilateral network with processing nodes located in lateral temporal cortex, inferior frontal cortex, medial BA6, medial occipital cortex and subcortical structures such as the putamen and the thalamus. Reproducibility of these activations at the group level was high (83.95% of the imaged volume was consistently classified as active/inactive across all five imaging sessions), indicating that sites of neuronal activity associated with auditory comprehension can reliably be detected with fMRI in healthy subjects, across repeated measures after group averaging. At the single-subject level reproducibility ranged from moderate to high, although no significant differences were found on behavioral measures across subjects or sessions. This result suggests that contextual differences—i.e., those specific to each imaging session, can modulate our ability to detect fMRI activations associated with speech comprehension in individual subjects.
Keywords: fMRI, functional MRI, reliability, reproducibility, intraclass correlation coefficient, ratio of volume overlap, language, speech, auditory sentence comprehension
INTRODUCTION
Neuroscientists routinely use functional Magnetic Resonance Imaging (fMRI) to study the functional organization of the human brain in vivo. However, little is known about the reproducibility of fMRI measures across repeated scanning sessions, even under invariant experimental conditions. Understanding the level of reproducibility that can be expected from a given fMRI experimental design is necessary to avoid making incorrect scientific inferences, as results may be contaminated by high levels of inter-session variability, and thus may not directly reflect the neuronal behavior of interest. Although a number of studies have previously addressed the reliability of fMRI experimentation, they have primarily focused on simple somatosensory tasks (McGonigle et al., 2000; Rombouts et al., 1998; Specht et al., 2003), used only two or three sessions (Chee et al., 2002; Havel et al., 2006; Miki et al., 2000; Rau et al., 2007; Vlieger et al., 2003), evaluated only single aspects of the fMRI analysis and interpretation process (e.g., activation overlap, size of activation), and/or focused on differences across scanning sites (Friedman et al., 2008).
The issue of inter-session reproducibility requires special attention in the particular case of longitudinal fMRI studies. These studies, which are common in the fMRI literature, seek to evaluate changes in cortical patterns of neuronal activity that accompany an experimentally controlled manipulation (i.e., training or treatment), and are commonly designed to follow a particular structure. First, a reduced number of subjects not previously exposed to the manipulation of interest are randomly selected. Second, all participants undergo a first fMRI scanning session (pre-manipulation) from which a set of baseline activation statistics are computed for the group—e.g., significant activation maps, mean T-statistic within a region of interest (ROI), coordinates of peak locations, etc. Third, the manipulation of interest is introduced—i.e. subjects undergo training and/or a specific clinical intervention. Fourth, once the manipulation is complete, subjects participate in a follow-up fMRI scanning session (post-manipulation) with an experimental paradigm that matches that of the pre-manipulation session, permitting a second set of activation statistics to be computed for the group. Finally, cortical regions that exhibit changes in activation statistics between the pre- and the post-manipulation data are inferred to have been modulated as a consequence of the experimental manipulation.
Independent of the method used to evaluate the presence of significant changes across the sessions—differences in ROI averaged β coefficients (Stein et al., 2009), differences in ROI averaged hemodynamic response time-course (Kwon et al., 2009), shifts of center of mass (Wang et al., 2003; Wu et al., 2005), or changes in significantly active voxel counts (Wu et al., 2005)—an implicit assumption in most longitudinal designs is that, in the absence of the manipulation of interest, activation statistics would be statistically unchanged across repeated measures. This would mean that, if a second, third or n-th scanning session is performed in the absence of the manipulation no statistically significant changes would have been observable in the group results, and, therefore, the observed changes during the longitudinal study can be attributed to the manipulation. Although this assumption might hold true for specific brain regions or experimental designs, it is a strong assumption that requires empirical verification.
One higher cognitive function commonly targeted by longitudinal neuroimaging studies is language. Better understanding the processes that accompany recovery of language function after a neural lesion (Harnish et al., 2008; Musso et al., 1999), or adaptation to degraded speech after cochlear implantation (Giraud et al., 2001; Giraud and Truy, 2002; Giraud et al., 2000) are medical questions that can greatly benefit from well executed longitudinal neuroimaging studies. In spite of many such investigations, reproducibility of language fMRI activations across imaging sessions under “static” conditions—i.e. when no manipulation is present—remains an open question. Most existing studies focus on the reproducibility of language lateralization and/or volume of activation in specific areas (Fernandez et al., 2003; Harrington et al., 2006a; Jansen et al., 2006; Lohmann et al., 2004; Rutten et al., 2002); but do not evaluate the reproducibility of these and other aspects of fMRI-observed activity in the brain as a whole. One reason for this narrow scope is that most of the studies are motivated by precise potential clinical applications of fMRI, rather than the more explorative approach associated with many longitudinal studies. As a consequence, results from these previous reliability studies cannot be used to define a baseline for longitudinal studies of language.
In the present study we use an auditory sentence comprehension task with high attention demand on a large corpus of subjects studied on a single MRI system, to produce a robust reliability assessment for fMRI of speech perception. This work reveals a high level of reproducibility for group-level fMRI activations associated with auditory comprehension tasks, and has important implications for the design of longitudinal studies of speech perception, as even under well-controlled conditions—i.e., a common experimental paradigm and no significant differences in terms of task performance—reproducibility of single-subject activations across sessions can vary greatly on a subject basis.
MATERIALS AND METHODS
Subjects
Seventeen native English speakers with no known history of hearing and/or neurological disorders (9 males, 8 females: mean ± SD age 24.4 ± 3.0) completed this study. All participants were right handed (mean ± SD augmented index 83.7 ± 7.0) according to the Edinburgh Handedness Inventory (Oldfield, 1971). All subjects gave informed consent in compliance with a protocol approved by the Institutional Review Board of Purdue University. All scans took place in the afternoons (after 4:30 PM) and the total elapsed time between session one and session five was 7.8 ± 2.6 days (range: 5 – 14 days). No more than one session took place for a given subject on the same day. Participants were asked to refrain from caffeine on the days of scanning and to vouch that the amount of sleep on the previous night was satisfactory.
One female subject was removed from the imaging results because of poor performance on the Response task (see Behavioral Results, below).
Experimental Design
fMRI stimuli consisted of a subset of 660 sentences from the CUNY (City University of New York) sentences test (Boothroyd et al., 1988). This open-set word recognition test is commonly used to evaluate speech performance in the cochlear implant population (Buss et al., 2008; Hay-McCutcheon et al., 2005; Mok et al., 2006).
Four functional runs (duration = 380s) were conducted during each imaging session. Each functional run had the same organization of blocks (Figure 1), beginning and ending with a 15-s block during which participants viewed a fixation cross while no auditory stimulus was presented; these blocks were included to achieve equilibrium signal levels. In between were 5 repetitions of the following sequence of blocks: visual instructions (5s); auditory stimulus block (25s); visual instructions (5s); response/attention control task (15s); and rest (20s). During visual instruction presentation and response/attention control task blocks, no auditory stimulus was presented to the subjects. During the auditory stimulus blocks (“Listen condition”) subjects were asked to look at a fixation crosshair and listen to a series of sentences presented binaurally via pneumatic headphones. Each block consisted of 6 CUNY sentences (2 questions, 2 statements and 2 commands) selected so that the total number of words (51 words) was constant across blocks. During the response blocks (“Response condition”), subjects were asked to read from the screen and answer three multiple-choice questions using a response box. For each question a randomly selected sentence from the preceding auditory block was presented visually with one word substituted by a blank space. Four words were presented on the screen, below the sentence. Subjects were required to select from these options the word that filled in the blank to complete one of the sentences presented during the preceding auditory block. Subjects were familiarized with the task by exposure to a practice run before entering the scanner.
FIGURE 1.

Time course of one functional run.
Data Acquisition
Imaging was performed at the Purdue MRI Facility (West Lafayette, IN) on a General Electric (Waukesha, WI) 3T Signa HDx scanner equipped with AFNI realtime fMRI capabilities (Bodurka and Bandettini, 2008), using an 8-channel brain-array coil (Invivo). During each imaging session, a single high resolution axial fast spoiled gradient-echo sequence acquisition (38 slices, slice thickness=3.8mm, spacing=0mm, FOV=24cm, in-plane resolution=256×256) was followed by four functional runs. Functional runs were obtained using a multi-slice echo planar imaging sequence (TR=2.5s, TE=22ms, 38 slices, slice thickness=3.8mm, spacing=0mm, in-plane resolution=64×64, FOV=24cm, flip angle=77°). Additionally, at the end of one of the imaging sessions, sagittal high resolution T1-weighted images (number of slices=190; slice thickness=1.0mm; FOV=24cm; in-plane resolution=256×224) were also acquired for alignment and presentation purposes.
In addition to imaging data, behavioral data was collected while subjects were in the scanner. Subjects indicated their selection of the missing word during Response blocks via a 4-button response box (CURDES Fiber Optic Response Box Model No: HH-2×4-C), using their left hand. Both response and response times were recorded.
fMRI Data Analysis
The focus of this study is the reproducibility of activation associated with auditory sentence comprehension. The functional runs conducted in this experiment contain two conditions: Listen and Response. The main purpose of the Response condition was to ensure that subjects were carefully listening to the auditory stimuli provided during the Listen condition. Therefore within the scope of this document the Response condition is treated solely as a means to obtain confirmatory behavioral data during imaging, and the activations associated with this condition are reported for completeness, but not evaluated.
Subject-level/Single-session (Subject-Session) fMRI Data Analysis
Data analysis was conducted with AFNI (Cox, 1996). Individual subject pre-processing steps included: (1) discarding the initial two volumes to allow for T1 saturation effects; (2) motion correction of each run to its mean; (3) spatial registration of motion corrected functional runs to the subject’s anatomical scan; (4) spatial smoothing with a Gaussian kernel (full width at half maximum = 6mm); and (5) intensity normalization by means of dividing each time-series by its own mean.
Following these pre-processing steps, linear regression analysis with AFNI 3dDeconvolve was performed independently on each session of each subject to estimate areas of neuronal activation. Motion parameters were input to the linear regression model as covariates of no interest. Statistical maps of significant activation were computed for the Listen condition for each session of each subject.
In addition to the subject-level/single-session (Subject-Session) statistical maps, AFNI 3dDeconvolve was used to compute estimates of the impulse response function (IRF) associated with each experimental condition (Listen, Response, and the visually-presented Instructions). The mean IRF (MIRF) for each experimental condition was subsequently computed as the average across time of the middle portion of the IRF. Initial and ending tails of the IRF were discarded to avoid influence of transients on estimated MIRF. MIRFs obtained this way were then transformed to a common stereotactic space using the Talairach template provided by AFNI. These Talairach transformed mean IRFs constitute the input for the two analyses described below.
Group-level/Single-session (Group-Session) fMRI Data Analysis
Group-level results were calculated independently for each of the five imaging sessions (Group-Session). In each session, mean IRFs from the 16 subjects were input to a 2-way ANOVA (single-factor within-subject design of AxB; A=task [Listen, Response, Instructions], fixed; B=subject [1..16], random) model. Statistical maps of significant activation were generated only for the Listen condition.
Omnibus fMRI Data Analysis
Omnibus results were calculated using a single 3-way ANOVA (double-factor within-subject design A×B×C; A=task [Listen, Response, Instructions], fixed; B=session [S01, S02, S3, S04, S05], fixed; C=subject [1..16], random) that allowed us to combine in a single analysis all data (80 sessions). In this case, statistical maps of activation were produced for the two experimental conditions—i.e., the Listen condition and the Response condition.
fMRI Reproducibility Analysis
The purpose of the present work is to validate an experimental task that may be used as a control procedure in longitudinal studies of speech perception. This is achieved here through the evaluation of three aspects of fMRI activations, namely statistically thresholded activation maps, effects size and spatial distribution of local maxima. To accomplish this evaluation, a range of metrics were utilized to provide a robust and sound assessment of reliability for the given experimental design. Reproducibility of statistically thresholded activation maps was evaluated via overlap maps, ratio of volume overlap and ratio of consistent classification. Reliability of effect size was assessed by three measures of variance (e.g., between-subject, between-session, and residual). Reproducibility of the spatial distribution of local maxima was studied in terms of the minimum radius sphere in which a given peak would be most probably found across sessions and subjects. These metrics and their application are described in detail in the remainder of this section.
Activation Overlap
Maps of activation overlap across imaging sessions (Havel et al., 2006; Rau et al., 2007; Rombouts et al., 1997; Specht et al., 2003) were computed for the Group-Session and Subject-Session results, with the latter computed on both an individual and aggregate (second-level) basis. In the Group-Session and individual Single-Session overlap maps, the value at a given voxel is the relative frequency across repeated imaging sessions at which that voxel was classified as significantly active (pFDR<0.005).
To allow for quantitative comparisons of these maps we computed a new ratio called ratio of consistent classification (Rcc). This ratio is defined as:
| (1) |
where Vtotal is the total intracranial volume for which a T-statistic exists in all imaging occasions, Vca is the intracranial volume consistently classified as significantly active at all imaging occasions and Vcna is the intracranial volume consistently classified as not significantly active at all imaging occasions. This ratio, which is dependent on statistical threshold, has a simple interpretation. It provides information about the percentage of imaged volume that is consistently classified either as active or inactive across all imaging sessions. The ratio defined in Equation 1 varies from 0 to 100, with 0 meaning no consistent reproducibility of classification for any imaged voxel, and 100 representing the case of perfect reproducibility with every single intracranial imaged voxel being assigned the same label (active/inactive) in all imaging occasions.
Plausible explanations for observation of differences in activation across subjects include variability in head motion, task performance, physiological noise, and/or cognitive strategy. Independent correlation analyses were conducted between Rcc and mean head motion, mean percent correct responses and mean response time.
In addition, for comparison with previous reliability studies, the ratio of volume overlap (Roverlap), as described by Rombouts et al. (1997), was also calculated. Roverlap was computed for all ten possible pair-wise session combinations (e.g., S01 vs. S02, S01 vs. S03, S02 vs. S03, etc.) both at the individual subject and group levels. Given the known dependence of Roverlap with statistical threshold, the ratios were computed for three different statistical thresholds (pFDR<0.005; pUnc<0.005; pFDR<0.05). The average and standard deviation of Roverlap across subjects and across session-pairs were calculated to summarize the data.
To investigate whether Roverlap varied as a function of session—i.e., longitudinally, possibly suggesting task adaptation effects—a repeated-measures 1-way ANOVA (Factor: session-pair) was performed on the single-subject Roverlap values associated with the pFDR<0.005 threshold.
Reproducibility – Variance Analysis
To evaluate reproducibility of the fMRI measurements the following three variance-ratios (i.e., equations 2-4) were calculated for all voxels for which a beta weight for the Listen condition was available in all 80 imaging sessions.
| (2) |
| (3) |
| (4) |
In the above set of equations, the total variance in the data () can be segregated in three additive components: between-subject variance (), between-session variance (), and residual variance (). These variance components were estimated in a two-crossed-random-effect model via Restricted Maximum Likelihood (REML) method using the AFNI program 3dICC_REML (http://afni.nimh.nih.gov/sscc/gangc/ICC_REML.html). RVbet-sbj—which corresponds to ICC(2,1) in Shrout and Fleiss (1979) nomenclature—and RVbet-ses, are commonly used to assess reliability of fMRI (Aron et al., 2006; Caceres et al., 2009; Gountouna et al., 2010; Raemaekers et al., 2007; Specht et al., 2003; Wei et al., 2004).
Reproducibility – Ninety-Five Percent Probability Radius (r95)
To identify the most spatially reproducible peak locations in the data, we developed a novel methodology based on the Omnibus results and the Euclidean distance between pairs of local maxima (di,j). This method allows us to sort the local maxima of the Omnibus results in terms of the minimum sphere within which we can expect to find a local maximum in the Group-Session or aggregate Subject-Session results with a 95% probability.
The computation method when applied to the Group-Session results is as follows. A list of supra-threshold local maxima, sorted by peak intensity, was obtained for the Omnibus activation map for the Listen condition. Similar lists were also created for each of the five Group-Session maps. Then, using the Omnibus list as a seed, we performed the following steps for each peak (pi) on the list. First, the closest local maxima (clm)—i.e. the one with the minimum Euclidean distance—to pi was found in each Group-Session list (clmi1, clmi2, clmi3, clmi4, clmi5), and the corresponding distances were recorded (di,1, di,2, di,3, di,4, di,5). Second, the mean (μi) and the standard deviation (σi) of these minimum distances were calculated for each seed peak (pi). Third, an additional summary statistic for the minimum distances, what we have called the ninety-five percent probability radius (), was calculated for each seed peak (pi) using the following equation:
| (6) |
Assuming a normal distribution N(μi,σi) for the population of minimum distances (di,1, di,2, …) associated with each seed peak (pi), ninety-five percent of its elements belong to the interval [μ−1.96σ, μ+1.96σ]. Physically, , as defined above, is the radius of a sphere centered at pi for which there is a ninety-five percent probability of finding a local maximum in any Group-Session activation map.
A similar procedure was implemented for the aggregate Subject-Session results. Again using the Omnibus results as a seed (i.e., the same list of pi), the minimum distance location across the 80 individual sessions was identified. Mean, standard deviation and were calculated as explained above, but now over the 80 individual sessions.
Histograms of the corresponding populations of r95 were generated to compare the reproducibility of the spatial distribution of peaks in the Group- and aggregate Subject-Session results. Histograms that skew to the left (i.e., toward zero) are suggestive of highly reproducible activation locations, whereas those that skew to the right indicate lesser reproducibility.
Scanner Quality Assurance
To assess whether variability observed in our data was likely to have arisen from hardware instability, scanner stability was evaluated over the course of this study using a quality assurance (QA) protocol consisting of a subset of the QA metrics proposed by Friedman et al. (2006). The set of metrics included in this study: signal-to-fluctuation-noise ratio (SFNR), signal-to-noise ratio (SNR), percent signal fluctuation (%Fluct), percent signal drift (%Drift), RF Digital Receiver Gain (R1), RF Analog Receiver Gain (R2), RF-Transmit Gain, and Resonant Frequency (ResFreq).
QA sessions consisted of two multi-slice echo planar imaging sequences with the spherical TLT phantom placed in the center of the Invivo 8-channel brain array. On all occasions a minimum of 10 minutes elapsed between the placement of the phantom at the center of the scanner and the start of data acquisition, allowing for settling of the fluid inside the phantom. Scanning parameters exactly matched those of the functional scans conducted on the human subjects. Data from the first run were discarded, and data from the second run was included in the analysis. All QA metrics were calculated following the guidelines of Friedman et al. (2006), using AFNI (Cox, 1996). One important difference between our QA protocol and the one published by Friedman et al. is the type of phantom being used. While we used a spherical TLT phantom, Friedman et al. used a custom developed agar gel phantom. The use of different phantoms must be considered when comparing results.
RESULTS
Behavioral Performance
Percentage of correct responses (Figure 2.A) and average response times (Figure 3.B) for each session and subject were computed using the behavioral data collected in the scanner. The overall mean percentage of correct responses was 81.37 ± 8.47%. This value is well above chance level (25%) for a four option multiple-choice test. Overall mean response time was 2.95 ± 0.35 seconds.
FIGURE 2.

Behavioral Results. (A) Mean percent correct responses for each subject and each session. (B) Mean response time for each subject and each session. The overall mean (OAM) in both graphs appear as a continuous horizontal black line. Limits for one and two standard deviations from the mean appear as dashed (±1SD) and dotted black lines (±2SD).
FIGURE 3.

Quality Assurance results. (A) Radiofrequency (RF) digital receiver, RF analog receiver and RF transmitter gains. (B) Last five digits of the resonance frequency. (C) Signal to Noise Ratio and Signal to Fluctuation Noise Ratio. (D) Percent Signal Drift and Percent Signal Fluctuation.
Figure 2.A shows that no systematic differences were observed in the percentage of correct responses across sessions (F=0.07; p=0.99). Figure 2.B shows that while response times were quite variable, no significant difference was present when comparing across sessions (F=1.01; p=0.41). Note that Sbj05 performed more than two standard deviations below the overall mean percent correct on two occasions (sessions one and five) and was more than one standard deviation below the mean on all five occasions. On the basis of this outlier performance—suggestive of non-compliance with the task—this subject was excluded from further analysis.
Scanner Quality Assurance Performance
Figure 3 summarizes results from the QA protocol, demonstrating that the scanner was stable during the duration of the study. RF-receiver and transmit gains show appreciable stability across time (Figure 3.A), which if absent can be an indicator of hardware problems. In the case of the resonant frequency (represented by its last five digits in Figure 3.B), a simple linear regression analysis (ResFreq = 22,000 −0.33*day; r2 = 0.05) showed a very slow, but steady, decrease with time. This is consistent with results reported by Friedman et al. (2006) based on a QA protocol conducted over a longer period of time. Mean SFNR was 364.60 ± 24.24 and mean SNR was 439.96 ± 24.57 (Figure 3.C), both above previously reported values for other well-maintained 3T systems (Friedman and Glover, 2006). Mean percent fluctuation (Figure 3.D) during the duration of the experiment was 0.12 ± 0.02% with a maximum value of 0.18%, below the ceiling value of 0.20% reported by Friedman et al. (2006) as typical for stable scanners. As for drift values, the average value during the duration of this experiment was 0.64 ± 0.40%; again below the ceiling average previously reported for stable scanners (1.0%). As stated in the method section, one important difference between the QA protocol used by Friedman et al. (2006) and the one presented here is the use of a different imaging phantom. This procedural difference might account for some or all of the discrepancies, relative to previously reported QA values, discussed here.
Task-Based fMRI Activation
Omnibus Results
Figure 4.A shows surface renderings of Omnibus activations (pFDR<0.005) for the Listen (top row) and Response conditions (middle row). Figure 4.B shows an overlap map for these two conditions to facilitate identification of areas of common activity (cyan color).
FIGURE 4.

Activation maps of the Omnibus (3-way ANOVA) analysis at pFDR<0.005. The top box shows activations for the Listen condition (top row) and Response condition (middle row). The lower box shows an overlap between both conditions to clearly identify areas only active during the Listen condition (green), only during the Response condition (dark blue) and activated areas common to both conditions (cyan).
The Listen condition activated a distributed bilateral network that includes large portions of the temporal lobe such as the posterior half of the superior temporal plane, the superior temporal gyrus, superior temporal sulcus, posterior portions of the middle temporal gyrus, the temporal pole and the parahippocampal gyrus. In the frontal lobe, areas recruited for the Listen condition include several locations within the inferior frontal gyrus, the medial supplementary motor cortex (medial BA6) and the precentral gyrus. In addition, activations are present in right postcentral gyrus, bilateral lingual gyrus, adjacent cerebellar regions (not shown in the surface rendering), bilateral cuneus and a series of subcortical structures including bilateral putamen, caudate and thalamus.
For the Response condition, activations include large portions of the occipital lobe that extend ventrally into posterior portions of the temporal lobe—i.e. infero-posterior end of the middle temporal gyrus, posterior fusiform gyrus and parahippocampal gyrus—and dorsally into the inferior and superior parietal lobules. In addition, the Response condition elicits large areas of activation in bilateral inferior frontal gyrus, precentral gyrus, medial supplementary motor cortex (medial BA6), cingulate gyrus and subcortical structures including bilateral putamen, caudate and thalamus.
Areas of overlap between these activation networks (Figure 4.B) include portions of bilateral medial visual cortex, adjacent bilateral cerebellar cortex (not depicted in the surface renderings), bilateral inferior frontal gyrus, bilateral precentral gyrus, bilateral medial BA6, left posterior middle temporal gyrus and left temporal pole. Overlap also exists for portions of the putamen, the caudate and the thalamus.
Group-Session Results
Figure 5 shows the Group-Session activation map (pFDR<0.005) for the Listen condition at each imaging occasion. Significant activations at the group level in all five sessions were generally consistent with the Omnibus analysis. Areas of significant activation include bilateral superior and medial temporal cortex, inferior frontal cortex, medial supplementary motor cortex (medial BA6), early visual cortex, adjacent cerebellar cortex (not depicted in the surface renderings), putamen and thalamus. Note the high level of between-session consistency of detected activations that may be observed by visual inspection across columns (see Task-Based fMRI Activation Reproducibility for more detail).
FIGURE 5.
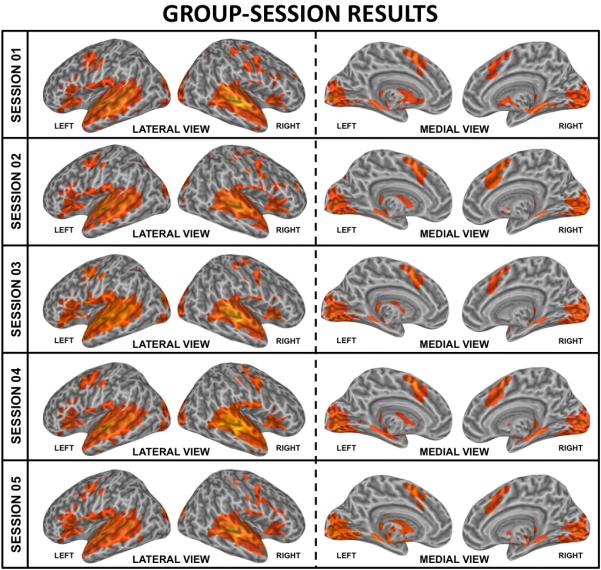
Group-level/single-session (Group-Session) significant activations. Group level activations are shown for each of the five imaging sessions at pFDR<0.005. Activations common to all five sessions include areas dispersed across the superior temporal cortex, inferior frontal cortex, the supplementary motor area, early visual cortex and subcortical structures such as the putamen and the thalamus. Activations were also present in the superior medial cerebellar region, although these activations are not depicted in the cortical surface renderings.
Subject-Session Results
A sample of individual Subject-Session results for the Listen condition is presented in Figure 6. Clusters of significant activation are consistently present across all individual sessions, being observed in bilateral superior and middle temporal cortex, inferior frontal cortex, medial supplementary motor area (medial BA 6), visual cortex, adjacent cerebellar regions (not depicted in the surface renderings), and subcortical structures. Note that these images exhibit good agreement with the Omnibus (Figure 4) and Group-Session (Figure 5) results, but that the intensity, extent and precise location of individual Subject-Session activations exhibit greater variability than at the group-level.
FIGURE 6.

Selected individual subject-level/single-session (individual Subject-Session) activation maps at pFDR<0.005. First and second rows correspond to subject Sbj08 (sessions 2 and 5 respectively). Third and fourth rows correspond to subject Sbj10 (sessions 2 and 3 respectively). Fifth and sixth rows correspond to Sbj16 (sessions 2 and 4 respectively).
Task-Based fMRI Activation Reproducibility
Probability of Activation Overlap (Rcc)
Figure 7 presents a color-coded activation overlap map for the Group-Session results. In this map, the value (and therefore color correspondence) of a given voxel is equal to the relative frequency, across imaging sessions, at which that voxel was classified as significantly active (Machielsen et al., 2000; Specht et al., 2003). It is readily observed that detection of activity/inactivity is highly consistent across imaging sessions. Of the total imaged volume, 11.32% is active in all sessions (yellow) and 72.63% is inactive (no color), leading to a total Rcc of 83.95% (Table 1); meaning that only 16.05% of the total imaged volume exhibits variability of classification at the group-level. Note that the majority of the volume exhibiting this uncertainty is confined to the edges of the always-active (i.e., yellow) areas, with small isolated regions of inconsistent activation observed in bilateral angular gyrus/superior parietal lobule and right middle frontal gyrus (black circles in Figure 7). The group-level Roverlap also exhibits a high level of consistency across sessions, with a mean value of 0.79 ± 0.01 for pFDR<0.005 (Table 2.A). When tested at less stringent levels of statistical significance, Roverlap continued to be high (pUnc<0.005: Roverlap = 0.82; pFDR<0.05: Roverlap = 0.85 ± 0.01; see Table 2.A).
FIGURE 7.
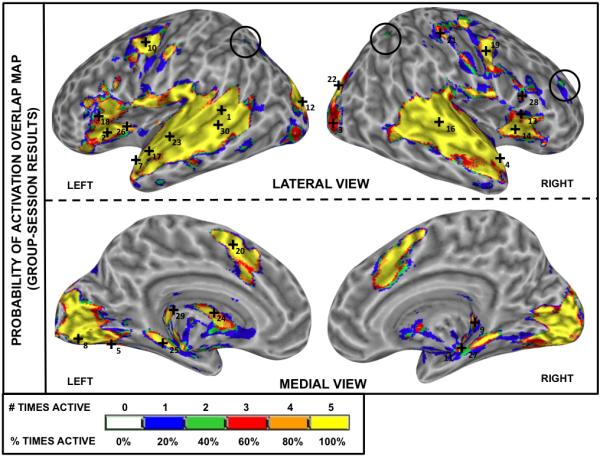
Reliability analysis (Rcc) for Group-Session data. The color-coded overlap activation map indicates the relative frequency at which a voxel was classified as significantly active (pFDR<0.005) in the five Group-Session results (blue = significantly active only in one session; green = significantly active in two sessions; red = significantly active in three sessions; orange = significantly active in four sessions; yellow = significantly active in all five sessions). Numbered cross-hairs in the map correspond to the thirty most reliable peak locations (as measured by r95) for the Group-Session results (see column 5 on Table 3). The black circles on bilateral angular gyrus/superior parietal lobule and right middle frontal gyrus indicate isolated areas of inconsistent group activation across repeated measures.
TABLE 1.
Ratio of Consistent Classification (Rcc). The left hand side of the table shows Rcc values for each individual subject as well as the mean and standard deviation across all single-subject (individual Subject-Session) results. The right most column shows the Rcc for the group-level (Group-Session) results.
| Single-Subject Results | Group-Level Results |
||||||||||||||||
|---|---|---|---|---|---|---|---|---|---|---|---|---|---|---|---|---|---|
| SBJ01 | SBJ02 | SBJ03 | SBJ04 | SBJ06 | SBJ07 | SBJ08 | SBJ09 | SBJ10 | SBJ11 | SBJ12 | SBJ13 | SBJ14 | SBJ15 | SBJ16 | SBJ17 | Mean ± SD | |
| 54.02 | 55.40 | 61.48 | 76.47 | 68.15 | 54.90 | 64.37 | 56.54 | 69.33 | 50.85 | 66.82 | 51.48 | 31.40 | 54.06 | 53.23 | 69.89 | 58.65 ± 10.68 | 83.95 |
TABLE 2.
Ratio of Volume Overlap. (A) Average and standard deviation of the Roverlap across subjects for each possible session pair combination (e.g., S01 – S02, S01 – S03, etc.). (B) Group-level results Roverlap for each possible session pair combination. In both tables the right-most column shows the mean and standard deviation computed across all session pairs. Ratios are reported for three different statistical thresholds (pFDR<0.005; pFDR<0.05; pUnc<0.005).
| (A) Group-level/Single-Session (Group-Session) Roverlap | |||||||||||
|---|---|---|---|---|---|---|---|---|---|---|---|
| S01-S02 | S01-S03 | S01-S04 | S01-S05 | S02-S03 | S02-S04 | S02-S05 | S03-S04 | S03-S05 | S04-S05 | Overall | |
| pFDR < 0.005 | 0.79 | 0.79 | 0.77 | 0.77 | 0.81 | 0.79 | 0.80 | 0.80 | 0.79 | 0.79 | 0.79 ± 0.01 |
| pUnc < 0.005 | 0.82 | 0.82 | 0.80 | 0.81 | 0.84 | 0.82 | 0.82 | 0.84 | 0.82 | 0.82 | 0.82 ± 0.01 |
| pFDR < 0.05 | 0.84 | 0.84 | 0.84 | 0.83 | 0.86 | 0.86 | 0.84 | 0.86 | 0.84 | 0.85 | 0.85 ± 0.01 |
| (B) Average individual Subject-level/Single-Session (individual Subject-Session) Roverlap | |||||||||||
|---|---|---|---|---|---|---|---|---|---|---|---|
| S01-S02 | S01-S03 | S01-S04 | S01-S05 | S02-S03 | S02-S04 | S02-S05 | S03-S04 | S03-S05 | S04-S05 | Overall | |
| pFDR < 0.005 | 0.70 ± 0.10 | 0.69 ± 0.08 | 0.65 ± 0.09 | 0.64 ± 0.10 | 0.71 ± 0.07 | 0.70 ± 0.08 | 0.68 ± 0.11 | 0.71 ± 0.09 | 0.71 ± 0.07 | 0.69 ± 0.11 | 0.69 ± 0.09 |
| pUnc < 0.005 | 0.70 ± 0.10 | 0.69 ± 0.08 | 0.66 ± 0.09 | 0.65 ± 0.10 | 0.72 ± 0.06 | 0.69 ± 0.08 | 0.68 ± 0.11 | 0.72 ± 0.09 | 0.72 ± 0.07 | 0.70 ± 0.11 | 0.69 ± 0.09 |
| pFDR < 0.05 | 0.71 ± 0.09 | 0.70 ± 0.08 | 0.67 ± 0.09 | 0.66 ± 0.09 | 0.72 ± 0.06 | 0.71 ± 0.07 | 0.69 ± 0.11 | 0.72 ± 0.08 | 0.72 ± 0.08 | 0.70 ± 0.1 | 0.70 ± 0.09 |
Selected individual Subject-Session overlap maps are shown in Figure 8 (see Supplementary Figures 1 and 2 for additional maps). Reproducibility of activations clearly varies across subjects (see also Table 1) with some subjects reaching Rcc values in the vicinity of 70%—e.g., Sbj04 (Rcc=76.47%) or Sbj17 (Rcc=69.89%)—while others are well below that level—e.g., Sbj14 (Rcc=31.40%) or Sbj11 (Rcc=50.85%). This between-subject variability of activation reproducibility leads to an aggregate Subject-Session overlap activation map (Figure 9) with large regions of inconsistent activation. A comparison with Figure 7 reveals that while considerable portions of the bilateral superior temporal cortex, inferior frontal cortex, precentral gyrus, medial supplementary motor cortex (medial BA 6) and medial occipital cortex exhibit a large degree of consistent activation across all 80 imaging sessions (90% or more; yellow), the volume of uncertain activation around these yellow areas has increased. Averaging over all subjects, the individual Subject-Session Rcc = 58.65 ± 10.68% (Table 1), with Roverlap = 0.69 ± 0.09 at pFDR<0.005 (Table 2.B). At pUnc<0.005 Roverlap = 0.69 ± 0.09, and at pFDR<0.05 Roverlap = 0.71 ± 0.09. Note that these values are lower than those observed at the same thresholds in the group level analysis (Table 1 and Table 2). Assessing for non-experimental factors that might have affected Rcc, no significant correlations were observed with mean head motion, (r=−0.36; T=1.44 p=0.17), percent correct responses (r=0.13; T=0.47 p=0.64), or response time (r=−0.47; T=1.99 p=0.07). No significant differences (F=1.06; p=0.40) were found between any subject or session pair-wise comparison of the individual Subject-Session Roverlap values.
FIGURE 8.

Reliability analysis (Rcc) for individual Subject-Session data. Selected individual Subject-Session color-coded overlap activation maps indicate the relative frequency at which a voxel was classified as significantly active (pFDR<0.005) for the given subject (e.g., Figure 6). Data from four subjects (Sbj04, Sbj17, Sbj11 and Sbj14) are presented in the figure. Maps are sorted vertically in terms of descending Rcc value (reported on the left of each map).
FIGURE 9.
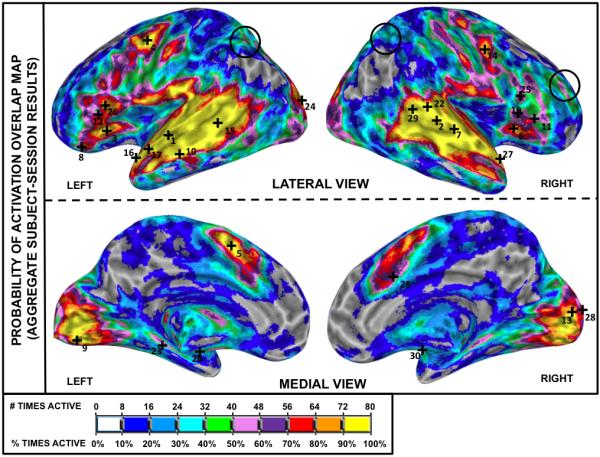
Reliability analysis (Rcc) for aggregate Subject-Session data. The color-coded aggregate Subject-Session overlap activation map indicates the relative frequency at which a voxel was classified as significantly active (pFDR<0.005) out of the 80 individual Subject-Session results (e.g., see Figure 6). Numbered cross-hairs in the map correspond to the thirty most reliable peak locations (as measured by r95) for the individual Subject-Session results (see Table 4). The black circles on bilateral angular gyrus/superior parietal lobule and right middle frontal gyrus indicate the isolated areas of inconsistent group activation noted in Figure 7.
Reproducibility – Variance Analysis
Figure 10.A-C presents volumetric maps of the computed variance ratios (10.A: RVbet-sbj, 10.B: RVbet-ses, 10.C: RVres). Voxels with a variance ratio close to one in these maps correspond to regions where the overall variance has a high contribution from the corresponding variance. When contrasted with the omnibus results and the group-session overlap maps (See Supplementary Figure 3 for an overlay), it can be noted that areas with high RVbet-sbj tend to overlap with areas of consistent significant activation across sessions; however, voxels with high RVbet-sbj also exist outside of these areas.
FIGURE 10.

Volumetric Variance Ratio Maps. (A) Ratio of Between-subject Variance (RVbet-sbj) map indicating the voxels for which between-subject variance is an important contributor to the overall variance. (B) Ratio of Between-session Variance (RVbet-ses) map depicting voxels for which between-session variance is an important contributor to the overall variance. (C) Ratio of Residual Variance (RVres) map depicting voxels for which residual variance in an important contributor to the overall variance.
Reproducibility – Ninety Five Percent Probability Radius (r95)
Figure 11.A depicts the histogram and cumulative histogram of the Group-Session r95 measure associated with all local maxima in the Omnibus map for the Listen condition. Note the left skew of this histogram, indicating high reliability in the Group-Session activation maps. Summary information about the 30 most spatially reliable Group-Session peaks is provided in Table 3. Peaks are sub-divided by macro-anatomical labels (e.g. temporal cortex, frontal cortex, parietal cortex, occipital cortex, subcortical structures and cerebellum). Within each sub-division peaks are sorted in terms of the Group-Session r95 (column 5); so that the earlier a peak appears within a sub-division, the higher the spatial consistency of that location across sessions in the Group-Session results. These peaks are also depicted in Figure 7, superimposed on the Group-Session probability overlap maps. 15 of the 30 peaks included in Table 3 lie within temporal cortex or inferior frontal cortex—the primary cortical locations involved in speech perception. The next largest set of peaks corresponds to the occipital cortex (five peaks) and adjacent cerebellar cortex (two peaks), which evidences once more the consistent recruitment of these areas during the Listen condition. Additional peaks with high reliability are present in the left medial supplementary cortex (medial BA 6), left putamen, and the right precentral gyrus.
FIGURE 11.

Results for the 95% probability radius (r95) analysis. (A) Histogram and cumulative histogram for the r95 associated with the Group-Session results. (B) Histogram and cumulative histogram for the r95 associated with the aggregate Subject-Session results.
TABLE 3.
Thirty most spatially reliable local maxima in the overall results for the Listen condition according to the Group-Session r95. Within each macro-anatomical region (e.g., temporal lobe, frontal lobe, etc.) the peaks are sorted by increasing 95% reliability distance.
| Side | Talairach [mm] | GRP-r95 | SSB-r95 | Intensity | Anatomical Label | BA | |||||
|---|---|---|---|---|---|---|---|---|---|---|---|
| RL | AP | IS | Rnk | mm | Rnk | mm | Rnk | T | |||
|
Temporal Lobe
| |||||||||||
| L | 40 | 42 | 11 | 1 | 2.28 | 37 | 17.24 | 8 | 15.70 | Postero-medial STG | 41 |
| R | −48 | −12 | −12 | 4 | 5.78 | 27 | 16.14 | 16 | 12.76 | Anterior STG/TPole | 38 |
| L | 43 | −6 | −16 | 7 | 6.23 | 16 | 14.96 | 15 | 12.94 | Anterior STG/TPole | 38 |
| R | −29 | 15 | −11 | 11 | 7.45 | 61 | 19.04 | 57 | 7.29 | ParaG/Hippocampus | |
| R | −59 | 23 | 3 | 16 | 8.58 | 2 | 11.52 | 3 | 23.98 | Lateral STG/STS | 22/21 |
| L | 53 | 0 | −6 | 17 | 8.59 | 17 | 14.96 | 12 | 14.02 | Anterior STG/TPole | 21 |
| L | 55 | 15 | 2 | 23 | 10.44 | 1 | 10.50 | 1 | 24.73 | Lateral STG/STS | 22/21 |
| L | 16 | 26 | −8 | 25 | 10.82 | 23 | 15.84 | 34 | 9.39 | Parahippocampal Gyrus | 35 |
| L | 52 | 36 | 6 | 30 | 11.43 | 15 | 14.79 | 11 | 14.73 | Postero-lateral STG | 22 |
|
Frontal Lobe
| |||||||||||
| L | 29 | −26 | 3 | 2 | 4.46 | 3 | 11.64 | 19 | 12.06 | IFG (P. Orbitalis)/Insula | 45 |
| L | 44 | 8 | 41 | 10 | 7.44 | 4 | 12.05 | 30 | 10.20 | Precentral Gyrus | 4/6 |
| R | −42 | −12 | 17 | 13 | 8.10 | 19 | 15.14 | 55 | 7.57 | Insula/IFG (P. Opercularis) | 13/44/45 |
| R | −32 | −17 | 7 | 14 | 8.33 | 6 | 12.77 | 25 | 10.76 | Insula | 13 |
| L | 42 | −19 | 9 | 18 | 8.82 | 12 | 14.38 | 33 | 9.43 | IFG (P. Triangularis) | 44/45 |
| R | −54 | 9 | 40 | 19 | 9.19 | 14 | 14.68 | 36 | 9.25 | Precentral Gyrus | 3/4/6 |
| L | 5 | −1 | 48 | 20 | 9.47 | 5 | 12.24 | 10 | 15.02 | Medial Frontal Gyrus | 6 |
| L | 35 | −10 | 7 | 26 | 11.20 | 31 | 16.86 | 60 | 6.55 | Insula/IFG (P. Triangularis) | 13/44 |
| R | −50 | −11 | 23 | 28 | 11.29 | 25 | 15.89 | 59 | 6.63 | IFG (P. Triangularis) | 44/45 |
|
Occipital Lobe
| |||||||||||
| R | −40 | 84 | 2 | 3 | 5.65 | 91 | 21.57 | 48 | 8.10 | Middle Occipital Gyrus | 18 |
| L | 24 | 66 | −11 | 5 | 5.95 | 36 | 17.23 | 43 | 8.33 | Fusiform Gyrus/Declive | 19 |
| L | 6 | 80 | −5 | 8 | 6.68 | 9 | 13.57 | 14 | 13.01 | Lingual Gyrus | 17/18 |
| L | 19 | 83 | 11 | 12 | 7.67 | 24 | 15.85 | 21 | 11.94 | Cuneus | 17/18 |
| R | −23 | 86 | 17 | 22 | 10.44 | 53 | 18.47 | 23 | 10.96 | Middle Occipital Gyrus/Cuneus | 18 |
|
Parietal Lobe
| |||||||||||
| R | −49 | 26 | 52 | 21 | 10.39 | 97 | 22.50 | 52 | 7.86 | Postcentral Gyrus | 1/2 |
|
Subcortical Structures
| |||||||||||
| R | −28 | 32 | 11 | 9 | 6.73 | 92 | 21.69 | 18 | 12.29 | Caudate Tail | |
| L | 17 | 3 | 12 | 24 | 10.66 | 33 | 17.04 | 31 | 10.09 | Putamen | |
| R | −10 | 27 | −9 | 27 | 11.28 | 40 | 17.51 | 24 | 10.90 | Substantia Nigra/Culmen | |
| L | 24 | 28 | 15 | 29 | 11.30 | 86 | 21.08 | 35 | 9.27 | Thalamus | |
|
Cerebellum
| |||||||||||
| R | −12 | 63 | −19 | 6 | 6.04 | 17 | 13.94 | 6 | 17.58 | Declive/Fastigium/Culmen | |
| L | 8 | 58 | −16 | 15 | 8.49 | 44 | 16.63 | 22 | 11.02 | Declive | |
Abbreviations: STG=Superior Temporal Gyrus; TPole=Temporal Pole; STS=Superior Temporal Sulcus; IFG=Inferior Frontal Gyrus.
Figure 11.B shows the histogram and cumulative histogram of the aggregate Subject-Session r95 associated with all the local maxima in the Omnibus map for the Listen condition. Note that the aggregate Subject-Session r95 histogram is displaced toward the right relative to the Group-Session r95 histogram (Figure 11.A). Table 4 presents information about the 30 most spatially reproducible aggregate Subject-Session peaks, also superimposed on the corresponding aggregate Subject-Session map in Figure 9.
TABLE 4.
Thirty most reliable local maxima in the overall results for the Listen condition according to the aggregate Subject-Session r95. Within each macro-anatomical region (e.g., temporal lobe, frontal lobe, etc.) the peaks are sorted by increasing 95% reliability distance.
| Side | Talairach [mm] | GRP-r95 | SSB-r95 | Intensity | Anatomical Label | BA | |||||
|---|---|---|---|---|---|---|---|---|---|---|---|
| RL | AP | IS | Rnk | mm | Rnk | mm | Rnk | T | |||
|
Temporal Lobe
| |||||||||||
| L | 55 | 15 | 2 | 23 | 10.44 | 1 | 10.50 | 1 | 24.73 | Lateral STG/STS | 22/21 |
| R | −59 | 23 | 3 | 16 | 8.58 | 2 | 11.52 | 3 | 23.98 | Lateral STG/STS | 22/21 |
| R | −62 | 13 | 2 | 36 | 12.79 | 7 | 12.83 | 5 | 19.01 | Lateral STG/STS | 22/21 |
| L | 63 | 10 | −2 | 55 | 15.76 | 10 | 13.74 | 27 | 10.46 | Lateral STG | 21 |
| L | 52 | 36 | 6 | 30 | 11.43 | 15 | 14.79 | 11 | 14.73 | Postero-lateral STG | 22 |
| L | 43 | −6 | −16 | 7 | 6.23 | 16 | 14.96 | 15 | 12.94 | Anterior STG/TPole | 38 |
| L | 53 | 0 | −6 | 17 | 8.59 | 17 | 14.96 | 12 | 14.02 | Anterior STG/TPole | 21 |
| R | −65 | 31 | 9 | 33 | 11.91 | 22 | 15.67 | 9 | 15.19 | Postero-lateral STG | 42/22 |
| L | 16 | 26 | −8 | 25 | 10.82 | 23 | 15.84 | 34 | 9.39 | Parahippocampal Gyrus | 35 |
| R | −48 | −12 | −12 | 4 | 5.78 | 27 | 16.14 | 16 | 12.76 | Anterior STG/TPole | 38 |
| R | −50 | 36 | 11 | 62 | 17.03 | 29 | 16.48 | 7 | 16.98 | Postero-medial STG | 41 |
|
Frontal Lobe
| |||||||||||
| L | 29 | −26 | 3 | 2 | 4.46 | 3 | 11.64 | 19 | 12.06 | IFG (P. Orbitalis)/Insula | 45 |
| L | 44 | 8 | 41 | 10 | 7.44 | 4 | 12.05 | 30 | 10.20 | Precentral Gyrus | 4/6 |
| L | 5 | −1 | 48 | 20 | 9.47 | 5 | 12.24 | 10 | 15.02 | Medial Frontal Gyrus | 6 |
| R | −32 | −17 | 7 | 14 | 8.33 | 6 | 12.77 | 25 | 10.76 | Insula | 13 |
| L | 35 | −29 | −5 | 47 | 14.59 | 8 | 13.03 | 32 | 9.74 | IFG (P. Orbitalis) | 47 |
| R | −43 | −19 | 5 | 39 | 13.38 | 11 | 14.23 | 46 | 8.16 | IFG (P. Triangularis/P. Opercularis) | 45 |
| L | 42 | −19 | 9 | 18 | 8.82 | 12 | 14.38 | 33 | 9.43 | IFG (P. Triangularis) | 44/45 |
| R | −54 | 9 | 40 | 19 | 9.19 | 14 | 14.68 | 36 | 9.25 | Precentral Gyrus | 3/4/6 |
| R | −42 | −12 | 17 | 13 | 8.10 | 19 | 15.14 | 55 | 7.57 | Insula/IFG (P. Opercularis) | 13/44/45 |
| R | −50 | −11 | 23 | 28 | 11.29 | 25 | 15.89 | 59 | 6.63 | IFG (P. Triangularis) | 44/45 |
| L | 46 | −17 | 19 | 34 | 11.91 | 26 | 16.12 | 38 | 9.13 | IFG (P. Triangularis) | 44/45 |
|
Occipital Lobe
| |||||||||||
| L | 6 | 80 | −5 | 8 | 6.68 | 9 | 13.57 | 14 | 13.01 | Lingual Gyrus | 17/18 |
| R | −1 | 82 | 2 | 46 | 14.58 | 13 | 14.40 | 44 | 8.31 | Lingual Gyrus | 17/18 |
| R | −16 | 88 | 5 | 51 | 15.35 | 21 | 15.31 | 13 | 13.41 | Lingual Gyrus/Cuneus | 17 |
| L | 19 | 83 | 11 | 12 | 7.67 | 24 | 15.85 | 21 | 11.94 | Cuneus | 17/18 |
|
Limbic Lobe
| |||||||||||
| R | −8 | −11 | 33 | 43 | 13.85 | 28 | 16.36 | 58 | 6.80 | Cingulate Gyrus | 24/32 |
|
Subcortical Structures
| |||||||||||
| L | 24 | 7 | −8 | 52 | 15.52 | 20 | 15.23 | 62 | 6.28 | Amygdala/ParaG/Putamen | |
| R | −19 | 0 | −6 | 57 | 16.24 | 30 | 16.53 | 104 | 4.09 | Putamen | |
|
Cerebellum
| |||||||||||
| R | −12 | 63 | −19 | 6 | 6.04 | 18 | 15.01 | 6 | 17.58 | Declive/Fastigium/Culmen | |
Abbreviations: STG=Superior Temporal Gyrus; STS=Superior Temporal Sulcus; TPole=Temporal Pole; ParaG=Parahippocampal Gyrus.
DISCUSSION
In this study we have evaluated the reproducibility of fMRI activations associated with an auditory sentence comprehension task with high attention demands in the whole brain. The task demanded from the subjects recruited a distributed bilateral network with processing nodes located in lateral temporal cortex, inferior frontal cortex, medial BA6, medial occipital cortex and subcortical structures such as the putamen and the thalamus. Reproducibility of these activations at the group level was high, indicating that sites of neuronal activity associated with auditory comprehension can reliably be detected with fMRI in healthy subjects, across repeated measures after group averaging. At the single-subject level reproducibility ranged from moderate to high, although no significant differences were found on behavioral measures across subjects or sessions. This result suggests that contextual differences—i.e., those specific to each imaging session, can modulate our ability to detect fMRI activations associated with speech comprehension in individual subjects.
Behavioral Performance
Behaviorally, our task proved to be stable across sessions. No significant differences between sessions were found in terms of either percentage of correct responses or response times. These results suggest that task habituation across imaging sessions, if present, is not significant and can be eliminated as a potential confound in the analysis of the imaging data. A lack of habituation effect is a desirable property for any task to be used for longitudinal studies. Additionally, this finding is consistent with our prior expectation of little to no habituation, given the use of novel stimuli across all five imaging sessions, the conceptual simplicity of the task and the pre-imaging practice session conducted with the subjects outside the scanner.
Scanner Quality Assurance
Of critical importance to the evaluation of all fMRI data in this work, no data were found to suggest that the MRI hardware had exhibited any instabilities over the course of the data collection for this work.
Task-Based fMRI Activation
Before considering the reproducibility results, we will discuss the most consistent activations and briefly address their putative functional role as a means to justify their reproducible observation. During the Listen condition participants were required to attend to everyday sentences delivered via pneumatic headphones. While listening to the sentences, subjects were aware of the fact that they were subsequently going to be questioned about these sentences. For a task like this, it is reasonable to expect activations in areas involved in speech recognition (from auditory analysis to syntactic and semantic levels), short-term working memory (particularly encoding), and attention control (so that subjects could concentrate on the sentences instead of the background imaging acoustic noise). All such regions were reliably detected at all analysis levels.
Large extents of both the dorsal and ventral streams of speech processing (Hickok and Poeppel, 2004; Saur et al., 2008; Scott et al., 2000) were consistently recruited for the Listen condition as evidenced by the Group-Session and aggregate Subject-Session overlap maps. In fact, a high percentage of the local maxima identified as highly spatially reliable fall within the boundaries of these two streams—e.g., peaks 1, 2, 7, 10, 17, 18, 23, 26 and 30 in for Group-Session results (Figure 7); peaks 1, 3, 4, 10, 12, 15, 16, 17, 26 for the aggregate Subject-Session results (Figure 9). Moreover, both streams seem to be recruited not only at their initial stages, but all the way to their late regions. For the ventral stream, consistent activations for the Listen condition in late regions include left anterior temporal lobe (ATL), left posterior end of the middle temporal gyrus (MTG) and the left inferior frontal cortex (IFC). For the dorsal stream, late activations include both motor and pre-motor frontal locations that exhibit good agreement with those identified by Saur et al. (2008) as the frontal targets of the dorsal communication pathways originating in the superior temporal gyrus.
In addition to the regions discussed above, two of the largest consistent activation clusters reside within the left medial supplementary motor cortex (medial BA 6), and bilateral medial superior cerebellum and adjacent visual cortex (BA 17/18). Medial BA 6, although traditionally regarded as a supplementary motor area, is often reported as significant during non-motor cognitive tasks with working memory demands (Dehaene et al., 1996; Lawrence et al., 2009; Peretz et al., 2009; Tanaka et al., 2005). Recent experimental evidence shows that medial BA6 might play an important role in verbal working memory (Chung et al., 2005; Tanaka et al., 2005). Yet, more traditional functions for medial BA 6, such as eye movement (Haxby et al., 2000) or preparation for button pressing (Cunnington et al., 2002), cannot be discarded.
The consistent activation within medial visual cortex and adjacent cerebellar regions is a common finding in studies of speech comprehension under noisy conditions (Binder et al., 2004; Bishop and Miller, 2009; Caceres et al., 2009; Salvi et al., 2002; Wong et al., 2008; Zekveld et al., 2006). In the present study, as no sparse acquisition techniques were implemented—e.g., (Edmister et al., 1999; Hall et al., 1999)—acoustic stimuli of interest were delivered concomitant with imaging acoustic noise. Previous literature has shown that relative to listening to speech in quiet, listening to speech in noise resulted in recruitment of additional neuronal resources not only within cerebellum and adjacent visual cortex (Zekveld et al., 2006), but also within basal ganglia and cingulate gyrus (Binder et al., 2000; Salvi et al., 2002; Wong et al., 2008). In the present study, highly reproducible activations were present in all these anatomical structures both for the group and single-subject level—i.e., all regions had voxels with Group Session Roverlap = 100% (Figure 7) and aggregate Subject-Session Roverlap > 70% (Figure 9).
Task-Based fMRI Activation Reproducibility
As noted previously, the primary goal of this work was to study the reproducibility of whole brain fMRI activations for an auditory sentence comprehension task with high attention demand under “static” conditions—i.e., absence of any experimental manipulation, stable hardware (as evidenced by the QA results), no caffeine consumption, and well-rested subjects. The reproducibility of three different aspects of fMRI-observed activations was evaluated—namely statistically thresholded maps, effect magnitude, and the spatial distribution of local maxima—at both the group and single-subject level. Overall, results demonstrate high reproducibility of all three aspects of activations for the group-level analysis. For single subjects, reproducibility is moderate and varies as a function of subject and anatomical region.
Reproducibility of Statistically Thresholded Maps of Activation – Group Level
Using a statistical threshold of pFDR<0.005, over 80% of the intracranial imaged voxels were given the same binary (active/inactive) classification in all five imaging sessions (Group-Session Rcc=83.95%). The remaining 16.05% of voxels represent areas with some degree of uncertainty—i.e., active in one, two, three or four occasions. These areas are mostly restricted to the perimeter surround of the “always active” areas. This pattern, commonly found in the literature when comparing across sessions (Rombouts et al., 1997), suggests that, at the group level, brain regions are not randomly recruited at isolated occasions, but rather that areas of uncertainty are mainly the result of variability in the extent of the activation clusters.
Exceptions to this rule were observed in bilateral angular gyrus/superior parietal lobule and right middle frontal gyrus (black circles in Figure 7). Both locations contain small clusters of voxels classified as significantly active for a maximum of two occasions that appear isolated from regions of higher reproducibility. These exception clusters were found to be a consequence of a high probability of activation for a reduced set of subjects combined with low-to-moderate probability of activation for the remainder of the group, and thus exemplify the importance of characterizing baseline binary activation maps for longitudinal studies on the basis of more than a single pre-manipulation scanning occasion, even when averaging across subjects.
To avoid cases where inconsistent probability of activation on a between-subject basis might skew conclusions drawn from a longitudinal group study involving manipulation, at least two options are available. One option would be to perform a reliability study, as per this present work, to evaluate the reproducibility of activations for the task of interest in the absence of the manipulation. This would identify areas of uncertainty within which reorganization cannot be explored solely in terms of changes in the pattern of significant activation. A second option is use of more detailed analysis, such as statistical comparisons of the actual magnitudes during pre- and post-manipulation—i.e., paired t-test—but even in this case, before any conclusions are drawn, it would be necessary to prove that no statistical difference would be detected between any two sessions in the absence of the manipulation (see Reproducibility of Magnitude of Activation section below).
Reproducibility of Statistically Thresholded Maps of Activation – Single-Subject Level
Using a statistical threshold of pFDR<0.005, the individual Subject-Session Rcc was found to exhibit a mean ± SD = 58.65% ± 10.68% (range: 31.40-76.47%; median = 55.97%). This mean (and range) is lower than that observed for the Group-Session results, confirming that reproducibility of binary activation maps is higher for group analyses. In addition, the large range of observed individual Subject-Session Rcc values demonstrates that reproducibility can vary greatly across subjects even when experimental conditions do not change and the hardware is stable.
Among factors that might contribute to variability in Rcc, it should be noted that a trend level (p=0.07) relationship was observed with mean response time, suggesting that cognitive strategy might be an explanatory factor. This is plausible given that subjects did not receive any guidelines regarding how to approach the task. Note that provision of cognitive strategy guidelines, although a potential factor that may decrease between-subject differences, was not implemented given that actual use of the suggested strategy by the subjects could not be meaningfully monitored.
The possibility that differences in cognitive strategy across subjects contributed to the observed variation in activity is also supported by comparison of the patterns of activation overlap at the group and single-subject levels (i.e., Figures 7 and 9, respectively). Detailed comparison of the activation overlap maps reveals four distinct activation patterns across the brain. The first activation pattern corresponds to regions that were consistently activated both within- and between-subjects. In the overlap maps, these regions are identified by clusters with high probability of activation both at the single-subject level (aggregate Subject-Session Rcc ≥ 80%; yellow and orange regions in Figure 9) and the group-level (Group-Session Rcc ≥ 80%; yellow and orange regions in Figure 7). Given their combined high within- and between-subject probability of activation, it can be suggested that these regions present little or no dependency on the specific cognitive strategy selected by a given subject. For the Listen condition these regions include bilateral temporal cortex, bilateral inferior frontal cortex (although mainly in the left hemisphere), left medial BA6, bilateral medial occipital cortex and adjacent cerebellar cortex.
The second activation pattern, apparent in the left parahippocampal gyrus and the left putamen, corresponds to regions with high within-subject probability of activation for a large percentage of subjects, but moderate or low for the rest (i.e., subject-dependent individual Subject-Session Rcc; see Supplementary Figure 1). In the aggregate Subject-Session overlap map they appear as moderately reproducible (between 50% and 70%; pink and magenta in Figure 9), while in the Group-Session map they appear as highly reproducible (≥ 80%; yellow and orange regions in Figure 7).
The third pattern, apparent in the bilateral angular gyrus/superior parietal lobule and the right middle frontal gyrus, is similar to the second, but in this case the number of subjects with high within-subject activation probability is lower (i.e., low individual Subject-Session Rcc; see Supplementary Figure 2) and the region no longer renders consistent activation across sessions at the group level (Group-Session Rcc between 20% and 40%; blue and green in Figure 7, black circle). We hypothesize that regions consistent with this and the preceding pattern–consistently recruited by some subjects, and rarely or never recruited by the remaining participants—may correspond with cortical resources that are recruited as a consequence of cognitive strategy.
Finally the fourth pattern refers to the perimeter of low probability of activation that surrounds the areas of high probability in both the aggregate Subject-Session (Figure 9) and the Group-Session (Figure 7) overlap maps. These regions result from variability in the extent of consistent activation across sessions. Such variability is clearly larger for the single-subject results which present a wider perimeter than the group-level results.
Reproducibility of Statistically Thresholded Maps of Activation – Comparison to Literature
A direct quantitative comparison of Roverlap (e.g., Table 2) across studies is difficult given differences in task, hardware, analysis methodology, statistical threshold, volume considered in the analysis, subject demographics, number of sessions and/or elapsed time between sessions. Nonetheless, Roverlap provides a valuable means to qualitatively compare the reproducibility of the auditory sentence comprehension task presented here with that of previously published cognitive and sensory tasks (Table 5).
TABLE 5.
Summary of previous fMRI reliability studies that used ratio of volume overlap as defined by Rombouts et al. (1997) to evaluate reliability of fMRI activations. To generate this table we inspected all journal articles that cited both seminal works by Rombouts et al. (1998; 1997) according to the “ISI Web of Knowledge” (http://www.isiknowledge.com). Only papers that evaluated reliability on healthy subjects across sessions conducted on different days are included in the table. For articles that reported more than one ratio associated with a given contrast, only the higher reported value for that contrast is included in this table. Rows with white background correspond to studies that reported Roverlap for single-subject results, while rows with light blue background correspond to studies that reported Roverlap for group results.
| Reference | Bo [T] | Subjects* | Sessions | Time Between Sessions |
Age [years] | Block / Event | Threshold | Task/Stimuli | Roverlap [Mean ± SD] |
ROI |
|---|---|---|---|---|---|---|---|---|---|---|
| (Rombouts et al., 1997) | 1.5 | 17 | 2 | 1-3w | 19-33 | B | r > 0.5 | Flashing Lights | 0.31±0.11 | Visual Cortex |
|
| ||||||||||
| (Rombouts et al., 1998) | 1.5 | 10 | 2 | 1h-2w | 22.1 | B | pBonf<0.05 | Flashing Lights | 0.64±0.09 | Visual Cortex |
|
| ||||||||||
| (Machielsen et al., 2000) | 1.5 | 10 | 2 | 3-24d | 19-30 | B | pCorr<0.05 | Visual Encoding of Pictures | 0.36 ± 0.16 | Whole Brain |
| 0.21 ± 0.23 | Anterior MTL | |||||||||
| 0.51 ± 0.18 | Posterior MTL | |||||||||
| 0.40 ± 0.25 | Hippo. MTL | |||||||||
|
| ||||||||||
| (Miki et al., 2000) | 1.5 | 7 | 2 | 2-7d | 22-27 | B | pCorr<0.05 | Flashing Lights | 0.49 ± 0.30 | Visual Cortex |
|
| ||||||||||
| (Hagenbeek et al., 2002) | 1.5 | 9 | 2 | 5d-7w | 21-26 | B | pUnc<10−10 | Flashing Lights | 0.94 (0.83-0.99)††† | Visual Cortex |
|
| ||||||||||
| (Chee et al., 2002) | 2 | 16 | 2 | 1w | 21-27 | B | - | Semantic Assoc. Judgment (LF) | 0.41 ± 0.05† | Left IFG |
| Semantic Assoc. Judgment (HF) | 0.30 ± 0.06† | |||||||||
| Semantic Assoc. Judgment (LF) | 0.35 ± 0.07† | Left MFG | ||||||||
| Semantic Assoc. Judgment (HF) | 0.28 ± 0.07† | |||||||||
|
| ||||||||||
| (Specht et al., 2003) | 1.5 | 5 | 2 | - | 28 | E | pUnc<0.01 | Visual (Ignore) | 0.42 ± 0.23 | Whole Brain |
| Visual (Attend) | 0.69 ± 0.08 | |||||||||
| Visual (Discriminate) | 0.64 ± 0.09 | |||||||||
|
| ||||||||||
| (Swallow et al., 2003) | 1.5 | 10 | 2 | - | 20-51 | B | pUnc <0.001 |
Eye Motion (Saccades) | 0.52 (0.10)** | FEF |
| Moving Dots | 0.42 (0.10)** | MT+ | ||||||||
|
| ||||||||||
| (Vlieger et al., 2003) | 1.5 | 12 | 2 | - | 22-48 | B | pUnc<0.05 | Flickering Checkerboard | 0.51 ± 0.20 | Occipital Cortex |
|
| ||||||||||
| (Wagner et al., 2005) | 1.5 | 9 | 2 | 210- 308d |
26±6.1 | B | pUnc<0.05 | Memory Encoding: Word Pairs | 0.27 ± 0.09 | Whole Brain |
| Recognition: Word Pairs | 0.35 ± 0.11 | |||||||||
| Memory Encoding: Word Pairs | 0.18 ± 0.15 | Medial Temporal | ||||||||
| Recognition: Word Pairs | 0.21 ± 0.15 | |||||||||
|
| ||||||||||
| (Harrington et al., 2006a)* | 1.5 | 10 | 2 | 4-53w | 34.7 | B | pCorr<0.05 | Verb Generation | 0.45†† | Inferior Frontal |
| Confrontation Naming | 0.28†† | |||||||||
| Semantic Decision | 0.18†† | |||||||||
| Audio Sentence Comprehension | 0.12†† | |||||||||
| Visual Sentence Comprehension | 0.30†† | Temporo-Parietal | ||||||||
| Story Listening | 0.35†† | |||||||||
|
| ||||||||||
| (Harrington et al., 2006b)* | 1.5 | 9 | 2 | 1-14w | 32.1±9.5 | B | pCorr<0.05 | Memory Encoding: Word Pairs | 0.35 ± 0.20 | Left Inferior Frontal |
| Mem. Encod.: Abstract Patterns | 0.40 ± 0.25 | Right Fusiform | ||||||||
| Memory Encoding: Scenes | 0.70 ± 0.10 | Gyrus | ||||||||
|
| ||||||||||
| (Havel et al., 2006)** | 1.5 | 15 | 3 | 2-16d | 29.2 | B | pCorr<0.05 | Hand Motion | 0.78 ± 0.26 | Paracentral Lobule |
| Foot Motion | 0.62 ± 0.21 | Precentral Gyrus | ||||||||
| Mouth Motion | 0.24 ± 0.17 | Postcentral Gyrus | ||||||||
| Tongue Motion | 0.51 ± 0.18 | Postcentral Gyrus | ||||||||
|
| ||||||||||
| (Schacher et al., 2006) | 1.5 | 12 | 2 | 1-8w | - | B | pUnc<0.01 | Fearful Faces Vs. Landscape | 0.46 ± 0.19 | Amygdala |
|
| ||||||||||
| (Raemaekers et al., 2007) | 1.5 | 12 | 2 | 1w | 22.1±1.75 | B | pUnc< 0.001 |
Prosaccades | 0.76 | Whole Brain |
| Antisaccades | 0.81 | |||||||||
| Prosaccades vs. Antisaccades | 0.27 | |||||||||
|
| ||||||||||
| (Rau et al., 2007) | 1.5 | 13 | 3 | 3-35d | 18-40 | B | pCorr<0.05 | Picture Naming | 0.0 (0.0-0.6)††† | Left Pars |
| Pict. Naming + Noun Generation | 0.49 (0.15-0.82)††† | Opercularis | ||||||||
|
| ||||||||||
| (Clement and Belleville, 2009) | 3 | 10 | 2 | 6w | 71.2±7.25 | B |
pUnc< 0.005 |
Verbal Memory Encoding | 0.39 | Whole Brain |
| Verbal Memory Retrieval | 0.71 | |||||||||
| Phonological Processing | 0.45 | |||||||||
| Phonological Proc. + Motor Task | 0.71 | |||||||||
Number of subjects included in the reliability computations, which might differ from the number of scanned subjects
Data was originally reported as Jaccard coefficients. Value in parenthesis is the standard error. Transformation to Roverlap was performed according to (Clement and Belleville, 2009)
Approximate values extracted from bar plots (figure 1 from (Harrington et al., 2006a); figure 4 from (Harrington et al., 2006b))
Variation expressed as Mean Standard Error
No Standard Deviation available
No Standard Deviation available. Data reported as: Mean (Range of Values)
Abbreviations: h=hours; d=days; w=weeks; T=Tesla; SD=Standard Deviation; MTL=Medial Temporal Lobe; LF=Low Frequency; HF=High Frequency; IFG=Inferior Frontal Gyrus; MFG=Middle Frontal Gyrus; FEF=Frontal Eye Fields; MT+=MT Complex.
For the most stringent threshold, pFDR<0.005, the averaged Roverlap for the individual Subject-Session results was 0.69 ± 0.09. This value is above all other Roverlap for single-subject results included in Table 5 with the exception of a value of 0.78 ± 0.26 for a hand motor task (Havel et al., 2006), 0.70 ± 0.26 for a visual scene encoding task (Harrington et al., 2006b), and 0.94 for a visual stimulation task (Hagenbeek et al., 2002). While two of these values—hand motor (Havel et al., 2006) and scene encoding (Harrington et al., 2006b)—are slightly higher; they correspond to analyses confined to specific regions of interest associated with the task. In contrast, the values in this study are computed taking into account activations in the whole imaged volume. Machielsen et al. (2000) previously reported an increase of 5% to 15% for the Roverlap when only areas of expected activation are included in the analysis. The only value well above our results is the one reported by Hagenbeek et al. (2002) for visual stimulation with flashing LED goggles; a task considerably less cognitively complex than the one under consideration here.
Regarding the Roverlap for group results, we reported a Group-Session value of 0.79 ± 0.01 for the most stringent threshold (pFDR<0.005). This value is above all Roverlap reported for group results in Table 5, with the exception of a value of 0.81 for the antisaccades task (Raemaekers et al., 2007). Overall, these results argue for good reliability of the Listen condition as compared to previous fMRI reliability studies that implemented Roverlap.
Reproducibility of Magnitude of Activation
Volumetric variance ratio maps (Figure 10) were used to evaluate the reproducibility of voxel-wise magnitude and uncover the spatial distribution of the contribution of three types of variance present in the data, namely between-session (), between-subject () and residual variance ().
The RVbet-ses map (Figure 10.B) revealed that the contribution of between-session variance to the total variance was minor across the whole imaged brain. For 99% of the imaged volume, between-session variance only accounted for less than 10% of the total variance (RVbet-ses < 0.1), while for the rest of the volume it never reached 20% (RVbet-ses < 0.2). This result has important implications regarding the validity of characterizing typical responses to the Listen condition from a single observation.
According to McGonigle et al. (2000), conclusions regarding the representative response to a given condition can only be made on the basis of a single observation under the assumption of negligible intersession variability. The almost negligible contribution of between-session variance to the total variance in 99% of the imaged brain suggests that potential longitudinal studies with the Listen condition could use a single pre-manipulation session to obtain the representative group response prior to the introduction of the experimental manipulation. To test this claim we conducted ten independent paired T-tests, one for each possible pair-wise session combination (S01 – S02, S01 – S03, and so on) providing as input the mean IRFs to the Listen condition. No voxels rendered themselves significant at pFDR < 0.005 or pFDR < 0.05 for any of the ten independent paired T-test analyses. This finding confirms that under static conditions, Group-Session results for the Listen task show no significant differences in magnitude of activation in the absence of any external manipulation. Nevertheless it is worth noting that this might only apply to experimental settings that closely match the one described here. Any discrepancy, such as elimination of the caffeine restriction, different hardware, a drastic change in subject demographics, etc., might have an important effect on the reproducibility of activations that would need to be addressed.
The second variance ratio of interest computed here was the voxel-wise RVbet-sbj (Figure 10.A), which corresponds to the most prominent intra-class correlation index (ICC) in fMRI literature (Caceres et al., 2009; Raemaekers et al., 2007; Specht et al., 2003; Wei et al., 2004). As a ratio of between-subject variance to the total variance, the RVbet-sbj is a measure of the absolute agreement of subject activations from session to session relative to the heterogeneity of the sample (McGraw and Wong, 1996). In other words, the RVbet-sbj map helps us identify regions of high individual reliability of magnitude across sessions independently of their status (active/inactive) in the group results.
For the Listen condition, regions with high RVbet-sbj cover large portions of the bilateral temporal cortex, inferior frontal cortex, medial occipital cortex, adjacent cerebellar cortex, medial BA 6, putamen as well as some inferior parietal and posterior cingulate regions (Figure 10.A). Most of these regions share a high probability of activation at the group level (see Supplementary Figure 3 for an overlay) and therefore establish themselves as consistent not only in terms of their binary classification as either active or inactive, but also as regions with consistent within-subject magnitudes relative to the heterogeneity of the sample. Moreover the large percentage of overlap between areas of high RVbet-sbj and high group-T across repeated sessions confirms the previous finding by Caceres et al. (2009) of a formal relationship between group T-statistics and the RVbet-sbj index, in which regions with high group statistics tend to have high RVbet-sbj. Those areas with high RVbet-sbj but low group T-statistic (e.g., the inferior parietal or the posterior cingulate for the Listen condition) are of special interest in the context of longitudinal studies. Given their high intrasubject reliability these areas can be confidently targeted by longitudinal studies on an individual basis, and should not be excluded from conclusions on the basis of no significant activation at the group level; yet their analysis ought to be performed on an individual basis and their timeseries inspected closely to evaluate if signal changes that correlate with experimental task do exist. As Caceres et al. (2009) demonstrated, the low group statistic associated with these areas can be the result of a consistent, but low amplitude, fitting to the response model. An experimentally controlled manipulation could potentially modulate the relationship of these regions to the task, yet if decisions are only based on their appearance as significant at the group level, subtle yet consistent reorganization patterns associated with the experimental modulation could remain unidentified.
Finally, the ratio of residual variance to the total variance (RVres; Figure 10.C) shows that the voxels with greater unexplained variance tend to be concentrated outside of grey matter in areas such as the ventricles, white matter tracts or the edges of the brain. fMRI signal changes observed in these regions are commonly brought about by undesired changes in signal that arise from sources such as respiration, cardiac rhythms and/or field inhomogeneities. All of these are noise sources not modeled in the regression analysis, and, as such, any variance contribution from these sources ends up in the residual variance. Grey matter areas with the highest unexplained variance are concentrated primarily in small subcortical structures such as the hippocampus and in the medial posterior portion of the post-central gyrus. The former may be a function of proximity to susceptibility artifacts associated with the sinuses, whereas the latter is of unknown origin at this time.
Reproducibility of Peak Location
Reproducibility of the distribution of local maxima observed in the Omnibus results was better (i.e., lesser values of r95) for the Group-Session results (Table 3) than for the aggregate Subject-Session results (Table 4). The aggregate Subject-Session r95 histogram (Figure 11.B) reveals that none of the peaks from the canonical template can consistently be observed within a radius of 3.75mm (within the same voxel) and only one peak can be consistently found within 11.25mm (equivalent to three original voxels). Conversely, in the Group-Session activation maps one peak can consistently be found at the same voxel ([40, 42, 11] within Wernicke’s area) and for a radius of 11.25mm (within three voxels) the number of peaks that are within that distance increases to 26 (Figure 11.A).
Regarding the distribution of spatially reliable peaks across different anatomical structures, three regions stand out. We found that, both for the Group-Session and the aggregate Subject-Session results, peaks with the highest spatial reproducibility—i.e., those with a lesser r95—tend to concentrate within temporal and frontal cortex. These areas are expected for an auditory comprehension task and their corresponding r95 values augment the previous discussion of reproducibility of magnitude and binary classification (active/inactive) for these two macro-anatomical regions in association with the Listen condition. The next region exhibiting multiple reliable peaks is the medial occipital cortex and adjacent cerebellar cortex, supporting the earlier argument related to the importance of these regions in auditory comprehension under noisy conditions.
From the perspective of repeated measures—i.e., longitudinal studies—these results suggest that tracking of local maxima across sessions to evaluate underlying cortical reorganization associated with some sort of experimental manipulation is possible, but that each peak may require a different displacement threshold (e.g., see Tables 3 and 4) for a shift to be considered a result of the manipulation and not simply a consequence of normal variability. Although a displacement greater than the r95 for a given peak does not entail cortical reorganization, the opposite is true, meaning that peak displacements below the r95 observed for the Listen condition should not be considered indicative of any cortical reorganization associated with any potential experimental manipulation.
CONCLUSIONS
In this study we have evaluated the reproducibility of fMRI activations associated with an auditory sentence comprehension task with high attention demands. Reproducibility of binary maps of activity/inactivity at the group level is high, with 83.95% of the total imaged volume being consistently classified as active/inactive across the five imaging sessions. This elevated consistency suggests that auditory sentence comprehension tasks with high attention demand are good candidates for the longitudinal study of speech using fMRI. Evaluated at the single-subject level, this study demonstrates that results can achieve levels of reproducibility comparable with group-level analysis, but that such agreement only occurs for limited cases. As a result, a single imaging session cannot always be considered representative of the typical response of a subject, and multiple pre-manipulation sessions are recommended if individual results are to be included as part of a longitudinal study or are to be evaluated for clinical purposes.
Supplementary Material
SUPPLEMENTARY FIGURE 1: Right medial view of all individual Subject-Session activation overlap maps. The outer perimeter of regions within the right putamen and the right parahippocampal gyrus that showed high consistency of activation at the group level but moderate to low consistency of activation at the single-subject level is depicted in black. These areas show high probability of activation for a large number of subjects (Right Putamen: Sbj01, Sbj02, Sbj09, Sbj10, Sbj11, Sbj12, Sbj13, Sbj14, Sbj15, Sbj16, Sbj17 ∣ Right Parahippocampal Gyrus: Sbj07, Sbj09, Sbj12, Sbj14, Sbj15, Sbj17) and moderate or low probability of activation for the rest of the group.
SUPPLEMENTARY FIGURE 2: Right lateral view of all individual Subject-Session activation overlap maps. The outer perimeter of isolated clusters of inconsistent group activations detected in the right angular gyrus/superior parietal lobule (rAG/SPL) and right middle frontal gyrus (rMFG) (circles in Figure 7) are depicted in black. These areas show high frequency of activation (> 80%) across sessions for a reduced number of subjects (rMFG: Sbj01, Sbj03, Sb17 ∣ rAG/SPL: Sbj06, Sbj14, Sbj15) but low or no activation for the rest of the group.
SUPPLEMENTARY FIGURE 3: Overlay of high RVbet-sbj voxels on top of the Omnibus results for the Listen condition and the Group-Session Overlap map. (A) Grey shadow represents voxels with RVbet-sbj > 0.8 in (A) and RVbet-sbj > 0.7 in (B). Voxel with high RVbet-sbj tend to overlap with significantly active voxels, but also extend beyond those areas (especially at RVbet-sbj>0.7). High RVbet-sbj non-significant voxels might result from a consistent, but low amplitude, fit to the response model. Given not all high RVbet-sbj non-significant voxels are expected to follow this pattern, the experimenter should carefully examine the voxel timeseries to evaluate if the voxel represents false negatives.
ACKNOWLEDGEMENTS
This research was supported in part by NIH grant R01EB003990 and a Purdue University Bilsland Dissertation Fellowship. The authors would also like to thank Dr. Gang Chen from the Scientific and Statistical Computing Core at the National Institute of Mental Health for his invaluable help during the review of this manuscript.
Grant Support: NIH Grant R01-EB003990
Footnotes
Publisher's Disclaimer: This is a PDF file of an unedited manuscript that has been accepted for publication. As a service to our customers we are providing this early version of the manuscript. The manuscript will undergo copyediting, typesetting, and review of the resulting proof before it is published in its final citable form. Please note that during the production process errors may be discovered which could affect the content, and all legal disclaimers that apply to the journal pertain.
REFERENCES
- Aron AR, Gluck MA, Poldrack RA. Long-term test-retest reliability of functional MRI in a classification learning task. Neuroimage. 2006;29:1000–1006. doi: 10.1016/j.neuroimage.2005.08.010. [DOI] [PMC free article] [PubMed] [Google Scholar]
- Binder JR, Frost JA, Hammeke TA, Bellgowan PS, Springer JA, Kaufman JN, Possing ET. Human temporal lobe activation by speech and nonspeech sounds. Cereb Cortex. 2000;10:512–528. doi: 10.1093/cercor/10.5.512. [DOI] [PubMed] [Google Scholar]
- Binder JR, Liebenthal E, Possing ET, Medler DA, Ward BD. Neural correlates of sensory and decision processes in auditory object identification. Nat Neurosci. 2004;7:295–301. doi: 10.1038/nn1198. [DOI] [PubMed] [Google Scholar]
- Bishop CW, Miller LM. A multisensory cortical network for understanding speech in noise. J Cogn Neurosci. 2009;21:1790–1805. doi: 10.1162/jocn.2009.21118. [DOI] [PMC free article] [PubMed] [Google Scholar]
- Bodurka J, Bandettini P. Real Time Software for Monitoring MRI Scanner Operations. 14th Annual Meeting of the Organization for Human Brain Mapping; Melbourne, AU. 2008. [Google Scholar]
- Boothroyd A, Hnath-Chisolm T, Hanin L, Kishon L. Voice fundamental frequency as an auditory supplement to the speechreading of sentences. Ear Hear. 1988;9:306–312. doi: 10.1097/00003446-198812000-00006. [DOI] [PubMed] [Google Scholar]
- Buss E, Pillsbury H, Buchman C, Pillsbury C, Clark M, Haynes D, Labadie R, Amberg S, Roland P. Multicenter U.S. bilateral MED-EL cocheal implantation study: speech perception over the first year of use. Ear Hear. 2008;29:20–32. doi: 10.1097/AUD.0b013e31815d7467. [DOI] [PubMed] [Google Scholar]
- Caceres A, Hall DL, Zelaya FO, Williams SCR, Mehta MA. Measuring fMRI reliability with the intra-class correlation coefficient. Neuroimage. 2009;45:758–768. doi: 10.1016/j.neuroimage.2008.12.035. [DOI] [PubMed] [Google Scholar]
- Chee MW, Hon NH, Caplan D, Lee HL, Goh J. Frequency of concrete words modulates prefrontal activation during semantic judgments. Neuroimage. 2002;16:259–268. doi: 10.1006/nimg.2002.1061. [DOI] [PubMed] [Google Scholar]
- Chung GH, Han YM, Jeong SH, Jack CR., Jr. Functional heterogeneity of the supplementary motor area. AJNR Am J Neuroradiol. 2005;26:1819–1823. [PMC free article] [PubMed] [Google Scholar]
- Clement F, Belleville S. Test-retest reliability of fMRI verbal episodic memory paradigms in healthy older adults and in persons with mild cognitive impairment. Hum Brain Mapp. 2009;30:4033–4047. doi: 10.1002/hbm.20827. [DOI] [PMC free article] [PubMed] [Google Scholar]
- Cox RW. AFNI: software for analysis and visualization of functional magnetic resonance neuroimages. Comput Biomed Res. 1996;29:162–173. doi: 10.1006/cbmr.1996.0014. [DOI] [PubMed] [Google Scholar]
- Cunnington R, Windischberger C, Deecke L, Moser E. The preparation and execution of self-initiated and externally-triggered movement: a study of event-related fMRI. Neuroimage. 2002;15:373–385. doi: 10.1006/nimg.2001.0976. [DOI] [PubMed] [Google Scholar]
- Dehaene S, Tzourio N, Frak V, Raynaud L, Cohen L, Mehler J, Mazoyer B. Cerebral activations during number multiplication and comparison: a PET study. Neuropsychologia. 1996;34:1097–1106. doi: 10.1016/0028-3932(96)00027-9. [DOI] [PubMed] [Google Scholar]
- Edmister WB, Talavage TM, Ledden PJ, Weisskoff RM. Improved auditory cortex imaging using clustered volume acquisitions. Hum Brain Mapp. 1999;7:89–97. doi: 10.1002/(SICI)1097-0193(1999)7:2<89::AID-HBM2>3.0.CO;2-N. [DOI] [PMC free article] [PubMed] [Google Scholar]
- Fernandez G, Specht K, Weis S, Tendolkar I, Reuber M, Fell J, Klaver P, Ruhlmann J, Reul J, Elger CE. Intrasubject reproducibility of presurgical language lateralization and mapping using fMRI. Neurology. 2003;60:969–975. doi: 10.1212/01.wnl.0000049934.34209.2e. [DOI] [PubMed] [Google Scholar]
- Friedman L, Glover G. Report on a multicenter fMRI quality assurance protocol. J Magn Reson Imaging. 2006;23:827–839. doi: 10.1002/jmri.20583. [DOI] [PubMed] [Google Scholar]
- Friedman L, Stern H, Brown GG, Mathalon DH, Turner J, Glover GH, Gollub RL, Lauriello J, Lim KO, Cannon T, Greve DN, Bockholt HJ, Belger A, Mueller B, Doty MJ, He J, Wells W, Smyth P, Pieper S, Kim S, Kubicki M, Vangel M, Potkin SG. Test-retest and between-site reliability in a multicenter fMRI study. Hum Brain Mapp. 2008;29:958–972. doi: 10.1002/hbm.20440. [DOI] [PMC free article] [PubMed] [Google Scholar]
- Giraud AL, Price CJ, Graham JM, Frackowiak RS. Functional plasticity of language-related brain areas after cochlear implantation. Brain. 2001;124:1307–1316. doi: 10.1093/brain/124.7.1307. [DOI] [PubMed] [Google Scholar]
- Giraud AL, Truy E. The contribution of visual areas to speech comprehension: a PET study in cochlear implants patients and normal-hearing subjects. Neuropsychologia. 2002;40:1562–1569. doi: 10.1016/s0028-3932(02)00023-4. [DOI] [PubMed] [Google Scholar]
- Giraud AL, Truy E, Frackowiak RS, Gregoire MC, Pujol JF, Collet L. Differential recruitment of the speech processing system in healthy subjects and rehabilitated cochlear implant patients. Brain. 2000;123(Pt 7):1391–1402. doi: 10.1093/brain/123.7.1391. [DOI] [PubMed] [Google Scholar]
- Gountouna VE, Job DE, McIntosh AM, Moorhead TW, Lymer GK, Whalley HC, Hall J, Waiter GD, Brennan D, McGonigle DJ, Ahearn TS, Cavanagh J, Condon B, Hadley DM, Marshall I, Murray AD, Steele JD, Wardlaw JM, Lawrie SM. Functional Magnetic Resonance Imaging (fMRI) reproducibility and variance components across visits and scanning sites with a finger tapping task. Neuroimage. 2010;49:552–560. doi: 10.1016/j.neuroimage.2009.07.026. [DOI] [PubMed] [Google Scholar]
- Hagenbeek RE, Rombouts SA, van Dijk BW, Barkhof F. Determination of individual stimulus--response curves in the visual cortex. Hum Brain Mapp. 2002;17:244–250. doi: 10.1002/hbm.10067. [DOI] [PMC free article] [PubMed] [Google Scholar]
- Hall DA, Haggard MP, Akeroyd MA, Palmer AR, Summerfield AQ, Elliott MR, Gurney EM, Bowtell RW. “Sparse” temporal sampling in auditory fMRI. Hum Brain Mapp. 1999;7:213–223. doi: 10.1002/(SICI)1097-0193(1999)7:3<213::AID-HBM5>3.0.CO;2-N. [DOI] [PMC free article] [PubMed] [Google Scholar]
- Harnish S, Neils-Strunjas J, Lamy M, Eliassen J. Use of fMRI in the study of chronic aphasia recovery after therapy: a case study. Topics in Stroke Rehabilitation. 2008;15:468–483. doi: 10.1310/tsr1505-468. [DOI] [PubMed] [Google Scholar]
- Harrington GS, Buonocore MH, Farias ST. Intrasubject reproducibility of functional MR imaging activation in language tasks. AJNR Am J Neuroradiol. 2006a;27:938–944. [PMC free article] [PubMed] [Google Scholar]
- Harrington GS, Farias S. Tomaszewski, Buonocore MH, Yonelinas AP. The intersubject and intrasubject reproducibility of FMRI activation during three encoding tasks: implications for clinical applications. Neuroradiology. 2006b;48:495–505. doi: 10.1007/s00234-006-0083-2. [DOI] [PubMed] [Google Scholar]
- Havel P, Braun B, Rau S, Tonn JC, Fesl G, Bruckmann H, Ilmberger J. Reproducibility of activation in four motor paradigms. An fMRI study. J Neurol. 2006;253:471–476. doi: 10.1007/s00415-005-0028-4. [DOI] [PubMed] [Google Scholar]
- Haxby JV, Petit L, Ungerleider LG, Courtney SM. Distinguishing the functional roles of multiple regions in distributed neural systems for visual working memory. Neuroimage. 2000;11:380–391. doi: 10.1006/nimg.2000.0592. [DOI] [PubMed] [Google Scholar]
- Hay-McCutcheon M, Pisoni D, Kirk K. Audiovisual speech perception in elderly cochlear implant recipients. Laryngoscope. 2005;115:1887–1894. doi: 10.1097/01.mlg.0000173197.94769.ba. [DOI] [PMC free article] [PubMed] [Google Scholar]
- Hickok G, Poeppel D. Dorsal and ventral streams: a framework for understanding aspects of the functional anatomy of language. Cognition. 2004;92:67–99. doi: 10.1016/j.cognition.2003.10.011. [DOI] [PubMed] [Google Scholar]
- Jansen A, Menke R, Sommer J, Forster AF, Bruchmann S, Hempleman J, Weber B, Knecht S. The assessment of hemispheric lateralization in functional MRI-Robustness and reproducibility. Neuroimage. 2006;33:204–217. doi: 10.1016/j.neuroimage.2006.06.019. [DOI] [PubMed] [Google Scholar]
- Kwon Y-J, Lee J-K, Shin G-H, Jeong J-S. Changes in brain activation induced by the training of hypothesis generation skills: An fMRI study. Brain and Cognition. 2009;69:391–397. doi: 10.1016/j.bandc.2008.08.032. [DOI] [PubMed] [Google Scholar]
- Lawrence NS, Jollant F, O’Daly O, Zelaya F, Phillips ML. Distinct roles of prefrontal cortical subregions in the Iowa Gambling Task. Cereb Cortex. 2009;19:1134–1143. doi: 10.1093/cercor/bhn154. [DOI] [PubMed] [Google Scholar]
- Lohmann H, Deppe M, Jansen A, Schwindt W, Knecht S. Task Repetition Can Affect Functional Magnetic Resonance Imaging-Bases Measure of Languge Lateralization and Lead to Pseudoincreases in Bilaterality. Journal of Cognitive Blood Flow & Metabolism. 2004;24:179–187. doi: 10.1097/01.WCB.0000100066.36077.91. [DOI] [PubMed] [Google Scholar]
- Machielsen WC, Rombouts SA, Barkhof F, Scheltens P, Witter MP. FMRI of visual encoding: reproducibility of activation. Hum Brain Mapp. 2000;9:156–164. doi: 10.1002/(SICI)1097-0193(200003)9:3<156::AID-HBM4>3.0.CO;2-Q. [DOI] [PMC free article] [PubMed] [Google Scholar]
- McGonigle D, Howseman A, Athwal B, Friston K, Frackowiak R, Holmes A. Variability in fMRI: an examination of intersession differences. Neuroimage. 2000;11:708–734. doi: 10.1006/nimg.2000.0562. [DOI] [PubMed] [Google Scholar]
- McGraw KO, Wong SP. Forming Inferences About Some Intraclass Correlation Coefficients. Phychological Methods. 1996;1:30–46. [Google Scholar]
- Miki A, Raz J, van Erp TG, Liu CS, Haselgrove JC, Liu GT. Reproducibility of visual activation in functional MR imaging and effects of postprocessing. AJNR Am J Neuroradiol. 2000;21:910–915. [PMC free article] [PubMed] [Google Scholar]
- Mok M, Grayden D, Dowell R, Lawrence D. Speech perception for adults who use hearing aids in conjunction with cochlear implants in opposite ears. J Speech Lang Hear Res. 2006;49:338–351. doi: 10.1044/1092-4388(2006/027). [DOI] [PubMed] [Google Scholar]
- Musso M, Weiller C, Kiebel S. Training-induced brain plasticity in aphasia. Brain. 1999;122:1781–1790. doi: 10.1093/brain/122.9.1781. [DOI] [PubMed] [Google Scholar]
- Oldfield RC. The assessment and analysis of handedness: the Edinburg inventory. Neuropsychologia. 1971;9:97–113. doi: 10.1016/0028-3932(71)90067-4. [DOI] [PubMed] [Google Scholar]
- Peretz I, Gosselin N, Belin P, Zatorre RJ, Plailly J, Tillmann B. Music lexical networks: the cortical organization of music recognition. Ann N Y Acad Sci. 2009;1169:256–265. doi: 10.1111/j.1749-6632.2009.04557.x. [DOI] [PubMed] [Google Scholar]
- Raemaekers M, Vink M, Zandbelt B, van Wezel RJ, Kahn RS, Ramsey NF. Test-retest reliability of fMRI activation during prosaccades and antisaccades. Neuroimage. 2007;36:532–542. doi: 10.1016/j.neuroimage.2007.03.061. [DOI] [PubMed] [Google Scholar]
- Rau S, Fesl G, Bruhns P, Havel P, Braun B, Tonn JC, Ilmberger J. Reproducibility of activations in Broca area with two language tasks: a functional MR imaging study. AJNR Am J Neuroradiol. 2007;28:1346–1353. doi: 10.3174/ajnr.A0581. [DOI] [PMC free article] [PubMed] [Google Scholar]
- Rombouts SA, Barkhof F, Hoogenraad FG, Sprenger M, Scheltens P. Within-subject reproducibility of visual activation patterns with functional magnetic resonance imaging using multislice echo planar imaging. Magn Reson Imaging. 1998;16:105–113. doi: 10.1016/s0730-725x(97)00253-1. [DOI] [PubMed] [Google Scholar]
- Rombouts SA, Barkhof F, Hoogenraad FG, Sprenger M, Valk J, Scheltens P. Test-retest analysis with functional MR of the activated area in the human visual cortex. AJNR Am J Neuroradiol. 1997;18:1317–1322. [PMC free article] [PubMed] [Google Scholar]
- Rutten GJ, Ramsey NF, van Rijen PC, van Veelen CW. Reproducibility of fMRI-determined language lateralization in individual subjects. Brain Lang. 2002;80:421–437. doi: 10.1006/brln.2001.2600. [DOI] [PubMed] [Google Scholar]
- Salvi RJ, Lockwood AH, Frisina RD, Coad ML, Wack DS, Frisina DR. PET imaging of the normal human auditory system: responses to speech in quiet and in background noise. Hear Res. 2002;170:96–106. doi: 10.1016/s0378-5955(02)00386-6. [DOI] [PubMed] [Google Scholar]
- Saur D, Kreher BW, Schnell S, Kummerer D, Kellmeyer P, Vry MS, Umarova R, Musso M, Glauche V, Abel S, Huber W, Rijntjes M, Hennig J, Weiller C. Ventral and dorsal pathways for language. Proc Natl Acad Sci U S A. 2008;105:18035–18040. doi: 10.1073/pnas.0805234105. [DOI] [PMC free article] [PubMed] [Google Scholar]
- Schacher M, Haemmerle B, Woermann FG, Okujava M, Huber D, Grunwald T, Kramer G, Jokeit H. Amygdala fMRI lateralizes temporal lobe epilepsy. Neurology. 2006;66:81–87. doi: 10.1212/01.wnl.0000191303.91188.00. [DOI] [PubMed] [Google Scholar]
- Scott SK, Blank CC, Rosen S, Wise RJ. Identification of a pathway for intelligible speech in the left temporal lobe. Brain. 2000;123(Pt 12):2400–2406. doi: 10.1093/brain/123.12.2400. [DOI] [PMC free article] [PubMed] [Google Scholar]
- Shrout PE, Fleiss JL. Intraclass Correlations: Uses in Assessing Rater Reliability. Phychological Bulletin. 1979;86:420–428. doi: 10.1037//0033-2909.86.2.420. [DOI] [PubMed] [Google Scholar]
- Specht K, Willmes K, Shah NJ, Jancke L. Assessment of reliability in functional imaging studies. J Magn Reson Imaging. 2003;17:463–471. doi: 10.1002/jmri.10277. [DOI] [PubMed] [Google Scholar]
- Stein M, Federspiel A, Koenig T, Wirth M, Lehmann C, Wiest R, Strik W, Brandeis D, Dierks T. Reduced frontal activation with increasing 2nd language proficiency. Neuropsychologia. 2009 doi: 10.1016/j.neuropsychologia.2009.05.023. In press. [DOI] [PubMed] [Google Scholar]
- Swallow KM, Braver TS, Snyder AZ, Speer NK, Zacks JM. Reliability of functional localization using fMRI. Neuroimage. 2003;20:1561–1577. doi: 10.1016/s1053-8119(03)00436-1. [DOI] [PubMed] [Google Scholar]
- Tanaka S, Honda M, Sadato N. Modality-specific cognitive function of medial and lateral human Brodmann area 6. J Neurosci. 2005;25:496–501. doi: 10.1523/JNEUROSCI.4324-04.2005. [DOI] [PMC free article] [PubMed] [Google Scholar]
- Vlieger EJ, Lavini C, Majoie CB, den Heeten GJ. Reproducibility of functional MR imaging results using two different MR systems. AJNR Am J Neuroradiol. 2003;24:652–657. [PMC free article] [PubMed] [Google Scholar]
- Wagner K, Frings L, Quiske A, Unterrainer J, Schwarzwald R, Spreer J, Halsband U, Schulze-Bonhage A. The reliability of fMRI activations in the medial temporal lobes in a verbal episodic memory task. Neuroimage. 2005;28:122–131. doi: 10.1016/j.neuroimage.2005.06.005. [DOI] [PubMed] [Google Scholar]
- Wang Y, Sereno JA, Jongman A, Hirsch J. fMRI Evidence for Cortical Modification during Learning of Mandarin Lexical Tone. Journal of Cognitive Neuroscience. 2003;15:1019–1027. doi: 10.1162/089892903770007407. [DOI] [PubMed] [Google Scholar]
- Wei X, Yoo SS, Dickey CC, Zou KH, Guttmann CR, Panych LP. Functional MRI of auditory verbal working memory: long-term reproducibility analysis. Neuroimage. 2004;21:1000–1008. doi: 10.1016/j.neuroimage.2003.10.039. [DOI] [PubMed] [Google Scholar]
- Wong PC, Uppunda AK, Parrish TB, Dhar S. Cortical mechanisms of speech perception in noise. J Speech Lang Hear Res. 2008;51:1026–1041. doi: 10.1044/1092-4388(2008/075). [DOI] [PubMed] [Google Scholar]
- Wu CW-H, van Gelderen P, Hanakawa T, Zaneb Y, Cohen LG. Enduring representational plasticity after somatosensory stimulation. Neuroimage. 2005;27:872–884. doi: 10.1016/j.neuroimage.2005.05.055. [DOI] [PubMed] [Google Scholar]
- Zekveld AA, Heslenfeld DJ, Festen JM, Schoonhoven R. Top-down and bottom-up processes in speech comprehension. Neuroimage. 2006;32:1826–1836. doi: 10.1016/j.neuroimage.2006.04.199. [DOI] [PubMed] [Google Scholar]
Associated Data
This section collects any data citations, data availability statements, or supplementary materials included in this article.
Supplementary Materials
SUPPLEMENTARY FIGURE 1: Right medial view of all individual Subject-Session activation overlap maps. The outer perimeter of regions within the right putamen and the right parahippocampal gyrus that showed high consistency of activation at the group level but moderate to low consistency of activation at the single-subject level is depicted in black. These areas show high probability of activation for a large number of subjects (Right Putamen: Sbj01, Sbj02, Sbj09, Sbj10, Sbj11, Sbj12, Sbj13, Sbj14, Sbj15, Sbj16, Sbj17 ∣ Right Parahippocampal Gyrus: Sbj07, Sbj09, Sbj12, Sbj14, Sbj15, Sbj17) and moderate or low probability of activation for the rest of the group.
SUPPLEMENTARY FIGURE 2: Right lateral view of all individual Subject-Session activation overlap maps. The outer perimeter of isolated clusters of inconsistent group activations detected in the right angular gyrus/superior parietal lobule (rAG/SPL) and right middle frontal gyrus (rMFG) (circles in Figure 7) are depicted in black. These areas show high frequency of activation (> 80%) across sessions for a reduced number of subjects (rMFG: Sbj01, Sbj03, Sb17 ∣ rAG/SPL: Sbj06, Sbj14, Sbj15) but low or no activation for the rest of the group.
SUPPLEMENTARY FIGURE 3: Overlay of high RVbet-sbj voxels on top of the Omnibus results for the Listen condition and the Group-Session Overlap map. (A) Grey shadow represents voxels with RVbet-sbj > 0.8 in (A) and RVbet-sbj > 0.7 in (B). Voxel with high RVbet-sbj tend to overlap with significantly active voxels, but also extend beyond those areas (especially at RVbet-sbj>0.7). High RVbet-sbj non-significant voxels might result from a consistent, but low amplitude, fit to the response model. Given not all high RVbet-sbj non-significant voxels are expected to follow this pattern, the experimenter should carefully examine the voxel timeseries to evaluate if the voxel represents false negatives.