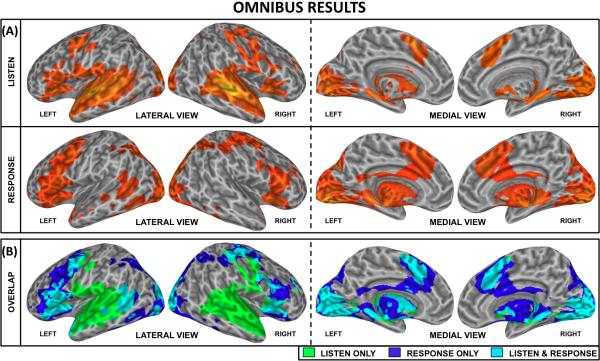
FIGURE 4.
Activation maps of the Omnibus (3-way ANOVA) analysis at pFDR<0.005. The top box shows activations for the Listen condition (top row) and Response condition (middle row). The lower box shows an overlap between both conditions to clearly identify areas only active during the Listen condition (green), only during the Response condition (dark blue) and activated areas common to both conditions (cyan).

