
FIGURE 7.
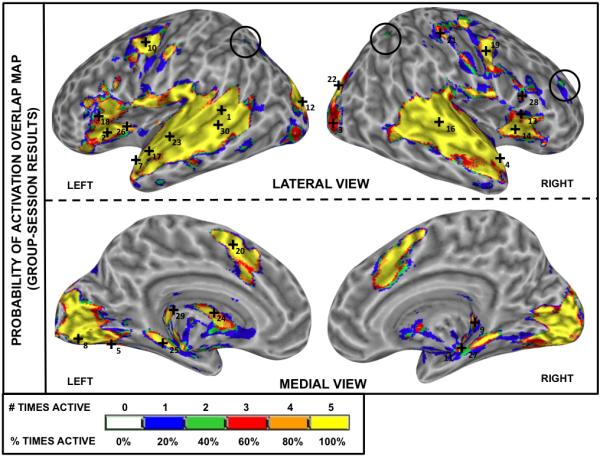
Reliability analysis (Rcc) for Group-Session data. The color-coded overlap activation map indicates the relative frequency at which a voxel was classified as significantly active (pFDR<0.005) in the five Group-Session results (blue = significantly active only in one session; green = significantly active in two sessions; red = significantly active in three sessions; orange = significantly active in four sessions; yellow = significantly active in all five sessions). Numbered cross-hairs in the map correspond to the thirty most reliable peak locations (as measured by r95) for the Group-Session results (see column 5 on Table 3). The black circles on bilateral angular gyrus/superior parietal lobule and right middle frontal gyrus indicate isolated areas of inconsistent group activation across repeated measures.