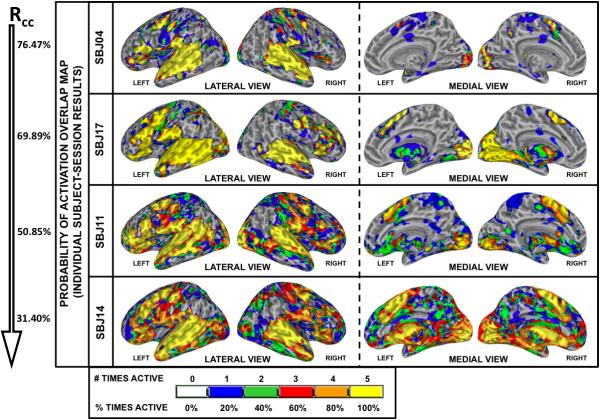
FIGURE 8.
Reliability analysis (Rcc) for individual Subject-Session data. Selected individual Subject-Session color-coded overlap activation maps indicate the relative frequency at which a voxel was classified as significantly active (pFDR<0.005) for the given subject (e.g., Figure 6). Data from four subjects (Sbj04, Sbj17, Sbj11 and Sbj14) are presented in the figure. Maps are sorted vertically in terms of descending Rcc value (reported on the left of each map).

