

Abstract
The molecular controls that govern the differentiation of embryonic stem (ES) cells remain poorly understood. DGCR8 is an RNA-binding protein that assists the RNase III enzyme Drosha in the processing of microRNAs (miRNAs), a subclass of small RNAs. Here we study the role of miRNAs in ES cell differentiation by generating a Dgcr8 knockout model. Analysis of mouse knockout ES cells shows that DGCR8 is essential for biogenesis of miRNAs. On the induction of differentiation, DGCR8-deficient ES cells do not fully downregulate pluripotency markers and retain the ability to produce ES cell colonies; however, they do express some markers of differentiation. This phenotype differs from that reported for Dicer1 knockout cells, suggesting that Dicer has miRNA-independent roles in ES cell function. Our findings indicate that miRNAs function in the silencing of ES cell self-renewal that normally occurs with the induction of differentiation.
Embryonic stem cells provide a tool for the study of the molecular mechanisms of early mammalian development. Differentiation of ES cells requires large and rapid shifts in their mRNA and protein constitution. miRNAs are well suited to perform this task by inhibiting the translation of several targets1. miRNAs are predicted to regulate hundreds of genes individually and simultaneously2,3. An essential role for small RNAs in ES cell differentiation has been inferred from the phenotype of mouse Dicer1 knockout ES cells4. Dicer is required for the maturation of at least two classes of small RNAs: miRNAs and short interfering RNAs (siRNAs)5-7. Thus, it remains unknown whether the lack of miRNAs alone is the cause of the Dicer1 knockout phenotype. The double-stranded RNA-binding protein DGCR8 and the RNase III enzyme Drosha form the microprocessor complex, which processes long primary miRNAs (pri-miRNAs) into short hairpins called precursor miRNAs (pre-miRNAs)8-13. The resulting hairpins are exported into the cytoplasm14,15 and are processed by Dicer into mature miRNAs1,6. Unlike cytoplasmic processing by Dicer, nuclear processing by the microprocessor complex seems to be specific to miRNAs. By contrast, Drosha has been reported to have a role in ribosomal RNA processing, possibly in a distinct protein complex16. Therefore, DGCR8 may be the only member of the processing pathway that is specific to miRNAs. To assess the role of DGCR8 in miRNA processing and to study the global role of miRNAs in early embryonic development and ES cell differentiation, we generated mouse Dgcr8 knockout ES cells (Fig. 1).
Figure 1.
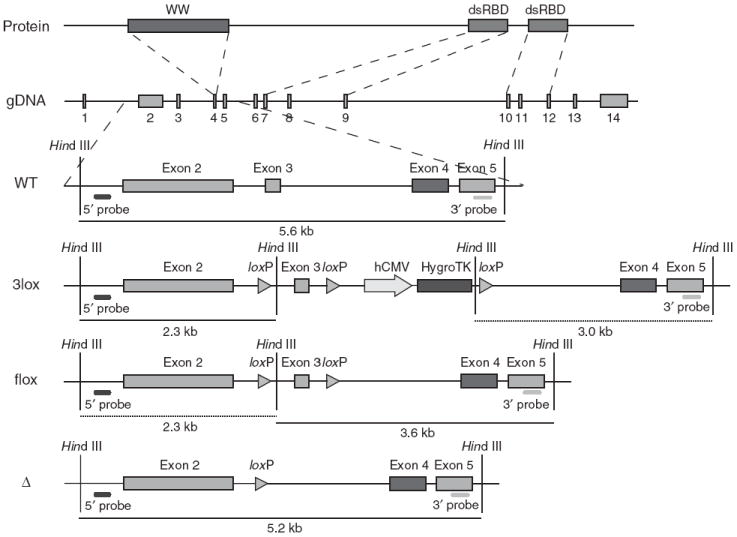
Dgcr8 knockout strategy. The DGCR8 protein has one WW domain and two double-stranded RNA-binding domains (dsRBDs). The WW domain is encoded in exon 4 of the Dgcr8 genomic DNA (gDNA); the two dsRBDs are located in exons 7–9 and 10–12, respectively. Excision of exon 3 from the mRNA generates a frame shift, resulting in several premature stop codons in downstream exons. ES cells were sequentially targeted and treated with Cre recombinase to produce Dgcr8 Δ/flox and Δ/Δ ES cells. Rescue cells were generated by retargeting Δ/Δ ES cells with the 3lox construct, followed by removal of the HygroTK cassette with Cre recombinase.
To confirm that DGCR8 is essential for miRNA biogenesis, we performed RNA blot analysis of the ES cells with probes specific to miR-293, miR-294 and miR-130. miR-293 and miR-294 are derived from a single gene and are expressed specifically in ES cells. miR-130 is independently transcribed and expressed broadly in ES cells and differentiated tissues17. In Dgcr8 knockout cells, neither fully mature nor intermediate pre-miRNA products were present for any of these miRNAs (Fig. 2a,b and Supplementary Fig. 1 online). The miR-293 probe identified two large RNA transcripts (~ 3 kb) in the Dgcr8 knockout samples, consistent with the size expected for pri-miR-293 transcripts18. By contrast, mature and pre-miRNA bands, but not pri-miRNA bands, were present in wild-type and Dgcr8 heterozygous ES cells. These results show that DGCR8 is absolutely required for the processing of some, if not all, pri-miRNAs to pre-miRNAs.
Figure 2.
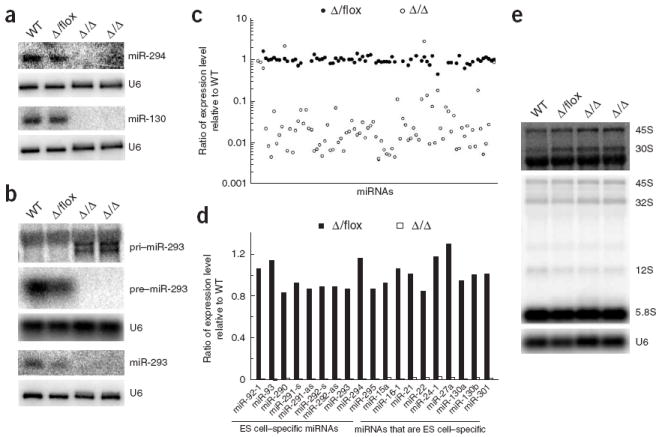
DGCR8 is essential and may be specific for miRNA biogenesis in ES cells. (a) RNA blot analysis of miRNAs from wild-type (WT), heterozygous (Δ/flox) and two independent knockout (Δ/Δ) ES cells with probes specific to miR-294 and miR-130. U6 snRNA was used as a loading control. (b) RNA blot analysis of pri-miRNA, pre-miRNA and miRNA from ES cells with a probe specific to miR-293. (c) Expression ratios of Dgcr8 heterozygous and knockout ES cells relative to wild-type ES cell for 89 miRNAs. These ratios were calculated from miRNA microarray analysis. (d) Expression ratios of Dgcr8 heterozygous and Dgcr8 knockout ES cells relative to wild-type ES cells for 19 representative miRNAs. The miRNAs on the left are ES cell–specific miRNAs; those on the right are expressed in ES cells and differentiated tissues17. (e) RNA blot analysis of pre-rRNAs. Top, hybridization with a probe specific to the 5′ ETS sequence of 45S pre-rRNA (binding to 45S and 30S transcripts); bands below 30S pre-rRNA were detected owing to non-specific binding to abundant 28S rRNA. Middle, hybridization with a probe specific to the 5.8S rRNA sequence (binding to 45S, 32S, 12S and 5.8S transcripts). Bottom, U6 snRNA was used as a loading control.
To determine whether DGCR8 is required for the maturation of all miRNAs, we performed miRNA microarray analysis. Using RNA from wild-type ES cells as our reference sample, we observed a global loss of miRNAs in Dgcr8 knockout cells, but normal expression in Dgcr8 heterozygous cells (Fig. 2c,d and Supplementary Table 1 online). The similarity in expression between wild-type and heterozygous cells suggests that DGCR8 is not limiting in the maintenance of steady-state levels of miRNAs in ES cells. Of the 89 miRNA array probes that showed significant signals with wild-type RNA, 82 were greatly reduced in the Dgcr8 knockout cells. The remaining seven were not significantly altered in the Dgcr8 knockout cells, but signals for at least four of these seven miRNAs seemed to be due to unavoidable contamination from RNA from the mouse embryonic fibroblast (MEF) feeder cells used for ES cell culture before isolation of the RNA. Expression of these miRNAs was high in the MEFs, and decreased in the ES cells after temporary passage on gelatin-coated plates without feeders (Supplementary Fig. 1 and data not shown). The remaining three miRNAs showed similar expression in the heterozygous, knockout and MEF feeder cells; therefore, these signals may be small RNAs that are not processed by the microprocessor complex. Alternatively, they may result from unavoidable degradation products in the purified small RNA population. In either case, our results show that DGCR8 is broadly required for miRNA processing with little evidence of redundancy or bypass mechanisms.
The RNase III enzyme Drosha is required for processing 12S pre-rRNA to 5.8S rRNA and may be also involved in the cleavage of 32S pre-rRNA to 12S pre-rRNA and 18S rRNA16. Because DGCR8 associates with Drosha to form the microprocessor complex, we considered the possibility that DGCR8 is also involved in assisting Drosha in rRNA processing. To test this possibility, we performed RNA blot analyses for the 45S primary, 30S, 32S and 12S intermediate, and 5.8S terminal rRNA transcripts (Fig. 2e). We saw no qualitative or quantitative differences in the processing of ribosomal RNAs between wild-type and knockout ES cells. Although we cannot rule out the possibility that DGCR8 has a role in an unknown processing pathway for small RNAs, our results, together with findings showing the precise binding of DGCR8 to pri-miRNA stem loops13, suggest that DGCR8 has a specific role in miRNA processing.
Dgcr8 knockout embryos arrested early in development (Supplementary Table 2 online). We therefore focused our studies on the analysis of Dgcr8 knockout ES cells. The knockout ES cells had an extended population doubling time relative to their wild-type and heterozygous counterparts, but were morphologically normal and continued to express ES cell–specific markers (Figs. 3-5). The higher population doubling time cannot be explained by an increase in apoptosis because neither wild-type nor knockout ES cells showed substantial apoptosis (Supplementary Fig. 2 online). The knockout ES cells accumulated in the G1 phase of the cell cycle, increasing from approximately 14% of wild-type and heterozygous Dgcr8 cells in G1 to 22% of the homozygous Dgcr8 knockout cells (Fig. 3). Re-introduction of DGCR8 by homologous recombination rescued the population doubling time and G1 phenotypes. The accumulation of DGCR8-deficient ES cells in G1 is reminiscent of the result of loss of the miRNA-specific Dicer gene, Dcr-1, in the Drosophila melanogaster germ line19. These results show that DGCR8 is required for normal ES cell proliferation and cell-cycle progression.
Figure 3.
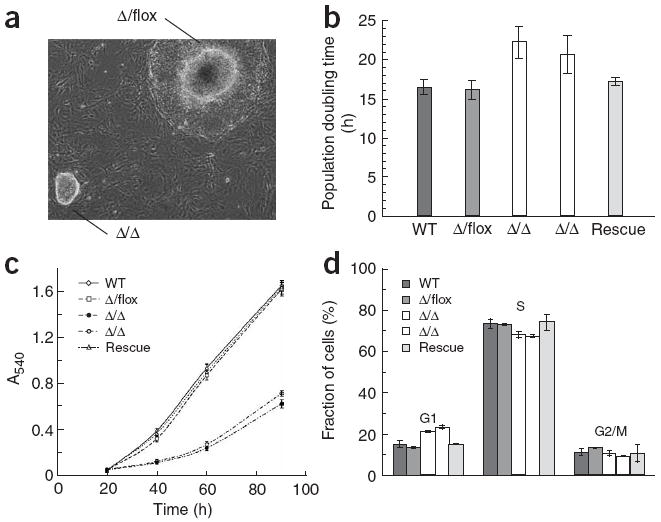
Proliferation defects of Dgcr8 knockout ES cells. (a) Morphology of Dgcr8 Δ/flox and Δ/Δ ES cell colonies 7 d after plating. The Δ/flox colony is overgrown, with differentiation occurring around its edges. (b) Mean population doubling time (n = 5–6). (c) Mean growth rate of ES cells measured by MTT assay (n = 6). (d) Cell-cycle analysis of Dgcr8 knockout ES cells (n = 3). Error bars in b–d represent the s.d.
Figure 5.

Monolayer differentiation of ES cells in the presence of retinoic acid. (a) RT-PCR analysis of pluripotency markers. Wild-type and Dgcr8 knockout ES cells were plated as a monolayer and treated with retinoic acid (RA) in the absence of LIF to induce mesenchymal differentiation. Gapdh was used as a loading control. (b) Quantitative PCR analysis of the pluripotency markers Oct4 and Nanog (n = 3). The β-actin gene was used as a reference. For each sample, data were normalized to the mRNA level at day 0. (c) ES cell colony formation of differentiated cells. After varying durations of monolayer differentiation, cells were returned to ES cell culture conditions and assayed for their ability to form alkaline phosphatase–positive colonies. Error bars indicate the range of measurements (n = 3). (d) Clonal analysis of ES cell differentiation in the absence of MEF feeders and in the presence or absence of LIF, as indicated. Shown are percentages of undifferentiated, mixed and differentiated colonies under the indicated conditions. ‘D5’ indicates 5 d; ‘D8’ indicates 8 d.
To assess the differentiation capacity of Dgcr8 knockout ES cells, we cultured them as embryoid bodies (EBs) in the absence of leukemia inhibitory factor (LIF). Under these conditions, wild-type ES cells spontaneously differentiate into cystic EBs containing a heterogeneous mix of cells representing all three germ layers of the early embryo. Unlike wild-type EBs, Dgcr8 knockout EBs did not form a cyst (Fig. 4a). In addition, RT-PCR showed abnormal expression of various markers of differentiation (Fig. 4b,c and Supplementary Fig. 3 online). Fgf5 is a marker of primitive ectoderm20, a direct derivative of the inner cell mass of the blastocyst, that goes on to make all tissues of the embryo proper21,22. In wild-type EBs, Fgf5 was highly expressed by day 2 of differentiation (Fig. 4b). By contrast, expression of Fgf5 in Dgcr8 knockout cells was delayed: it peaked at day 8 of differentiation and did not reach wild-type levels.
Figure 4.

EB differentiation and teratoma formation. (a) Morphology of EBs from wild-type, Δ/Δ and rescued ES cells. EBs were cultured for 40–50 d. (b) RT-PCR analysis of pluripotency (Oct4) and differentiation markers (Fgf5,T(brachyury),Hnf4a,Krt18) after EB differentiation. Gapdh was used as a reference. (c) Quantitative RT-PCR for the markers shown in b. The β-actin gene was used as a reference. For each gene, data were normalized to the mRNA level at day 0 of wild-type EB differentiation. (d) Teratoma formation by wild-type and Dgcr8 knockout ES cells. Arrow in Δ/Δ tumor identifies region of epithelial differentiation.
To assess later steps in EB differentiation, we used markers of endoderm (Hnf4a and Afp), mesoderm (T; also known as brachyury), ectoderm (Sox1), epithelium (Krt18), trophectoderm (Eomes) and the germ line (Ddx4, also known as Vasa; Fig. 4b,c and Supplementary Fig. 3). With the exception of Krt18, Eomes and Ddx4, expression of the markers was either absent or severely reduced in the Dgcr8 knockout EBs. Expression of Krt18 was delayed, but by day 16 of differentiation it showed levels similar to those of wild-type cells. Eomes was weakly expressed in both wild-type and Dgcr8 knockout cells. Ddx4 expression decreased on EB differentiation of wild-type cells, but not Dgcr8 knockout cells. All expression defects in the EBs were rescued by the re-introduction of Dgcr8 (Supplementary Fig. 4 online).
Teratomas, like EBs, normally consist of a heterogeneous mix of differentiated cell types. We generated teratomas by subcutaneously injecting Dgcr8 knockout and wild-type ES cells into immunodeficient mice. Consistent with the defects in EB differentiation, the teratomas produced with the Dgcr8 knockout cells appeared largely undifferentiated apart from some glandular-like structures (Fig. 4d). Together, the EB and teratoma differentiation experiments show grossly abnormal, but not absolute loss of, expression of differentiation markers in the Dgcr8 knockout population.
To assess further the differentiation defect of Dgcr8 knockout ES cells, we treated the cells with retinoic acid, a strong inducer of differentiation. When cultured in retinoic acid, both wild-type and Dgcr8 knockout ES cells took on a morphology consistent with mesenchymal differentiation (data not shown). Even in the presence of retinoic acid, however, the pluripotency markers Oct4, Rex1, Sox2 and Nanog were not silenced completely in Dgcr8 knockout cells (Fig. 5a,b). We returned the retinoic acid–treated cells to ES cell culture conditions and measured their ability to reform ES cell–like colonies. The frequency of colony formation was about 100-fold greater for Dgcr8 knockout cells than for wild-type or Dgcr8 heterozygous cells (Fig. 5c). In addition, all of the colonies were alkaline phosphatase–positive and had the stereotypical colony morphology of ES cells. To evaluate further this apparent failure of Dgcr8 knockout ES cells to turn off the stem cell program, we performed a clonal assay of differentiation. Wild-type and Dgcr8 knockout ES cells were plated at clonal density without MEFs in the presence or absence of LIF. With or without LIF, the wild-type colonies began to differentiate, as assessed by flattening around the edges and loss of alkaline phosphatase staining (Fig. 5d and Supplementary Fig. 5 online). Differentiation was more complete in the absence of LIF. By contrast, Dgcr8 knockout colonies did not flatten around the edges and continued to express alkaline phosphatase even in the absence of LIF. Together, these data show that Dgcr8 knockout ES cells cannot efficiently silence the ES cell program even under stringent differentiation conditions.
Our results show that DGCR8 is required for the biogenesis of miRNAs and that miRNAs are essential for silencing ES cell self-renewal. A similar defect in silencing the stem cell program has been described for a knockout model of the NuRD complex, a large complex with nucleosome remodeling and histone deacetylation activities23. In addition, the G9a histone methyltransferase and the Dnmt3a and Dnmt3b DNA methyltransferases have been reported to be essential for maintaining differentiation of ES cells after retinoic acid treatment24. Therefore, the Dgcr8 knockout phenotype places DGCR8 among a unique group of global regulators of cellular differentiation. We propose that the failure to silence ES self-renewal upon differentiation in a Dgcr8 mutant background is secondary to a loss of miRNAs that normally inhibit translation of proteins that directly or indirectly maintain ES cell pluripotency.
The Dgcr8 knockout ES cell phenotype differs from that reported for the Dicer1 knockout4. Dicer1 knockout ES cells, like Dgcr8 knockout ES cells, are defective in differentiation. Unlike Dgcr8 knockout cells, however, Dicer1 knockout cells do not express differentiation markers during EB culture. Dicer1 knockout EBs stop growing after approximately 8 d of culture, whereas Dgcr8 knockout cells continue to grow and to differentiate even after 16 d (data not shown). In addition, Dicer1 knockout ES cells seem to have a more profound initial proliferation defect that is overcome over time, presumably due to additional genetic events25. By contrast, Dgcr8 knockout ES cells show a stable and more subtle proliferation defect. These differences in the phenotypes of Dicer1 and Dgcr8 knockout ES cells suggest that Dicer has miRNA-independent roles in ES cell function. Dgcr8 knockout ES cells provide a means to identify these roles. Dgcr8 knockout cells can be also used to dissect the function of individual miRNAs by reintroducing specific miRNAs and testing their ability to rescue identified knockout phenotypes. Thus, the Dgcr8 knockout model should provide a powerful means to study the function of small RNAs in ES cell self-renewal and proliferation and in the silencing of stem cell potential during the process of lineage commitment.
METHODS
Targeting strategy
Dgcr8 knockout ES cells were generated by removing exon 3, resulting in the formation of several premature stop codons downstream of the targeted region (Fig. 1). We generated 5′ and 3′ arms by PCR (High Fidelity Taq, Invitrogen) from a bacterial artificial chromosome (Children’s Hospital and Research Center, Oakland). A loxP-HindIII fragment was inserted between the arms. A HygroTK selection cassette flanked by loxP sites was inserted at a BglII site downstream of exon 3. V6.5 ES cells were transfected with the 3lox construct and selected in 130 μg/ml of hygromycin (Roche). Subclones were picked and analyzed by DNA blotting. The resulting wild-type/3lox subclones were transfected with a Cre recombinase–expressing plasmid and selected in 0.4 nM gancyclovir (Sigma). The second allele of Dgcr8 was removed by a second round of targeting. Wild-type/flox ES cells were targeted and exposed to Cre recombinase to produce Dgcr8 Δ/Δ and Δ/flox ES cells. For the rescue experiment, Δ/Δ ES cells were retargeted with the 3lox construct to produce 3lox/Δ cells, and the HygroTK selection cassette was then removed.
Tissue culture
ES cells were cultured on MEF feeder cells in ES cell medium26. For micorarray analysis, EB and monolayer differentiation experiments, feeder cells were removed by differential adherence to uncoated plates for 0.5–1 h, followed by 2 d of culture on gelatinized plates. Alternatively for microarray analysis, ES cells were weaned from MEFs for five passages to minimize feeder contamination. For EB differentiation, cells were gently treated with trypsin and cultured in suspension in Petri dishes or low-attachment culture dishes in ES cell medium without LIF. For teratoma formation, 4 × 10⁶ to 5 × 10⁶ ES cells were injected into an immunodeficient mouse by subcutaneous injection. Teratomas were allowed to develop to about 2 cm in diameter before fixation and staining with hemotoxylin and eosin. For monolayer differentiation, ES cells were cultured on gelatinized plates in ES cell medium without LIF and in the presence of 100 nM retinoid acid. The relative numbers of Dgcr8 knockout ES cells were doubled to compensate for their proliferation deficiency. Total RNA was collected (Trizol, Invitrogen) at various time points and analyzed by RT-PCR. For the ES cell colony formation assay, 1 × 10³ cells treated with retinoic acid were returned to ES cell conditions. Cells were cultured in a six-well plastic plate for 5 d, stained for alkaline phosphatase (Vector Laboratories) and counted manually.
For clonal differentiation of ES cells, ES cells were weaned off MEF feeder cells and plated at 100–200 cells per well of a six-well plate in ES cell medium supplemented with LIF. The next day, media was replaced with media with or without LIF supplement. Medium was changed daily. After 5 or 8 d, colonies were fixed in 4% paraformaldehyde and stained with 4,6-diamidino-2-phenylindole (DAPI) and Vector Red Alkaline Phosphatase Substrate Kit I (Vector Laboratories). Colonies were counted and scored for morphology (undifferentiated, mixed and differentiated) by using a fluorescence microscope at ×5 magnification. Colonies containing only alkaline phosphatase–positive cells are defined as undifferentiated. Colonies containing only alkaline phosphatase–negative cells are defined as differentiated. Mixed colonies are defined as colonies with a positive core and a surrounding negative outgrowth. Between 50 and 100 colonies were counted for each cell type per time point.
RNA blot analysis
Analysis of mature miRNAs was performed as previously described27. For analysis of pri– and pre–miR-293, 10 μg of total RNA was resolved in a 1.2% denaturing agarose and formaldehyde gel. Analysis of pre-rRNA was done as described16. All blots were stripped in 1% SDS at 70 °C for 1 h and then probed for the U6 small nuclear RNA (snRNA) as a loading control. The probes for miR-293 (also for pri– and pre-miR–293), miR-294 and miR-130 were DNA oligonucleotides complementary to the respective mature miRNAs. See Supplementary Table 3 online for the probes used in RNA blot analysis.
Microarray analysis
We resolved 10–20 μg of total RNA from wild-type, Dgcr8 heterozygous and Dgcr8 knockout ES cells on a 15% denaturing polyacrylamide gel. The gel portion corresponding to ~ 18–26 nt was cut out, extracted in TEN buffer (10 mM Tris, pH 8.0, 1 mM EDTA, 300 mM NaCl) and precipitated with ethanol. Before PAGE separation, a trace amount of an unrelated 18-nt small RNA radiolabeled with 32P at the 5′ end was added to each total RNA sample to monitor the efficiency of gel extraction. After gel extraction, an equal amount of positive control RNA (Ambion) was added to each sample. Subsequently, small RNAs were polyadenylated, ligated with capture sequences using an NCode miRNA labeling system (Invitrogen) and hybridized to microarrays spotted with the Ambion mammalian miRNA probe set (Whitehead Institute Center for Microarray Technology). Microarrays were scanned on a GenePix 4000B scanner (Axon Instruments) and analyzed with Genepix Pro version 4.1. In all analyses, small RNAs from wild-type ES cells were used as a reference. The ratios for positive control RNAs were used for normalization. Microarray analyses were done twice for MEFs, three times for Dgcr8 heterozygous knockout ES cells, and twice for two independent Dgcr8-null ES cell lines. The correlation coefficients of reverse dye experiments for two independent cell lines were 0.99 and 0.97. The ratios shown in Figure 2c,d are the average of all experiments (Supplementary Table 1).
RT-PCR
We treated 5 μg of total RNA with DNase (Promega) to remove genomic DNA. cDNA was synthesized with a SuperScriptIII First Strand cDNA Synthesis RT-PCR kit (Invitrogen) from 2 μg of treated RNA. For semi-quantitative PCR, the primers for Oct4,Rex1,Gapdh,T(brachyury) and Krt18 were gifts (see Acknowledgments). The primers for Hnf4a and Fgf5 have been described23,27. Quantitative PCR was done on a 7300 Real Time PCR System (Applied Biosystems). For each cell sample, PCR was done in triplicate to minimize the variation. β-Actin mRNA was used as an endogenous control. Primers were designed with Primer Express 3.0 (Applied Biosystems). See Supplementary Table 3 for the primers used in quantitative real-time PCR.
Cell proliferation assay and cell-cycle analysis
To determine the cell population doubling time, 0.5 × 10⁶ ES cells were plated onto 60-mm plastic dishes and counted after 2–3 d. The cell population doubling time was obtained with the equation Yend = Ystart × 2(t/T), where T is the cell population doubling time, Ystart is the starting number of ES cells plated, and Yend is the ending number of ES cells after growth for a period of time, t. Each cell line was counted a minimum of five times. For the MTT assay, cells were plated at 4,000 cells per well in a 96-well plate and analyzed 20, 40, 60 and 90 h after plating. At the indicated time points, ES cell medium was replaced with 100 μl 1 mg/ml 3-(4,5-dimethylthiazol-2-yl)-2.5-diphenyltetrazolium bromide (MTT) (Molecular Probes) in DMEM. After incubation at 37 °C for 3 h, the MTT solution was removed, and 100 μl DMSO was added to dissolve precipitate. Absorbance was recorded at 540 nm using a Spectramax M2 microplate reader (Molecular Devices). For cell-cycle analysis, cells were fixed in ethanol, labeled with propidium iodine and analyzed by flow cytometry. For apoptosis analysis, cells were labeled with propidium iodine and FITC–Annexin V (BioVision), and analyzed by flow-cytometry. Percentage of propidium iodine–negative and Annexin V–positive cells in the total population was calculated to track early stages of apoptosis.
Accession code
Gene Expression Omnibus: GSE6586.
Supplementary Material
Acknowledgments
We thank C. Beard and the Anita Sil Laboratory for technical advice; J. Dausman for technical help; J. Reiter and N. Shomron for reagents and M. Ramalho-Santos, J. Reiter and members of the Blelloch Laboratory for critically reading the manuscript. The primers for Oct4, Rex1, Gapdh, T (brachyury) and Krt18 were gifts from J. Reiter (University of California San Francisco) This work was supported by grants to R.B. from the University of California San Francisco Urology Department, the Sandler Foundation, the Lance Armstrong Foundation and the National Institutes of Health (K08 NS48118). Y.W. is supported by the California Institute of Regenerative Medicine postdoctoral fellowship program. C.M. is supported by the National Science Foundation graduate research fellowship program.
Footnotes
AUTHOR CONTRIBUTIONS Y.W. did the experiments described in Figs. 2 and 3 and quantitative PCR. C.M. did the experiments described in Fig. 5b–d. R.M. together with R.B. performed other experiments, including construction of knockout ES cells. R.J. provided reagent and infrastructure support for targeting experiments. R.B. was involved in designing the experiments and wrote the paper with help from Y.W. and C.M.
Note: Supplementary information is available on the Nature Genetics website.
COMPETING INTERESTS STATEMENT The authors declare that they have no competing financial interests.
References
- 1.Valencia-Sanchez MA, Liu J, Hannon GJ, Parker R. Control of translation and mRNA degradation by miRNAs and siRNAs. Genes Dev. 2006;20:515–524. doi: 10.1101/gad.1399806. [DOI] [PubMed] [Google Scholar]
- 2.Lewis BP, Burge CB, Bartel DP. Conserved seed pairing, often flanked by adenosines, indicates that thousands of human genes are microRNA targets. Cell. 2005;120:15–20. doi: 10.1016/j.cell.2004.12.035. [DOI] [PubMed] [Google Scholar]
- 3.Wienholds E, Plasterk RH. MicroRNA function in animal development. FEBS Lett. 2005;579:5911–5922. doi: 10.1016/j.febslet.2005.07.070. [DOI] [PubMed] [Google Scholar]
- 4.Kanellopoulou C, et al. Dicer-deficient mouse embryonic stem cells are defective in differentiation and centromeric silencing. Genes Dev. 2005;19:489–501. doi: 10.1101/gad.1248505. [DOI] [PMC free article] [PubMed] [Google Scholar]
- 5.Bernstein E, et al. Dicer is essential for mouse development. Nat Genet. 2003;35:215–217. doi: 10.1038/ng1253. [DOI] [PubMed] [Google Scholar]
- 6.Hammond SM. Dicing and slicing: the core machinery of the RNA interference pathway. FEBS Lett. 2005;579:5822–5829. doi: 10.1016/j.febslet.2005.08.079. [DOI] [PubMed] [Google Scholar]
- 7.Hutvagner G, et al. A cellular function for the RNA-interference enzyme Dicer in the maturation of the let-7 small temporal RNA. Science. 2001;293:834–838. doi: 10.1126/science.1062961. [DOI] [PubMed] [Google Scholar]
- 8.Tomari Y, Zamore PD. MicroRNA biogenesis: Drosha can’t cut it without a partner. Curr Biol. 2005;15:R61–R64. doi: 10.1016/j.cub.2004.12.057. [DOI] [PubMed] [Google Scholar]
- 9.Denli AM, Tops BB, Plasterk RH, Ketting RF, Hannon GJ. Processing of primary microRNAs by the Microprocessor complex. Nature. 2004;432:231–235. doi: 10.1038/nature03049. [DOI] [PubMed] [Google Scholar]
- 10.Gregory RI, et al. The Microprocessor complex mediates the genesis of microRNAs. Nature. 2004;432:235–240. doi: 10.1038/nature03120. [DOI] [PubMed] [Google Scholar]
- 11.Han J, et al. The Drosha-DGCR8 complex in primary microRNA processing. Genes Dev. 2004;18:3016–3027. doi: 10.1101/gad.1262504. [DOI] [PMC free article] [PubMed] [Google Scholar]
- 12.Landthaler M, Yalcin A, Tuschl T. The human DiGeorge syndrome critical region gene 8 and its D. melanogaster homolog are required for miRNA biogenesis. Curr Biol. 2004;14:2162–2167. doi: 10.1016/j.cub.2004.11.001. [DOI] [PubMed] [Google Scholar]
- 13.Han J, et al. Molecular basis for the recognition of primary microRNAs by the Drosha-DGCR8 complex. Cell. 2006;125:887–901. doi: 10.1016/j.cell.2006.03.043. [DOI] [PubMed] [Google Scholar]
- 14.Yi R, Qin Y, Macara IG, Cullen BR. Exportin-5 mediates the nuclear export of pre-microRNAs and short hairpin RNAs. Genes Dev. 2003;17:3011–3016. doi: 10.1101/gad.1158803. [DOI] [PMC free article] [PubMed] [Google Scholar]
- 15.Lund E, Guttinger S, Calado A, Dahlberg JE, Kutay U. Nuclear export of microRNA precursors. Science. 2004;303:95–98. doi: 10.1126/science.1090599. [DOI] [PubMed] [Google Scholar]
- 16.Wu H, Xu H, Miraglia LJ, Crooke ST. Human RNase III is a 160-kDa protein involved in preribosomal RNA processing. J Biol Chem. 2000;275:36957–36965. doi: 10.1074/jbc.M005494200. [DOI] [PubMed] [Google Scholar]
- 17.Houbaviy HB, Murray MF, Sharp PA. Embryonic stem cell-specific microRNAs. Dev Cell. 2003;5:351–358. doi: 10.1016/s1534-5807(03)00227-2. [DOI] [PubMed] [Google Scholar]
- 18.Houbaviy HB, Dennis L, Jaenisch R, Sharp PA. Characterization of a highly variable eutherian microRNA gene. RNA. 2005;11:1245–1257. doi: 10.1261/rna.2890305. [DOI] [PMC free article] [PubMed] [Google Scholar]
- 19.Hatfield SD, et al. Stem cell division is regulated by the microRNA pathway. Nature. 2005;435:974–978. doi: 10.1038/nature03816. [DOI] [PubMed] [Google Scholar]
- 20.Hebert JM, Boyle M, Martin GR. mRNA localization studies suggest that murine FGF-5 plays a role in gastrulation. Development. 1991;112:407–415. doi: 10.1242/dev.112.2.407. [DOI] [PubMed] [Google Scholar]
- 21.Rathjen J, et al. Formation of a primitive ectoderm like cell population, EPL cells, from ES cells in response to biologically derived factors. J Cell Sci. 1999;112:601–612. doi: 10.1242/jcs.112.5.601. [DOI] [PubMed] [Google Scholar]
- 22.Pelton TA, Sharma S, Schulz TC, Rathjen J, Rathjen PD. Transient pluripotent cell populations during primitive ectoderm formation: correlation of in vivo and in vitro pluripotent cell development. J Cell Sci. 2002;115:329–339. doi: 10.1242/jcs.115.2.329. [DOI] [PubMed] [Google Scholar]
- 23.Kaji K, et al. The NuRD component Mbd3 is required for pluripotency of embryonic stem cells. Nat Cell Biol. 2006;8:285–292. doi: 10.1038/ncb1372. [DOI] [PubMed] [Google Scholar]
- 24.Feldman N, et al. G9a-mediated irreversible epigenetic inactivation of Oct-3/4 during early embryogenesis. Nat Cell Biol. 2006;8:188–194. doi: 10.1038/ncb1353. [DOI] [PubMed] [Google Scholar]
- 25.Murchison EP, Partridge JF, Tam OH, Cheloufi S, Hannon GJ. Characterization of Dicer-deficient murine embryonic stem cells. Proc Natl Acad Sci USA. 2005;102:12135–12140. doi: 10.1073/pnas.0505479102. [DOI] [PMC free article] [PubMed] [Google Scholar]
- 26.Blelloch RH, et al. Nuclear cloning of embryonal carcinoma cells. Proc Natl Acad Sci USA. 2004;101:13985–13990. doi: 10.1073/pnas.0405015101. [DOI] [PMC free article] [PubMed] [Google Scholar]
- 27.Lau NC, Lim LP, Weinstein EG, Bartel DP. An abundant class of tiny RNAs with probable regulatory roles in Caenorhabditis elegans. Science. 2001;294:858–862. doi: 10.1126/science.1065062. [DOI] [PubMed] [Google Scholar]
- 28.Di Cristofano A, Pesce B, Cordon-Cardo C, Pandolfi PP. Pten is essential for embryonic development and tumor suppression. Nat Genet. 1998;19:348–355. doi: 10.1038/1235. [DOI] [PubMed] [Google Scholar]
Associated Data
This section collects any data citations, data availability statements, or supplementary materials included in this article.