

SUMMARY
We hypothesized that DNA methylation distributes into specific patterns in cancer cells, which reflect critical biological differences. We therefore examined the methylation profiles of 344 patients with acute myeloid leukemia (AML). Clustering of these patients by methylation data segregated patients into 16 groups. Five of these groups defined new AML subtypes that shared no other known feature. In addition, DNA methylation profiles segregated patients with CEBPA aberrations from other subtypes of leukemia, defined four epigenetically distinct forms of AML with NPM1 mutations, and showed that established AML1-ETO, CBFb-MYH11, and PML-RARA leukemia entities are associated with specific methylation profiles. We report a 15 gene methylation classifier predictive of overall survival in an independent patient cohort (p < 0.001, adjusted for known covariates).
SIGNIFICANCE.
We show that large-scale genome-wide DNA methylation profiling reveals the existence of distinct DNA methylation patterns in AML and identifies novel, biologically and clinically relevant defined AML subgroups. Additionally, we demonstrate that despite these distinct patterns, a set of genes can be identified that is consistently aberrantly methylated and silenced in AML versus normal controls, indicating their likely involvement as a common epigenetic pathway in the leukemic transformation process. Finally, we describe a 15 gene DNA methylation classifier capable of predicting overall survival in an independent cohort of patients and validated as an independent risk factor in a multivariate analysis, demonstrating the potential of epigenetic markers for use even in patients for whom clinical biomarkers are not currently available.
INTRODUCTION
Acute myeloid leukemia (AML) is a highly heterogeneous disease from the biological and clinical standpoint. This remains a significant barrier toward the development of accurate clinical classification, risk stratification, and targeted therapy of this disease. Epigenetic control of gene expression has been suggested to play a pivotal role in determining the biological behavior of cells. One such epigenetic mechanism is DNA cytosine methylation, which can alter gene expression by creating new binding sites for methylation-dependent repressor proteins (Jones et al., 1998; Nan et al., 1998), or by disrupting the ability of transcription factors to bind to their target sequences (Kanduri et al., 2000; Watt and Molloy, 1988). In normal development, the proper distribution of DNA methylation plays a critical role in tissue differentiation and homeostasis (Li et al., 1992; Okano et al., 1999). Disruption of normal DNA methylation distribution is a hallmark of cancer and can play critical roles in initiation, progression, and maintenance of the malignant phenotype. For example, aberrant hypermethylation and silencing of certain tumor suppressor genes such as p15CDKN2B has been widely reported in leukemias and other myeloid neoplasms (Cameron et al., 1999; Christiansen et al., 2003; Shimamoto et al., 2005; Toyota et al., 2001). We recently showed that hypermethylation and silencing of the master regulatory transcription factor CEBPA was associated with a leukemia entity with T cell/myeloid features, hypermethylation of a number of additional transcriptional regulators, and distinctive biological features (Figueroa et al., 2009b; Wouters et al., 2007).
Based on these data, we hypothesized that DNA methylation distributes into specific patterns in cancer, and that these methylation profiles impose and reflect critical biological differences with practical clinical and therapeutic implications. In order to test this hypothesis, we performed a comprehensive exploration of DNA patterning in human disease, focusing on a well-characterized cohort of 344 patients with AML.
RESULTS
AML Is Composed of Epigenetically Distinct Diseases
Because the molecular heterogeneity of AML remains only partially resolved, the first goal of our study was to determine whether DNA methylation profiling could identify new clinically and biologically relevant disease subtypes. For that purpose, blast cells of 344 newly diagnosed AML patients were subjected to DNA methylation profiling of over 50,000 CpG dinucleotides contained within ~14,000 unique gene loci using the HELP (HpaII tiny fragment enrichment by ligation-mediated PCR) method (Figueroa et al., 2009a; Khulan et al., 2006). Table 1 summarizes patients’ characteristics. DNA methylation measured by HELP was highly concordant with a quantitative single locus DNA methylation validation assay (correlation coefficient r = −0.88) in these AML patients (see Figure S1A available online). An unsupervised analysis using hierarchical clustering (1 - Pearson correlation distance and Ward’s clustering method) showed that leukemias could be distinctly grouped according to their methylation profiles. A cut-off of 16 clusters was selected for further analysis since this segregation most accurately overlapped with the currently known molecular subtypes of AML while at the same time revealing the existence of additional epigenetic differences among the remaining patients. The stability of these clusters was verified by performing comparison of multiple cluster analyses using a decreasing number of probe sets (based on alternative cutoffs of across-patient standard deviation, Figures S1B–S1E). Table 2 shows the clinical, cytogenetic, and molecular features of each of the 16 clusters. Three of these patient clusters correspond to AML subtypes defined by the World Health Organization classification (WHO, 2008) (Figure 1), another eight clusters were enriched for cases harboring specific genetic or epigenetic lesions, and the remaining five clusters could not be explained by any known morphologic, cytogenetic, or molecular feature. Each of these DNA methylation-defined AML subtypes displayed a unique epigenetic signature when compared with normal bone marrow CD34+ cells (Figure 2 and Tables S3A–S3P). Taken together, these data indicate that DNA methylation is not randomly distributed in AML blasts but rather is organized into highly coordinated and well-defined patterns. In most cases the AML subgroups showed a very strong hypermethylation signature as compared with normal marrow CD34+ cells. In contrast, a few of the clusters were hypomethylated in comparison to normal controls. This distinctive patterning is highly suggestive of a biologically significant role for altered DNA methylation in these different AML subtypes. The data also suggest that the most prevalent tumor-associated abnormality in gene promoter DNA methylation abundance is not always hypermethylation but can also be hypomethylation.
Table 1.
Patient Characteristics
| Gender | Total (%) |
|---|---|
| Male | 188 (54) |
| Female | 156 (46) |
| Age | Total (%) |
| < 60 years | 294 (85%) |
| > 60 years | 50 (15%) |
| Median years (range) | 48 (15-77) |
| FAB | Total (%) |
| M0 | 12 (3.5%) |
| M1 | 75 (21.8%) |
| M2 | 82 (23.8%) |
| M3 | 9 (2.6%) |
| M4 | 65 (18.9%) |
| M5 | 70 (20.3%) |
| M6 | 3 (0.87%) |
| NA* | 28 (8.1%) |
| Cytogenetics | Total (%) |
| inv(16)/t(16;16) | 30 (9%) |
| t(8;21) | 24 (7%) |
| t(15;17) | 10 (3%) |
| t(9;22) | 2 (0.6%) |
| t(6;9) | 3 (0.9%) |
| t(v;11q23) | 13 (3.8%) |
| 3q abnormalities | 2 (0.6%) |
| del5(q)/del7(q) | 19 (5.5%) |
| Trisomy 8 | 14 (4%) |
| del9q | 8 (2.3%) |
| Complex | 8 (2.3%) |
| Normal | 152 (44%) |
| Other | 43 (12.5%) |
| NAa/Failure | 13 (3.8%) |
| Cytogenetic risk | Total (%) |
| Favorable | 53 (15%) |
| Intermediate | 231 (67%) |
| Unfavorable | 47 (14%) |
| NAa | 14 (4%) |
| CEBPA abnormalities | Total (%) |
| Double mutation | 24 (7%) |
| Single mutation | 11 (3.1%) |
| Silenced | 8 (2.4%) |
| Wild-type | 301 (87.5%) |
| NPM1 mutation | Total (%) |
| Negative | 239 (69.5%) |
| Positive | 105 (30.5%) |
| FLT3-ITD | Total (%) |
| Negative | 248 (72%) |
| Positive | 96 (28%) |
| EVI1 abnormalities | Total (%) |
| Negative | 317 (92%) |
| Positive | 27 (8%) |
For more patient details, please see Table S1.
NA, not available.
Table 2.
Summary of Clinical, Cytogenetic and Molecular Features of the 16 DNA Methylation Clusters
| Cluster No. | 1 | 2 | 3 | 4 | 5 | 6 | 7 | 8 | 9 | 10 | 11 | 12 | 13 | 14 | 15 | 16 | Total |
|---|---|---|---|---|---|---|---|---|---|---|---|---|---|---|---|---|---|
| N | 26 | 55 | 31 | 14 | 34 | 8 | 31 | 24 | 9 | 6 | 9 | 12 | 45 | 18 | 12 | 10 | 344 |
| Clinical Markers | |||||||||||||||||
| Gender | |||||||||||||||||
| Male | 12 | 36 | 22 | 8 | 19 | 4 | 17 | 12 | 5 | 4 | 5 | 6 | 25 | 6 | 4 | 3 | 188 |
| Female | 14 | 19 | 9 | 6 | 15 | 4 | 14 | 12 | 4 | 2 | 4 | 6 | 20 | 12 | 8 | 7 | 156 |
| Age | |||||||||||||||||
| <60 yr | 24 | 37 | 29 | 13 | 27 | 8 | 25 | 20 | 8 | 6 | 9 | 11 | 43 | 16 | 10 | 8 | 294 |
| >60 yr | 2 | 18 | 2 | 1 | 7 | 0 | 6 | 4 | 1 | 0 | 0 | 1 | 2 | 2 | 2 | 2 | 50 |
| FAB | |||||||||||||||||
| M0 | 0 | 6 | 0 | 0 | 3 | 0 | 0 | 0 | 0 | 2 | 0 | 0 | 0 | 0 | 0 | 1 | 12 |
| M1 | 0 | 9 | 6 | 10 | 6 | 0 | 21 | 4 | 2 | 3 | 0 | 5 | 2 | 4 | 2 | 1 | 75 |
| M2 | 0 | 13 | 20 | 3 | 11 | 0 | 5 | 6 | 2 | 0 | 0 | 6 | 6 | 3 | 5 | 2 | 82 |
| M3 | 0 | 0 | 1 | 0 | 1 | 7 | 0 | 0 | 0 | 0 | 0 | 0 | 0 | 0 | 0 | 0 | 9 |
| M4 | 23 | 8 | 3 | 1 | 2 | 1 | 1 | 7 | 1 | 0 | 0 | 0 | 8 | 4 | 3 | 3 | 65 |
| M5 | 3 | 6 | 1 | 0 | 7 | 0 | 4 | 3 | 0 | 0 | 9 | 1 | 26 | 6 | 2 | 2 | 70 |
| M6 | 0 | 1 | 0 | 0 | 0 | 0 | 0 | 0 | 0 | 0 | 0 | 0 | 1 | 1 | 0 | 0 | 3 |
| NA | 0 | 12 | 0 | 0 | 4 | 0 | 0 | 4 | 4 | 1 | 0 | 0 | 2 | 0 | 0 | 1 | 28 |
| Cytogenetic Markers | |||||||||||||||||
| Cytogenetic class | |||||||||||||||||
| inv(16)/t(16;16) | 26a | 2 | 1 | 0 | 1 | 0 | 0 | 0 | 0 | 0 | 0 | 0 | 0 | 0 | 0 | 0 | 30 |
| t(8;21) | 0 | 0 | 22 | 0 | 0 | 0 | 1 | 0 | 0 | 0 | 0 | 0 | 0 | 1 | 0 | 0 | 24 |
| t(15;17) | 0 | 0 | 1 | 0 | 1 | 8b | 0 | 0 | 0 | 0 | 0 | 0 | 0 | 0 | 0 | 0 | 10 |
| t(9;22) | 0 | 1 | 0 | 0 | 0 | 0 | 1 | 0 | 0 | 0 | 0 | 0 | 0 | 0 | 0 | 0 | 2 |
| t(6;9) | 0 | 0 | 0 | 0 | 0 | 0 | 0 | 2 | 0 | 0 | 0 | 0 | 1 | 0 | 0 | 0 | 3 |
| t(v;11q23) | 0 | 0 | 0 | 0 | 0 | 0 | 0 | 5 | 0 | 0 | 6 | 1 | 0 | 1 | 0 | 0 | 13 |
| 3q | 0 | 1 | 0 | 0 | 1 | 0 | 0 | 0 | 0 | 0 | 0 | 0 | 0 | 0 | 0 | 0 | 2 |
| del5(q)/del7(q) | 0 | 12 | 1 | 0 | 1 | 0 | 1 | 1 | 0 | 1 | 0 | 0 | 0 | 0 | 1 | 1 | 19 |
| tri8 | 0 | 1 | 0 | 0 | 0 | 0 | 2 | 2 | 1 | 0 | 1 | 0 | 5 | 1 | 0 | 1 | 14 |
| del9q | 0 | 1 | 0 | 3 | 2 | 0 | 1 | 0 | 1 | 0 | 0 | 0 | 0 | 0 | 0 | 0 | 8 |
| Complex | 0 | 3 | 1 | 0 | 1 | 0 | 0 | 1 | 0 | 2 | 0 | 0 | 0 | 0 | 0 | 0 | 8 |
| Normal | 0 | 17 | 4 | 10 | 19 | 0 | 17 | 10 | 6 | 1 | 1 | 7 | 33 | 11 | 8 | 8 | 155 |
| Other | 0 | 13 | 0 | 1 | 5 | 0 | 7 | 3 | 0 | 2 | 0 | 3 | 2 | 4 | 3 | 0 | 43 |
| NA/Failure | 0 | 0 | 1 | 0 | 3 | 0 | 1 | 1 | 1 | 0 | 1 | 1 | 4 | 0 | 0 | 0 | 13 |
| Cytogenetic risk | |||||||||||||||||
| Favorable | 20 | 1 | 24 | 0 | 2 | 5 | 1 | 0 | 0 | 0 | 0 | 0 | 0 | 0 | 0 | 0 | 53 |
| Intermediate | 6 | 32 | 4 | 14 | 25 | 3 | 27 | 15 | 8 | 3 | 6 | 10 | 41 | 17 | 11 | 9 | 231 |
| Unfavorable | 0 | 22 | 2 | 0 | 3 | 0 | 2 | 8 | 0 | 3 | 2 | 1 | 1 | 1 | 1 | 1 | 47 |
| Molecular Markers | |||||||||||||||||
| CEBPA | |||||||||||||||||
| Double mutant | 0 | 0 | 2 | 14 | 0 | 0 | 0 | 0 | 5 | 0 | 0 | 0 | 0 | 0 | 3 | 0 | 24 |
| Single mutant | 0 | 3 | 1 | 0 | 1 | 0 | 2 | 0 | 2 | 0 | 0 | 0 | 1 | 1 | 0 | 0 | 11 |
| Silenced | 0 | 3 | 0 | 0 | 0 | 0 | 0 | 0 | 0 | 6 | 0 | 0 | 0 | 0 | 0 | 0 | 9 |
| Wild-type | 26 | 49 | 28 | 0 | 33 | 8 | 29 | 24 | 2 | 0 | 9 | 12 | 44 | 17 | 9 | 10 | 300 |
| NPM1 | |||||||||||||||||
| Wild-type | 26 | 54 | 30 | 14 | 26 | 8 | 17 | 13 | 7 | 6 | 9 | 2 | 8 | 7 | 9 | 3 | 239 |
| Mutated | 0 | 1 | 1 | 0 | 8 | 0 | 14 | 11 | 2 | 0 | 0 | 10 | 37 | 11 | 3 | 7 | 105 |
| FLT3-ITD | |||||||||||||||||
| Negative | 26 | 45 | 28 | 12 | 28 | 4 | 18 | 15 | 7 | 6 | 9 | 4 | 21 | 11 | 9 | 5 | 248 |
| Positive | 0 | 10 | 3 | 2 | 6 | 4 | 13 | 9 | 2 | 0 | 0 | 8 | 24 | 7 | 3 | 5 | 96 |
| EVI1 | |||||||||||||||||
| Negative | 26 | 42 | 31 | 14 | 31 | 8 | 30 | 17 | 9 | 6 | 8 | 12 | 45 | 16 | 12 | 10 | 317 |
| Positive | 0 | 13 | 0 | 0 | 3 | 0 | 1 | 7 | 0 | 0 | 1 | 0 | 0 | 2 | 0 | 0 | 27 |
NA, not available. Cytogenetic class is defined in order of importance according to the 1999 WHO classification (Harris et al., 1999): t(8;21), inv(16), t(15;17), Complex (>3 clonal abnormalities), del5(q)/del7(q), 3q indicates any abnormality involving 3q, t(6;9), t(9;22), 11q23 indicates any abnormality involving 11q23, tri8 indicates trisomy 8, del9q, NN indicates no abnormalities in karyotype, Other indicates that it does not classify in any other group. For complete cytogenetic and molecular information for each patient, see Tables S1 and S2. Also, see Figure S2 for CEBPA methylation status of case 5630, which is in cluster 10.
including four inv(16) cases detected by CBFB-MYH11 fusion gene PCR.
including three t(15;17) cases detected by PML-RARA fusion gene PCR.
Figure 1. DNA Methylation Segregates AML Patients into 16 Groups.
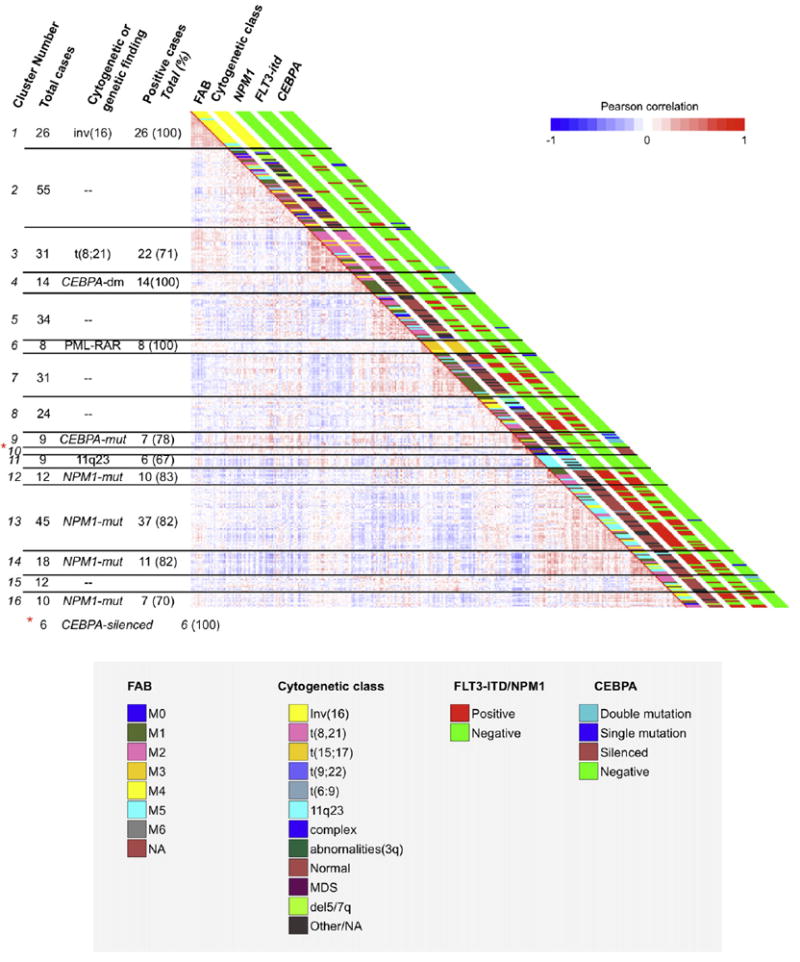
Heatmap representation of a correlation matrix in which each patient’s DNA methylation profile is correlated with that of the other patients in the data set. Patients are ordered according to the unsupervised analysis (hierarchical clustering) results, so that highly correlated patients are located next to each other. Parallel bars on the right of the heatmap have been used to indicate the principal cytogenetic and molecular findings for each patient. Cluster membership and cluster feature summaries are described on the left of the heatmap. Additional information is shown in Figure S1.
Figure 2. Distinct DNA Methylation Signatures Define each of the 16 Clusters.
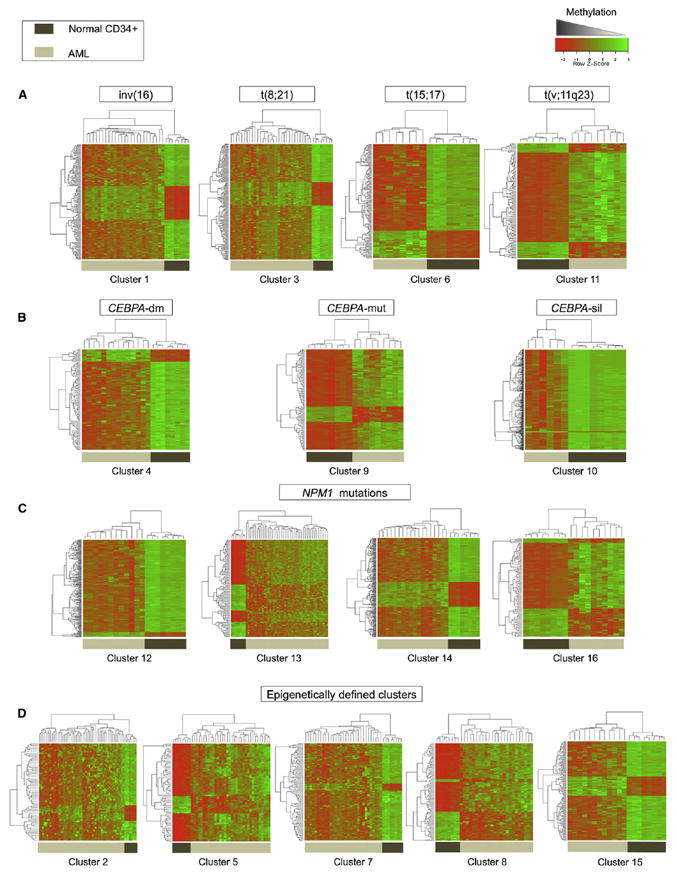
Heatmap representation of the aberrant DNA methylation signatures of specific clusters compared with a cohort of normal CD34+ hematopoietic cells obtained from healthy donors. Each row of the heatmap represents one probe set of the HELP array, and each column represents an AML patient (denoted by light brown bars) or a healthy donor (denoted by dark brown bars). (A) DNA methylation signatures for clusters with recurrent translocations, (B) DNA methylation signatures associated with abnormalities of CEBPA, (C) DNA methylation signatures for clusters presenting NPM1 mutations, (D) DNA methylation signatures for the five epigenetically defined clusters. The complete information for each cluster is contained in Table S3.
Cytogenetically Defined AML Subtypes Have Unique Epigenetic Signatures
The WHO classification of AML defines cases with t(8;21), inv(16), and t(15;17) translocations or the presence of the relevant fusion genes as separate entities indicative of a favorable clinical prognosis (WHO, 2008; Bloomfield et al., 1998; Grimwade et al., 1998). All three of these AML subtypes presented with a unique methylation profile. Methylation cluster 1 (n = 26) consisted entirely of cases carrying either inv(16) or t(16;16) (22/26 cases), or the CBFB-MYH11 fusion gene (4/26). Methylation cluster 3 was significantly enriched for cases positive for t(8;21) (22/31 cases, Fisher’s exact test p value < 1.85 E–25), and all cases in methylation cluster 6 carried the t(15;17) or the PML-RARA fusion gene (8/8 cases). Patients in the two core binding factor clusters did not further segregate according to cKit mutation status, indicating that the presence of this mutation does not result in a specific DNA methylation pattern. Supervised analysis comparing each of these clusters to a cohort of normal CD34+ cells from healthy donors revealed that they all exhibited a unique signature, with a strong shift toward genes being methylated in the AML subtypes compared with CD34+ normal marrow blasts. (Figure 2 and Table S3). The data are consistent with a scenario whereby each of these fusion oncoproteins can drive epigenetic patterning in hematopoietic cells, and/or cooperate to drive leukemogenesis when specific sets of complementary genes are deregulated through aberrant DNA methylation.
Cluster 3 included nine cases that did not present with the t(8;21) or AML1-ETO fusion gene, yet the survival curves of these patients were indistinguishable from the 22 t(8;21) positive patients in cluster 3 (log rank test, p value = 0.83). This finding reflects the ability of DNA methylation profiles to identify a subset of patients with comparable risk and epigenetic patterning to that of t(8;21) patients despite their lack of the aberrant AML1-ETO fusion gene. Even though the number of patients is small, the robustness of this common epigenetic profile is reflected in the fact that these patients all continue to cluster together even when different numbers of probe sets are used in the analysis (Figures S1B–S1E). Furthermore, unsupervised analysis of these patients using gene expression data failed to segregate them according to the presence or absence of the t(8;21) (Figure S1F).
Epigenetic Differences Define NPM1-Mutated, CEBPA-Mutant, and CEBPA-Silenced AMLs
Methylation profiling defined 13 additional AML subtypes. Four of those methylation clusters (clusters no. 12, 13, 14, and 16) were all significantly enriched for cases carrying NPM1 mutations (Bonferroni adjusted Fisher’s exact test p values: < 0.0008, < 9.4 E–14, < 0.02, and < 0.048, respectively). Mutations in exon 12 of the NPM1 gene, which result in aberrant cytoplasmic localization of the protein, constitute an independent favorable prognostic marker in AML (Falini et al., 2005). However, when this mutation occurs in the context of an associated FLT3-ITD, then this favorable prognostic impact is lost (Thiede et al., 2006). The NPM1 mutant clusters 12 and 13 were enriched for characteristic morphological subtypes, i.e., FAB M1/M2 (11/12) and M4/M5 (34/45), respectively. The variety of NPM1 methylation clusters could not be explained solely by the presence or absence of concurrent FLT3-ITD (Table 2). Although the four clusters were all enriched for NPM1 mutations, they still presented enough unique characteristics to separate into 4 methylation clusters, each of them with a specific aberrant DNA methylation signature (Figure 2 and Table S3). Differential methylation in cluster 12 consisted almost entirely of hypermethylated genes, whereas aberrant DNA methylation in the remaining NPM1 clusters was more evenly distributed between hyper- and hypomethylation when compared with normal controls. These data support the notion that NPM1 mutations play a dominant role in defining AML biology, but can be modified to a significant extent by additional alterations in epigenetic or unidentified genetic factors. A significant difference in overall survival was observed for the NPM1 clusters 12, 13, 14, and 16 (log rank test, p = 0.02), when compared with clusters 1, 3, and 4, which contained patients with inv(16), t(8;21), and CEBPA double mutations (CEBPA-dm), respectively (Figure 3A). These differences in survival remained significant after adjustment for age, cytogenetic risk, NPM1 mutation, and FLT3-ITD mutation status following multivariate analysis (Figure 3B).
Figure 3. DNA Methylation Captures Clinically Significant Differences among AML Patients.
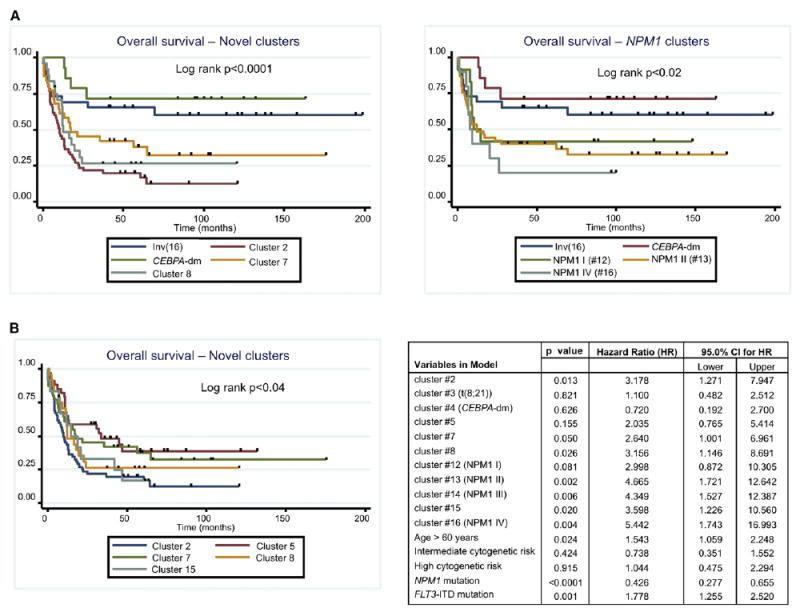
(A) Left: Kaplan-Meier curves for overall survival for the favorable risk clusters 1 (inv(16)) and 4 (CEBPA-dm), and the novel epigenetically defined clusters. For plotting simplicity curves for clusters 3 (t[8;21]), cluster 5 and cluster 15 were not included in the plot. Figure S3 shows a Kaplan-Meier plot including all the clusters in the overall survival analysis. Right: Kaplan-Meier curves for overall survival for the favorable risk clusters 1 (inv[16]) and 4 (CEBPA-dm), and the NPM1 clusters. For plotting simplicity, curves for clusters 3 (t[8;21]) and NPM1 cluster 14 were not included in the plot. Figure S3 shows a Kaplan-Meier plot including all the clusters in the overall survival analysis.
(B) Kaplan-Meier curves for overall survival (left) for the five novel clusters. Right: Table summarizing the multivariate Cox proportional hazards regression model, using cluster 1 (inv[16]) as the referent cluster. Additional Kaplan Meier plots are shown in Figure S3.
The CEBPA transcription factor is a critical mediator of hematopoietic cell differentiation (Mueller and Pabst, 2006), and CEBPA-dm AMLs are associated with a favorable clinical prognosis (Wouters et al., 2009). These cases split into two distinct subtypes with different methylation signatures. Methylation cluster 4 displayed a markedly hypermethylated profile and consisted entirely of CEBPA-dm cases (n = 14; Fisher’s exact test p < 6.88 e-19). The clinical outcome of cluster 4 patients was even better than the known favorable risk core-binding factor leukemias, i.e., t(18;21) and inv(16) (2-year overall survival ± standard error [SE]; 78.6% ± 11.0%) (Figure 3A). DNA methylation cluster 9 was also significantly enriched for CEBPA mutant cases (n = 7/9, Fisher’s exact test p < 0.000009), most of which (5/7) harbored CEBPA double mutations. However, the cluster 9 signature was predominantly hypomethylated versus controls, suggesting that these CEBPA-related leukemias are biologically distinct from the CEBPA-dm cluster 4. Cluster 9 contained insufficient numbers to allow for a comparative survival estimate.
Five of the six patients in cluster 10 had previously been shown to display a phenotype featuring CEBPA hypermethylation and silencing (CEBPAsil), a hypermethylated gene profile, but with hypomethylation of certain T cell genes, T cell lineage infidelity, and poor clinical outcome (Figueroa et al., 2009b; Wouters et al., 2007). The remaining patient in this cluster 10 had not previously been recognized as a CEBPAsil leukemia (case 5360), but was demonstrated upon further investigation in this study to indeed display all the characteristic features of CEBPAsil leukemias (Figure S2 and data not shown). Mutations or silencing of CEBPA thus appear to result in or to be associated with three epigenetically distinct forms of leukemia.
Unique Epigenetic Differences Independent of (Cyto)genetically Defined AML Subtypes
Methylation clusters 2, 5, 7, 8, and 15 were defined solely by their DNA methylation profiles and could not be explained by the enrichment of any currently known recurrent cytogenetic, molecular, or clinical feature (Table 2). Each of these AML subtypes displays a unique and significant epigenetic signature versus normal CD34+ controls (Table S3). Normal cytogenetics AML cases were distributed among all five clusters, and although 5 of 24 cases in cluster 8 harbored 11q23 abnormalities, this was not a defining feature of the cluster because it represented only 20.8% of the cases. Gene expression profiles of each of these epigenetically defined clusters were obtained in a supervised analysis comparing them with a set of normal CD34+ controls. Each of the five clusters presented with a distinct gene expression profile. Figure 4A shows the top-scoring networks associated with each of these expression signatures. Aberrantly expressed genes far exceeded and only partially overlapped with the aberrantly methylated genes in each cluster, which suggests that even relatively small changes in epigenetic patterns can have a significant biological impact in the cell. In order to determine the biological impact of this epigenetic deregulation, we performed an integrative pathway analysis of the combined aberrantly methylated and aberrantly expressed genes. This analysis revealed that each of these clusters resulted in deregulation of different canonical pathways. Cluster 5 showed deregulation of immunity-related pathways, involving immunodeficiency signaling, cytotoxic T-cell-mediated apoptosis, and T cell receptor signaling. Cluster 2, on the other hand, was the only one that significantly deregulated p53 signaling. Clusters 8 and 15 showed predominant deregulation of pathways involved in molecular mechanisms of cancer, deregulating genes in the DNA damage repair mechanism such as ATM, CHK1, MDM2, and FANCD2, genes involved in cell-cycle regulation such as CDK4 and CYCLIN D, as well as genes from the AKT signaling pathway (Figure 4B). Most notably, a significant difference in survival was observed between these novel AML subtypes. For instance, clusters 5 and 7 correlated with an evidently better outcome (2 year overall survival ± SE; 58.8% ± 8.4% and 45.2% ± 8.9% for clusters 5 and 7, respectively, versus 23.6% ± 5.7%, 26.4% ± 9.2%, and 33.3% ± 13.6%, for clusters 2, 8, and 15, respectively) (log rank test, p = 0.04). After adjustment for age, cytogenetic risk, NPM1 mutation, and FLT3-ITD mutation status in a multivariate Cox proportional hazards regression model including all the clusters with at least ten patients, four of the five novel clusters presented a statistically significant increased hazard ratio with respect to the favorable risk inv(16) cluster, whereas cluster 5 did not reach statistical significance (Figure 3B). Epigenetic profiling thus identified a clinically relevant and significant difference among AML subtypes not captured by other methodologies.
Figure 4. Pathway Analysis for the Epigenetically Defined Clusters.
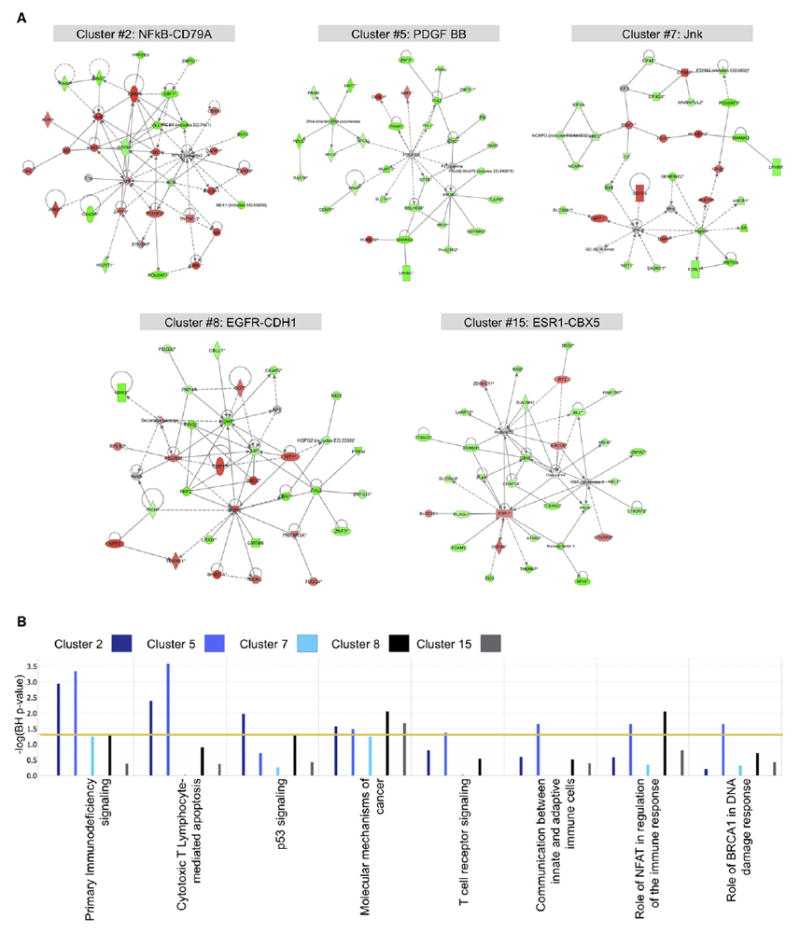
(A) Top scoring aberrantly expressed gene networks for each of the five epigenetically defined clusters. Genes overexpressed compared with normal CD34+ cells are colored in red, whereas downregulated genes appear in green.
(B) Comparative analysis of the most significantly deregulated canonical pathways of the five epigenetically defined clusters as captured by an integration of the aberrant epigenetic and gene expression signatures.
AMLs Present a Common Epigenetic Signature of Consistently Aberrantly Methylated Genes
Although the above studies were geared toward finding the unique signatures of epigenetically defined AML subtypes, we also wondered whether a set of genes could be defined whose DNA methylation was consistently deregulated across all the AML subtypes. We indeed identified a common aberrant DNA methylation signature consisting of 45 genes, most of them hypermethylated, that was consistently detected in at least 10 of the 16 clusters’ methylation signatures and affecting at least 70% of the cases studied (Figure 5A). Genes in this signature are likely to be part of a common epigenetic pathway involved in leukemic transformation of hematopoietic cells. Among these genes we found the tumor suppressor PDZD2, transcriptional regulators (ZNF667, ZNF582, PIAS2, CDK8), nuclear import receptors (TNPO3, IPO8), and CSDA, a repressor of GM-CSF. A complete list of the genes in this common signature is found in Table S4.
Figure 5. 45 Genes Are Consistently Aberrantly Methylated in AML.

(A) Heatmap representation of the common 45 gene signature consistently aberrantly methylated in AML. Each row represents a probe set from the HELP microarray and each column represents a sample.
(B) Boxplots of gene expression levels in 4 representative genes from the 45 gene common epigenetic signature demonstrating downregulation of expression in the AML samples compared with normal CD34+ cells. The list of genes is shown in Table S4.
We next looked at the gene expression levels of these genes on Affymetrix HGU133 Plus 2.0 microarrays performed on the same patients (Verhaak et al., 2009), and compared them with those of a cohort of normal CD34+ bone marrow cells. Eight of 45 genes had to be excluded from the analysis due to failure of the gene expression probe sets (n = 6) or because of lack of representation of the transcript of interest on the expression arrays (n = 2). For the remaining 37 genes, in all but 5 we found either complete silencing or downregulation of the corresponding transcript. Eighteen of these showed the expected differential gene expression when compared with normal CD34+ cells (analysis of variance [ANOVA] followed by Dunnett’s test p < 0.05) (Figure 5B). Four bidirectional promoters showed silencing of one transcript with high expression of the transcript from the opposite strand. The remaining genes were silenced in both the AMLs and the normal CD34+ cells. The latter might be explained, as we have previously shown, by the relative insensitivity of gene expression microarrays to detect differential gene expression of low-abundance transcripts, which can be overcome by looking at the more sensitive epigenetic marks (Figueroa et al., 2008). Alternatively, this finding could reflect the establishment of a more irreversible state of silencing of these genes in the AML blasts compared with the normal CD34+ cells.
A DNA Methylation Classifier Predicts Clinical Outcome in AML
The fact that aberrant DNA methylation of gene promoters represents an epigenetic modification that is stably transmitted among leukemic blasts and that this is done in an organized pattern that correlates with disease subtypes led us to explore its potential as predictor of important clinical features. Moreover, because DNA is relatively stable in clinical samples and DNA methylation is easy to measure, it is very likely that small sets of methylated genes could readily be harnessed as clinically useful biomarkers. Therefore, in order to determine whether we could identify and validate methylation biomarkers of independent prognostic value in AML, we applied a three-step approach of model development and validation. The complete patient cohort was randomly divided into a training set (n = 200), a test set (n = 95), and an independent validation set (n = 49). Cluster membership was not taken into consideration for this part of the analysis. Using the supervised principal components (SuperPC) method of Bair and Tibshirani (2004), a Cox proportional hazards regression model for overall survival was trained with data in the training set (see Supplemental Experimental Procedures). Parameters of the model were chosen so that they maximized performance, as estimated by 10-fold cross-validation on the training set. The model resulting from the maximum cross-validation performance estimate was tested on the test set, found predictive, and used to predict survival status on the independent validation set (Figure 6A). This model included 18 probe sets, corresponding to 15 genes. The predictor model included transcription factors (E2F1, ZFP161), genes related to protein metabolism (USP50, SRR, PRMT7, GALNT5), regulation of telomeres (SMG6), and signaling (CXCR5, LCK) (see Table S5 for the complete list of features used in this model). The predictive performance of this model was validated on the 49-patient independent validation set both for overall survival (hazard ratio: 1.39, 95% CI = 1.10-1.75; p < 0.005; SuperPC score range = −5 to 5) (Figure 6B) and event-free survival (hazard ratio: 1.53, 95% CI = 1.21-1.93; p < 0.0002; SuperPC score range = −5 to 5) (Figure 6C). After controlling for clinical and other known predictors (i.e., age, cytogenetic risk, CEBPA status, NPM1 mutations, and FLT3-ITD), the model was still found informative (multivariate Cox proportional hazards model, hazard ratio: 1.29, 95% CI: 1.11-1.49; p < 0.001) (Figures 6D and 6E). In order to confirm the robustness of DNA methylation markers as predictors of clinical outcome, we performed 30 additional random splits of the data set into a training set of 200 patients and a test set of 144 and ran the SuperPC algorithm with a common set of parameters for all 30 runs. Under these stringent conditions in which the parameters were not individually selected for the optimal threshold in each run, 26 of the 30 runs validated with a significant p value of < 0.05 in a Cox proportional hazards regression model (Table S7). These results demonstrate that DNA methylation status of individual genes can help predict the future survival of the AML patient, and suggest that DNA methylation biomarkers should be evaluated alongside other predictors in future model development and evaluation studies.
Figure 6. A DNA Methylation Classifier Predicts Clinical Outcome in AML Patients.
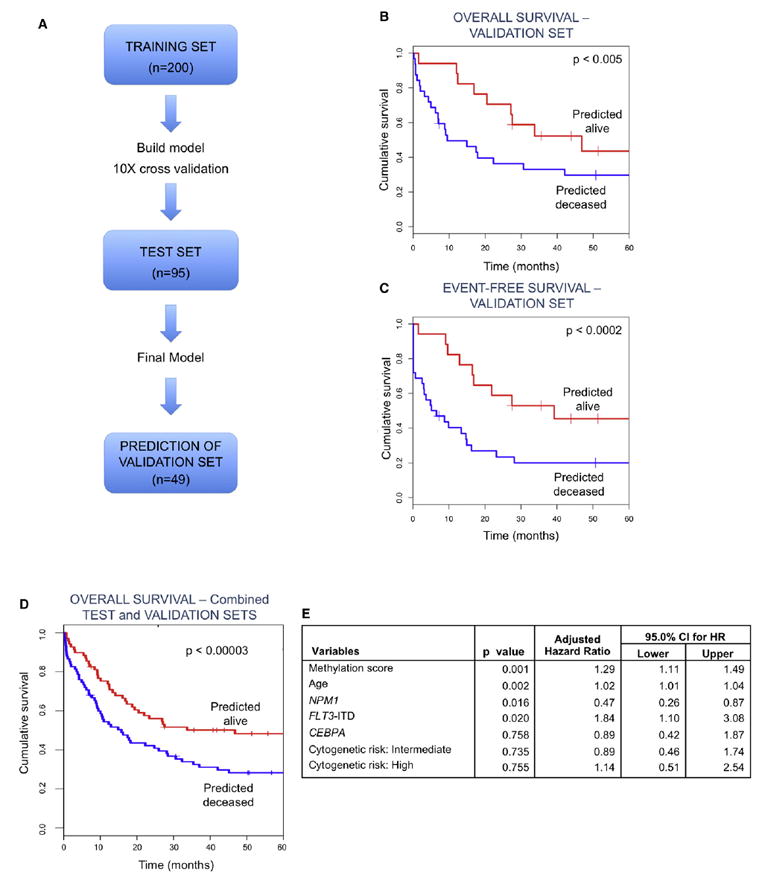
(A) Outline describing the steps for building the DNA methylation classifier. In a first step, 200 randomly selected patients were used to identify HELP probe sets that best predicted survival. The model was then tested on a different cohort of 95 patients (test set). Once the final model was selected, its performance in predicting survival was tested in an independent validation set consisting of 49 randomly selected cases.
(B) Kaplan-Meier curves for overall survival for the predicted groups in the independent validation set. Overall survival was compared between patients in an independent validation set that were predicted either alive or deceased by the DNA methylation classifier. (Cox proportional hazards p < 0.005, hazard ratio = 1.39, 95% CI = 1.10, 1.75).
(C) Kaplan-Meier curves for event-free survival for the predicted groups in the independent validation set. Event-free survival was compared between patients in an independent validation set that were predicted either alive or deceased by the DNA methylation classifier (Cox proportional hazards p < 0.0002, hazard ratio: 1.53, 95% CI = 1.21, 1.93).
(D) Kaplan-Meier curves for overall survival for the predicted groups in the combined test and independent validation sets. Overall survival was compared between patients in the combined test and independent validation sets that were predicted either alive or deceased by the DNA methylation classifier. (Cox Proportional hazards p < 0.000003, hazard ratio: 1.34, 95% CI = 1.18, 1.51).
(E) Multivariate Cox proportional hazards regression model for the DNA methylation predictor, age, cytogenetic risk, NPM1 mutation, FLT3-ITD and CEBPA mutations. For additional information please see Tables S5, S6, S7, and S8, as well as supplementary R scripts.
DISCUSSION
This comprehensive and large-scale study of DNA methylation profiles associated with ~14.000 genes in a human disease demonstrates that epigenetic patterning distributes into signatures of biological and clinical significance and that DNA methylation classifiers can be derived from population studies with clinical predictive power. From the biological standpoint, these data offer an opportunity to better understand the mechanisms through which hematopoietic cells undergo leukemogenesis. Much effort has been invested in identifying genetic lesions that cooperate with known recurrent translocations such as t(8;21), t(15;17) and inv(16) or in patients with normal karyotype leukemia. Although this effort has led to the identification of bona fide leukemogenic mutations such as those in CEBPA, FLT3, and NPM1, it now appears that recurrent genetic lesions insufficiently explain the biological diversity of clinical AML. In contrast, our data show that epigenetic lesions are abundant and common, raising the possibility that a number of the oncogenic lesions in AML could be epigenetic in nature. Thus, further research exploring the contribution of genes affected by aberrant DNA methylation seems warranted.
The clinical significance of DNA methylation profiles is underlined by the fact that it contributes to identifying groups of patients that share a common clinical outcome, in some cases even beyond what their cytogenetic class is, such as the case of cluster 3 leukemias. This cluster, which was enriched for t(8;21) patients, included others without this cytogenetic marker, however, there was no difference in survival between the two subgroups. Although some of the patients negative for the t(8;21) presented other cytogenetic and molecular indicators of favorable risk, this finding reflects the existence of a common DNA methylation profile for these patients. This epigenetic signature aggregated these leukemias together beyond the presence of other molecular and cytogenetic markers, and in addition identified additional cases that did not present with any favorable risk indicator. Similarly, a hypermethylated gene signature defines a subset of leukemias with CEBPA silencing due to hypermethylation, T cell lineage infidelity, resistance to myeloid growth factors, and a poor prognosis (Figueroa et al., 2009b). These cases formed cluster 10 in this cohort. AMLs with mutations on both CEBPA alleles or with homozygous mutations were recently shown to have a highly favorable prognosis (Wouters et al., 2009), and these cases also presented with a defining DNA methylation profile. Taken together, these data warrant considering both of these subtypes as distinct leukemia diseases that should be assigned to risk stratified therapy regimens and explored for the development of specific targeted therapy.
NPM1 mutations distributed to four related but slightly distinct signatures. These epigenetic variations cannot be explained by the presence or absence of a concurrent FLT3-ITD, suggesting that other as yet unrecognized mechanisms might be at play in determining these different epigenetic groups. We were unable to identify a DNA methylation signature associated with FLT3 lesions, indicating that mutations of this gene do not exert their effects in AML by imposing an aberrant epigenetic pattern.
One of the notable findings of this study was the identification of five methylation signatures with no other common morphologic or molecular features, but with distinct clinical outcomes, suggesting that these too are unique forms of AML with their own biological characteristics. It is particularly significant that these AML subtypes cannot be identified by any available diagnostic method, underlining that epigenetic signatures provide a critical layer of additional information. The fact that these cases included both normal karyotype leukemias as well as those with cytogenetic lesions and across multiple FAB subtypes supports a move away from definitions rooted in standard karyotyping, rather toward a more functional classification of AML. Future studies will be required to explore the biological basis of these epigenetically defined subtypes in the effort to develop risk-adapted and molecular targeted clinical trials that more accurately reflect interindividual differences among leukemia patients. However, the presence of a strong hypermethylated signature in some of these clusters (clusters 2, 7, and 15) (Figure 2D) along with their unfavorable prognosis leads us to speculate that these patients, as well as those in the CEBPA-silenced cluster, might benefit from the inclusion of hypomethylating agents as part of their therapeutic regimen.
Furthermore, in this study we identified the presence of a common DNA methylation signature that is detected in the vast majority of cases. The nature of the genes found in this common epigenetic signature, which included tumor suppressors, putative and well-described transcription factors, nuclear import proteins, apoptosis-related proteins, and a regulator of myeloid cytokines, is highly suggestive of a role in leukemic transformation. In addition, we found that this aberrant methylation was accompanied by significant downregulation of these genes. The fact that these genes are affected in a broad fashion, across multiple different subtypes of AML, leads us to believe that deregulation of these genes is most likely a necessary, though probably not sufficient, event during the malignant transformation process of hematopoietic cells.
Finally, the study identified a robust 15 gene methylation classifier that was predictive of overall survival, which was generated in an unbiased manner using a large enough data set to perform training, testing, and independent validation. The methylation predictor was further validated as an independent risk factor in a multivariate analysis. Because DNA is stable and readily obtained from clinical specimens, we believe that this DNA methylation classifier could serve as a clinically useful biomarker used for decision-making in future clinical trials. In conclusion, although epigenetic deregulation has been recognized as a hallmark of cancer for some time, the use of epigenomics to further expand our understanding of the biology of these diseases has only more recently become feasible in the clinical context. Here we show that DNA methylation profiling is a powerful tool for the clinical stratification of AML and to further explore and define the biology of this disease.
EXPERIMENTAL PROCEDURES
Patient Samples
We made use of 344 AML cases collected at Erasmus University Medical Center (Rotterdam) between 1990 and 2008 for which sufficient patient material was available (Valk et al., 2004; Verhaak et al., 2009). Patients had been treated on study protocols of the Dutch-Belgian Hemato-Oncology Cooperative Group (HOVON) (available at http://www.hovon.nl). Patients in the HO04/ A, HO29, and HO42 trials received standard backbone AML treatment and no significant survival difference has been found between these slightly different treatments. The HO43 therapy protocol included patients over 60 years of age and showed a more adverse outcome with increasing age as a prognostic confounder, and for this reason we have included age as a covariable in our statistical analyses. Samples were processed as previously described (Valk et al., 2004; Verhaak et al., 2009). A total of 165 of the patients in this study were included in the 285 patient cohort studied by gene expression by Valk et al. (2004), and the methylation status of 16 patients was previously reported in a publication by our group (Figueroa et al., 2009b). Median follow-up time based on survivors was 71 months (range: 7 months to 215 months). Table 1 summarizes patients’ characteristics, Table S1 shows detailed information for each patient, and Table S2 summarizes treatment information for each cluster. Eight normal bone marrow CD34+ cell specimens were obtained from the Translational Trials Development and Support Laboratory, Cincinnati Children’s Hospital (Cincinnati, OH) and Allcells (Emeryville, CA). This research was approved by the institutional review boards at Weill Cornell Medical College and Erasmus University Medical Center, and written donor informed consent was obtained in accordance with the Declaration of Helsinki.
DNA Methylation Microarrays
High-molecular-weight DNA was isolated from mononuclear cell fractions consisting of > 90% blasts using a standard high salt procedure. The HELP assay was carried out as previously described (Khulan et al., 2006; Figueroa et al., 2009a) and samples were hybridized onto a custom human promoter array covering 25,626 HpaII amplifiable fragments (>50,000 CpGs), annotated to ~14,000 genes (Roche NimbleGen, Design name: 2006-10-26_HG17_HELP_Promoter, Design ID: 4802). HpaII amplifiable fragments (HAF) are defined as genomic regions contained between two flanking HpaII restriction sites that are found between 200 and 2000 bp apart. HAF were first realigned to the HG18 build of the human genome and then annotated to the nearest transcription start site (TSS), allowing for a maximum distance of 5 kb from the TSS. Hybridization and normalization steps are described as supplementary methods. All microarray data are available from the GEO repository (Edgar et al., 2002) (accession number GSE18700).
Gene Expression Microarrays
Gene expression data for these patients had been previously published by Verhaak et al. (2009) (GEO accession number: GSE6891). Briefly, gene expression data were obtained using Affymetrix Human Genome 133 Plus2.0 GeneChips. mRNA isolation, labeling, hybridization, and quality control were carried out as described previously (Valk et al., 2004). Raw data were processed using the GC-RMA package (version 2.16.0) from BioConductor (Wu and Irizarry).
Microarray Data Analysis
Statistical analysis was performed using R 2.8.1 (Team, 2008) and BioConductor (Gentleman et al., 2004). Unsupervised hierarchical clustering of HELP data was performed using the subset of probe sets (n = 3745) with standard deviation > 1 across all cases. We used 1- Pearson correlation distance, followed by a Lingoes transformation of the distance matrix to a Euclidean one (Chessel et al., 2004) and subsequent clustering using Ward’s method. Clusters were considered to be representative of a given molecular or cytogenetic finding when > 50% of cases were positive and a two-sided Fisher’s test was significant at p < 0.05 after adjusting for multiple testing using the Bonferroni method. Identification of the aberrant DNA methylation signature for each cluster was performed using an ANOVA test, with correction for multiple testing according to the Benjamini-Hochberg method, followed by Dunnett’s post hoc test using the normal CD34+ samples as the reference group (Hothorn et al., 2008). Only genes with adjusted p < 0.05 and an absolute difference in log2(HpaII/MspI) ratios > 2 (which corresponds to at least 35% difference in DNA methylation) were selected for each cluster.
Quantitative DNA Methylation Sequencing by MassARRAY EpiTYPER
Validation of HELP data was performed by matrix-assisted laser desorption/ionization time-of-flight mass spectrometry using EpiTYPER by MassARRAY (Sequenom, San Diego, CA) on bisulfite-converted DNA as previously described (Ehrich et al., 2005). MassARRAY primers were designed as previously described (Figueroa et al., 2009b) (see Supplemental Experimental Procedures for primer sequences).
Pathway Analysis
Ingenuity Pathway Analysis software (Redwood City, CA) was used to perform pathway analysis of relevant gene signatures. The top-scoring networks were identified for the gene expression signatures of the epigenetically defined clusters. A comparative analysis of the canonical pathways deregulated in each of the clusters, as captured by the integration of the DNA methylation and gene expression signatures, was also performed. Enrichment for specific pathways was determined relative to the Ingenuity knowledge database using a Benjamini-Hochberg adjusted Fisher’s test, at a significance level of adjusted p < 0.05.
Survival Analysis
Kaplan-Meier survival analysis for overall survival was performed to compare survival differences between different groups of clusters. A multivariate Cox proportional hazards regression model was constructed for the including age, cytogenetic risk, NPM1 mutation status, FLT3-ITD mutation status, and cluster membership as the variables to be tested. Detailed description of the model is found as supplementary methods. All survival analyses were performed in SAS Version 9.2 (SAS Institute, Inc., Cary, NC) and Stata Version 10.0 (StataCorp, College Station, TX).
Development of an Epigenetic Predictive Model for Overall Survival in AML
In order to develop a prognostic biomarker model predictive of AML overall survival we used the supervised principal components (SuperPC) algorithm developed by Bair and Tibshirani (2004). The data set was randomly divided into three groups: a training set (n = 200), a test set (n = 95), and the remaining 49-patient cohort to be used as the independent validation set. Table S6 summarizes the patient characteristics for each of the three groups. Table S8 shows the clinical outcome for each patient in the cohort. A detailed description of the model training, testing and independent validation procedures, as well as the R script used can be found as Supplemental Experimental Procedures.
Supplementary Material
Acknowledgments
The authors are indebted to the colleagues of the bone marrow transplantation group and the molecular diagnostics laboratory of the department of Hematology at Erasmus University Medical Center (Erasmus MC) for storage of samples, molecular analysis, and in vitro culture of leukemia cells. This work was supported by grants from the National Institutes of Health to R.D. (CA118316); a grant from the Dutch Cancer Society “Koningin Wilhelmina Fonds” to R.D., P.J.M.V., and B.L (EMCR 2006-3522), and a grant from ErasmusMC (MRace) to R.D. S.L is supported by a EHA research fellow ship, ‘AGIKO’ fellowship of ZonMW and the Dutch Cancer Society “Koningin Wilhelmina Fonds.” M.E.F. was partially supported by the SASS Foundation Research Fellowship award and by an ASH Fellow Scholar Award. A.M. is supported by NCI R01 CA104348, the Chemotherapy Foundation, the Sam Waxman Cancer Research Foundation, and the G&P Foundation and is a Leukemia and Lymphoma Society Scholar. J.M.G. is supported by a grant from the National Institutes of Health (NIH) (R01 HD044078). F.C. is supported by an Institutional Clinical and Translational Science Award RFA-RM-07-002 and resources from the David A. Cofrin Center for Biomedical Information at Weill Cornell. J.B. is partially supported by an NSF grant: NSF-DMS 085865. P.J.C. and M.M. are supported by a Clinical Translational Science Center (CTSC) Grant (UL1-RR024996). M.E.F., J.M.G., R.D., and A.M. conceived and designed the research; M.E.F., Y.L., and C.E.V. performed the research; M.E.F., S.L., L.S., P.C., X.D., M.M., F.C., E.S., J.B., R.D., and A.M. analyzed the data; B.L., P.J.V., and R.D. contributed research material; B.L., P.J.V., W.V.P., and J.M.G. contributed to data interpretation; M.E.F., S.L., B.L., R.D., and A.M. wrote the manuscript.
Footnotes
SUPPLEMENTAL INFORMATION Supplemental Information includes Supplemental Experimental Procedures, eight tables, and three figures, and can be found with this article online at doi:10.1016/j.ccr.2009.11.020.
ACCESSION NUMBERS All microarray data have been deposited in the Gene Expression Omnibus (GEO) repository from the National Center for Biotechnology Information (NCBI) with the accession code GSE18700.
References
- Bair E, Tibshirani R. Semi-supervised methods to predict patient survival from gene expression data. PLoS Biol. 2004;2:E108. doi: 10.1371/journal.pbio.0020108. [DOI] [PMC free article] [PubMed] [Google Scholar]
- Bloomfield CD, Lawrence D, Byrd JC, Carroll A, Pettenati MJ, Tantravahi R, Patil SR, Davey FR, Berg DT, Schiffer CA, et al. Frequency of prolonged remission duration after high-dose cytarabine intensification in acute myeloid leukemia varies by cytogenetic subtype. Cancer Res. 1998;58:4173–4179. [PubMed] [Google Scholar]
- Cameron EE, Baylin SB, Herman JG. p15(INK4B) CpG island methylation in primary acute leukemia is heterogeneous and suggests density as a critical factor for transcriptional silencing. Blood. 1999;94:2445–2451. [PubMed] [Google Scholar]
- Christiansen DH, Andersen MK, Pedersen-Bjergaard J. Methylation of p15INK4B is common, is associated with deletion of genes on chromosome arm 7q and predicts a poor prognosis in therapy-related myelodysplasia and acute myeloid leukemia. Leukemia. 2003;17:1813–1819. doi: 10.1038/sj.leu.2403054. [DOI] [PubMed] [Google Scholar]
- Chessel D, Dufour AB, Thioulouse J. The ade4 package - I: One-table methods. R News. 2004;4:5–10. [Google Scholar]
- Edgar R, Domrachev M, Lash AE. Gene Expression Omnibus: NCBI gene expression and hybridization array data repository. Nucleic Acids Res. 2002;30:207–210. doi: 10.1093/nar/30.1.207. [DOI] [PMC free article] [PubMed] [Google Scholar]
- Ehrich M, Nelson MR, Stanssens P, Zabeau M, Liloglou T, Xinarianos G, Cantor CR, Field JK, van den Boom D. Quantitative high-throughput analysis of DNA methylation patterns by base-specific cleavage and mass spectrometry. Proc Natl Acad Sci USA. 2005;102:15785–15790. doi: 10.1073/pnas.0507816102. [DOI] [PMC free article] [PubMed] [Google Scholar]
- Falini B, Mecucci C, Tiacci E, Alcalay M, Rosati R, Pasqualucci L, La Starza R, Diverio D, Colombo E, Santucci A, et al. Cytoplasmic nucleophosmin in acute myelogenous leukemia with a normal karyotype. N Engl J Med. 2005;352:254–266. doi: 10.1056/NEJMoa041974. [DOI] [PubMed] [Google Scholar]
- Figueroa ME, Melnick A, Greally JM. Genome-wide determination of DNA methylation by Hpa II tiny fragment enrichment by ligation-mediated PCR (HELP) for the study of acute leukemias. Methods Mol Biol. 2009a;538:395–407. doi: 10.1007/978-1-59745-418-6_20. [DOI] [PubMed] [Google Scholar]
- Figueroa ME, Reimers M, Thompson RF, Ye K, Li Y, Selzer RR, Fridriksson J, Paietta E, Wiernik P, Green RD, et al. An integrative genomic and epigenomic approach for the study of transcriptional regulation. PLoS ONE. 2008;3:e1882. doi: 10.1371/journal.pone.0001882. [DOI] [PMC free article] [PubMed] [Google Scholar]
- Figueroa ME, Wouters BJ, Skrabanek L, Glass J, Li Y, Erpelinck-Verschueren CAJ, Langerak AW, Lowenberg B, Fazzari M, Greally JM, et al. Genome-wide epigenetic analysis delineates a biologically distinct immature acute leukemia with myeloid/T-lymphoid features. Blood. 2009b;113:2795–2804. doi: 10.1182/blood-2008-08-172387. [DOI] [PMC free article] [PubMed] [Google Scholar]
- Gentleman RC, Carey VJ, Bates DM, Bolstad B, Dettling M, Dudoit S, Ellis B, Gautier L, Ge Y, Gentry J, et al. Bioconductor: open software development for computational biology and bioinformatics. Genome Biol. 2004;5:R80. doi: 10.1186/gb-2004-5-10-r80. [DOI] [PMC free article] [PubMed] [Google Scholar]
- Grimwade D, Walker H, Oliver F, Wheatley K, Harrison C, Harrison G, Rees J, Hann I, Stevens R, Burnett A, Goldstone A. The importance of diagnostic cytogenetics on outcome in AML: analysis of 1,612 patients entered into the MRC AML 10 trial. The Medical Research Council Adult and Children’s Leukaemia Working Parties. Blood. 1998;92:2322–2333. [PubMed] [Google Scholar]
- Harris NL, Jaffe ES, Diebold J, Flandrin G, Muller-Hermelink HK, Vardiman J, Lister TA, Bloomfield CD. World Health Organization classification of neoplastic diseases of the hematopoietic and lymphoid tissues: report of the Clinical Advisory Committee meeting-Airlie House, Virginia, November 1997. J Clin Oncol. 1999;17:3835–3849. doi: 10.1200/JCO.1999.17.12.3835. [DOI] [PubMed] [Google Scholar]
- Hothorn T, Bretz F, Westfall P. Simultaneous inference in general parametric models. Biom J. 2008;50:346–363. doi: 10.1002/bimj.200810425. [DOI] [PubMed] [Google Scholar]
- Jones PL, Veenstra GJ, Wade PA, Vermaak D, Kass SU, Landsberger N, Strouboulis J, Wolffe AP. Methylated DNA and MeCP2 recruit histone deacetylase to repress transcription. Nat Genet. 1998;19:187–191. doi: 10.1038/561. [DOI] [PubMed] [Google Scholar]
- Kanduri C, Pant V, Loukinov D, Pugacheva E, Qi CF, Wolffe A, Ohlsson R, Lobanenkov VV. Functional association of CTCF with the insulator upstream of the H19 gene is parent of origin-specific and methylation-sensitive. Curr Biol. 2000;10:853–856. doi: 10.1016/s0960-9822(00)00597-2. [DOI] [PubMed] [Google Scholar]
- Khulan B, Thompson R, Ye K, Fazzari MJ, Suzuki M, Stasiek E, Figueroa ME, Glass J, Chen Q, Monyagna C, et al. Comparative isoschizomer profiling of cytosine methylation: the HELP assay. Genome Res. 2006;16:1046–1055. doi: 10.1101/gr.5273806. [DOI] [PMC free article] [PubMed] [Google Scholar]
- Li E, Bestor TH, Jaenisch R. Targeted mutation of the DNA methyltransferase gene results in embryonic lethality. Cell. 1992;69:915–926. doi: 10.1016/0092-8674(92)90611-f. [DOI] [PubMed] [Google Scholar]
- Mueller BU, Pabst TB. C/EBP[alpha] and the pathophysiology of acute myeloid leukemia. Curr Opin Hematol. 2006;13:7–14. doi: 10.1097/01.moh.0000190110.08156.96. [DOI] [PubMed] [Google Scholar]
- Nan X, Ng HH, Johnson CA, Laherty CD, Turner BM, Eisenman RN, Bird A. Transcriptional repression by the methyl-CpG-binding protein MeCP2 involves a histone deacetylase complex. Nature. 1998;393:386–389. doi: 10.1038/30764. [DOI] [PubMed] [Google Scholar]
- Okano M, Bell DW, Haber DA, Li E. DNA methyltransferases Dnmt3a and Dnmt3b are essential for de novo methylation and mammalian development. Cell. 1999;99:247–257. doi: 10.1016/s0092-8674(00)81656-6. [DOI] [PubMed] [Google Scholar]
- Shimamoto T, Ohyashiki JH, Ohyashiki K. Methylation of p15(INK4b) and E-cadherin genes is independently correlated with poor prognosis in acute myeloid leukemia. Leuk Res. 2005;29:653–659. doi: 10.1016/j.leukres.2004.11.014. [DOI] [PubMed] [Google Scholar]
- Team, R. Development Core. R: A language and environment for statistical computing (Vienna: R Foundation for Statistical Computing) 2008 [Google Scholar]
- Thiede C, Koch S, Creutzig E, Steudel C, Illmer T, Schaich M, Ehninger G. Prevalence and prognostic impact of NPM1 mutations in 1485 adult patients with acute myeloid leukemia (AML) Blood. 2006;107:4011–4020. doi: 10.1182/blood-2005-08-3167. [DOI] [PubMed] [Google Scholar]
- Toyota M, Kopecky KJ, Toyota MO, Jair KW, Willman CL, Issa JP. Methylation profiling in acute myeloid leukemia. Blood. 2001;97:2823–2829. doi: 10.1182/blood.v97.9.2823. [DOI] [PubMed] [Google Scholar]
- Valk PJ, Verhaak RG, Beijen MA, Erpelinck CA, Barjesteh van Waalwijk van Doorn-Khosrovani S, Boer JM, Beverloo HB, Moorhouse MJ, van der Spek PJ, Lowenberg B, Delwel R. Prognostically useful gene-expression profiles in acute myeloid leukemia. N Engl J Med. 2004;350:1617–1628. doi: 10.1056/NEJMoa040465. [DOI] [PubMed] [Google Scholar]
- Verhaak RG, Wouters BJ, Erpelinck CA, Abbas S, Beverloo HB, Lugthart S, Lowenberg B, Delwel R, Valk PJ. Prediction of molecular subtypes in acute myeloid leukemia based on gene expression profiling. Haematologica. 2009;94:131–134. doi: 10.3324/haematol.13299. [DOI] [PMC free article] [PubMed] [Google Scholar]
- Watt F, Molloy PL. Cytosine methylation prevents binding to DNA of a HeLa cell transcription factor required for optimal expression of the adenovirus major late promoter. Genes Dev. 1988;2:1136–1143. doi: 10.1101/gad.2.9.1136. [DOI] [PubMed] [Google Scholar]
- WHO, IARC. World Health Organization Classification of Tumors of Haematopoietic and Lymphoid Tissues. 4. Lyon: International Agency for Cancer [IARC]; 2008. [Google Scholar]
- Wouters BJ, Jorda MA, Keeshan K, Louwers I, Erpelinck-Verschueren CA, Tielemans D, Langerak AW, He Y, Yashiro-Ohtani Y, Zhang P, et al. Distinct gene expression profiles of acute myeloid/T-lymphoid leukemia with silenced CEBPA and mutations in NOTCH1. Blood. 2007;110:3706–3714. doi: 10.1182/blood-2007-02-073486. [DOI] [PMC free article] [PubMed] [Google Scholar]
- Wouters BJ, Lowenberg B, Erpelinck-Verschueren CA, van Putten WL, Valk PJ, Delwel R. Double CEBPA mutations, but not single CEBPA mutations, define a subgroup of acute myeloid leukemia with a distinctive gene expression profile that is uniquely associated with a favorable outcome. Blood. 2009;113:3088–3091. doi: 10.1182/blood-2008-09-179895. [DOI] [PMC free article] [PubMed] [Google Scholar]
- Wu Z, Irizarry R. gcrma: Background Adjustment Using Sequence Information. R package version 2.16.0 [Google Scholar]
Associated Data
This section collects any data citations, data availability statements, or supplementary materials included in this article.