Abstract
Objective
To construct a predictive model for vaginal birth after cesarean (VBAC) that combines factors that can be ascertained only as the pregnancy progresses with those known at initiation of prenatal care.
Study design
Using multivariable modeling, we constructed a predictive model for VBAC that included patient factors known at the initial prenatal visit as well as those that only became evident as the pregancy progressed to the admission for delivery.
Results
9616 women were analyzed. The regression equation for VBAC success included multiple factors that could not be known at the first prenatal visit. The area under the curve for this model was significantly greater (P < .001) than that of a model that included only factors available at the first prenatal visit.
Conclusion
A prediction model for VBAC success that incorporates factors that can be ascertained only as the pregnancy progresses adds to the predictive accuracy of a model that uses only factors available at a first prenatal visit.
Keywords: trial of labor, vaginal birth after cesarean, prediction
When deciding to attempt a vaginal birth after cesarean (VBAC), women must weigh the risks and benefits of undertaking a trial of labor (TOL). Of primary importance in that decision are two probabilities – the chance of successful vaginal delivery and the chance of uterine rupture. Although multiple risk factors for both these events have been reported, constructing accurate and reliable prediction models that can indicate the individual-specific risks of these events for pregnant women undergoing a TOL has proven difficult. Currently, there is no model that accurately predicts uterine rupture. 1,2 Conversely, better prediction has been achieved regarding the chance of VBAC success.3
Recently, we published a model that accurately predicts the probability of achieving a VBAC once a TOL is undertaken.3 The prediction model utilized factors that were available at a woman's first prenatal visit and included maternal age, race, and body mass index (BMI), history of vaginal delivery or VBAC, and whether there was a recurrent indication for cesarean. Developing a model limited to just these factors is important, as it is optimal to begin counseling for a TOL long before a patient is admitted for delivery. Nevertheless, some individual factors (such as induction of labor) that are not available early in pregnancy have been reported to be associated with the chance of successful VBAC.4,5 Conceivably, these factors also could be incorporated into a model and provide women with a refined probability prediction that incorporates their most recent circumstances. Yet, it remains unknown if the incorporation of these “proximate-to-delivery” variables will actually enhance the predictive ability of the model.
In this study, we investigated the hypothesis that factors that become evident only as the pregnancy progresses will improve the prediction of VBAC compared to prediction based solely upon factors known at the first prenatal visit.
Materials and Methods
Nineteen academic medical centers belonging to the Eunice Kennedy Shriver National Institute of Child Health and Human Development Maternal-Fetal Medicine Units Network contributed to a registry of all pregnant women with a prior cesarean who delivered at their institutions between 1999 and 2002. In this registry, all identified women had their charts abstracted for demographic data, medical and obstetric history, and intrapartum and postpartum events. Further details of the methodology of this study have been described previously.6 In the present analysis, only women who underwent a TOL at term (at least 37 weeks of gestation) with a vertex singleton gestation and one prior low-transverse cesarean were included. Women with an antepartum intrauterine fetal demise were excluded. Approval for the study was obtained from the Institutional Review Board of each institution.
In the previous development of a prediction model based only on factors available at the first prenatal visit, we had determined that multivariable logistic regression was the technique of choice to optimize VBAC prediction.3 Thus, in the development of the present nomogram, which also incorporates factors that are only known as the pregnancy progresses, a multivariable logistic regression was again utilized. Variables entered into the regression for possible inclusion in the predictive model were those already demonstrated at the first prenatal visit to have predictive potential (maternal age, BMI at first prenatal visit, race/ethnicity, prior vaginal delivery, and recurrent indication for cesarean) as well as new variables that could not be known at the first prenatal visit for women receiving adequate prenatal care. A recurrent indication for cesarean was defined to occur when the prior cesarean was performed due to arrest of dilation or decent. These variables included demographic variables (most recent BMI within 2 weeks of delivery, estimated gestational age at delivery), variables related to the development of obstetric conditions during the gestation but prior to the delivery (gestational diabetes mellitus), and variables related to specific circumstances at admission (preeclampsia before or at the admission for delivery, cervical exam findings at admission for delivery, and the undertaking of labor induction). Preeclampsia included women with mild and severe disease. Any variables that were not available at the time of admission for delivery, such as birth weight or need for labor augmentation, were not included in the model, as the most relevant time of counseling would occur prior to the course of labor.
Marginal exploratory analysis was performed to determine whether the continuous variables were best represented in the model as continuous or categorical forms. This analysis revealed that BMI, estimated gestational age, and the cervical exam (dilation, effacement, and station) provided the most predictive ability if they were included in the model as continuous variables. Similarly, categorical variables that were related to one another (such as mild and severe preeclampsia) were assessed to determine whether they were best included in the model as multiple dichotomous variables, or if they should be combined into a single categorical variable. With regard to the “labor induction” variable, a clinically meaningful estimated coefficient was only obtainable through the use of the pseudo-maximum likelihood approach.7 Using this approach, we first estimated the coefficient of this variable marginally in a univariable logistic regression. This estimated coefficient was then fixed in the multivariable logistic regression model.
Only patients with complete observations for all the variables were included in the development of the model. The predictive power of the model was evaluated by the c-statistic, which represents the area under the curve (AUC) of the receiver-operating characteristic (ROC) curve. A graphical nomogram was also produced for the model so that the individual-specific probabilities of VBAC could be easily approximated.
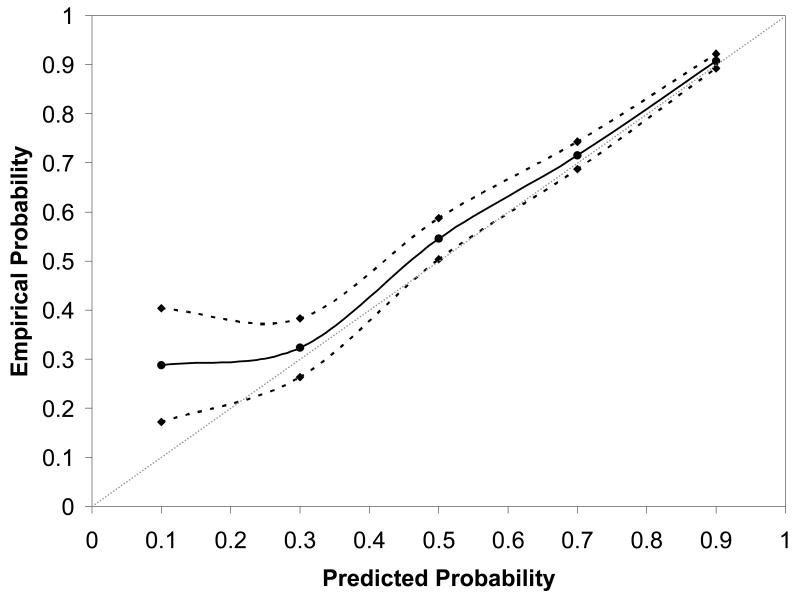
The predictive model was validated through a cross-validation strategy.8 The complete data set was randomly and approximately equally divided into a training set and a test set. The logistic regression model that had been derived from the training set was then applied to the test set. This strategy allowed the generation of a calibration graph. The estimated model was applied to the test set, and the resulting predicted probabilities of successful VBAC were partitioned into 5 groups (e.g. 0-20%, 21-40%, etc.). The mid points of these probability ranges (e.g. 10%, 30%, etc.) were used to represent these groups. In each group, the proportion of women with a successful VBAC (i.e. the observed probability) was calculated. The scatter plots of the predicted and observed VBAC probabilities were smoothly connected to form a curve. The ideal validation would generate a 45-degree straight line. Corresponding 95% confidence intervals for the curve were calculated based on the normal distribution approximation.
Lastly, we compared the model derived in the present analysis to the previously developed and published model that included factors limited to the first prenatal care visit. Only patients who had all prediction variables known for both models were used for this comparative analysis. The ROC curves as well as the calibration curves were compared. Additionally, the difference between the models with regard to the probability of VBAC was calculated for each patient. SAS version 8.2 (SAS Institute, Cary, NC) was used for all analysis, with the exception of the smoothing of the calibration curves, which was performed with Microsoft Excel (Microsoft, Inc., Redmond, WA).
Results
Of the 11856 women who met inclusion criteria, 9616 had a full set of variables available for analysis and development of the prediction model that included “proximate to delivery” variables. Of these women, 7066 (73.5%) had a successful VBAC.
The multivariable logistic regression equation that was built to predict the probability of a successful VBAC and was derived from factors that could be ascertained up until the time of admission for delivery is presented in Appendix A. The individual factors that significantly contributed to prediction of VBAC, and their corresponding odds ratios and 95% confidence intervals, are presented in Table 1. These factors include some that can be determined from the start of pregnancy as well as some that cannot be ascertained until admission for delivery. Of note, all factors that had appeared in the previous prediction model (based on factors available at the first prenatal visit) continued to remain in the new prediction model, with the exception of “initial BMI”. This variable was replaced by “BMI at or within 2 weeks of delivery”, given that this later BMI was more strongly predictive of the outcome of interest. Additional factors that were found to be independently associated with VBAC success but could not be ascertained until later in pregnancy were the development of preeclampsia, a woman's cervical status upon admission for delivery, and the undertaking of labor induction.
Table 1. Factors associated with vaginal birth after cesarean in multivariable logistic regression.
| Variable | Odds ratio | 95% confidence interval |
|---|---|---|
| Maternal age (years) | 0.96 | 0.95 – 0.97 |
| Maternal race | ||
| Caucasian and others | Referent | ----------------- |
| Latina | 0.47 | 0.41 – 0.54 |
| African American | 0.63 | 0.56 – 0.72 |
| Recurring indication for cesarean | 0.52 | 0.47 – 0.58 |
| Any prior vaginal delivery | 2.60 | 2.21 – 3.05 |
| Vaginal delivery after prior cesarean | 2.34 | 1.94 – 2.83 |
| BMI at last prenatal visit (kg/m2) | 0.96 | 0.95 – 0.97 |
| EGA at delivery (weeks) | 0.90 | 0.86 – 0.94 |
| Preeclampsia | 0.61 | 0.45 – 0.82 |
| Cervical effacement at admission (10%) | 1.05 | 1.02 – 1.07 |
| Cervical dilation at admission (cm) | 1.12 | 1.08 – 1.16 |
| Station at admission (fifths scale) | 1.09 | 1.05 – 1.12 |
| Induction of labor* | 0.64 | 0.58 – 0.70 |
BMI = body mass index; EGA = estimated gestational age
marginal estimates
The graphical nomogram derived from the logistic regression is presented in Figure 1. A full description of the method by which the nomogram is used to calculate the probability of VBAC has been previously described.3 In brief, each patient characteristic is aligned with the corresponding number of points on the uppermost point scale. After all patient characteristics are considered, the user sums all points and aligns the sum on the “total points” line with the predicted probability of VBAC. The ROC curve associated with this logistic regression had an AUC (c-statistic) of 0.774 (95% confidence interval 0.764 - 0.784).
Figure 1.
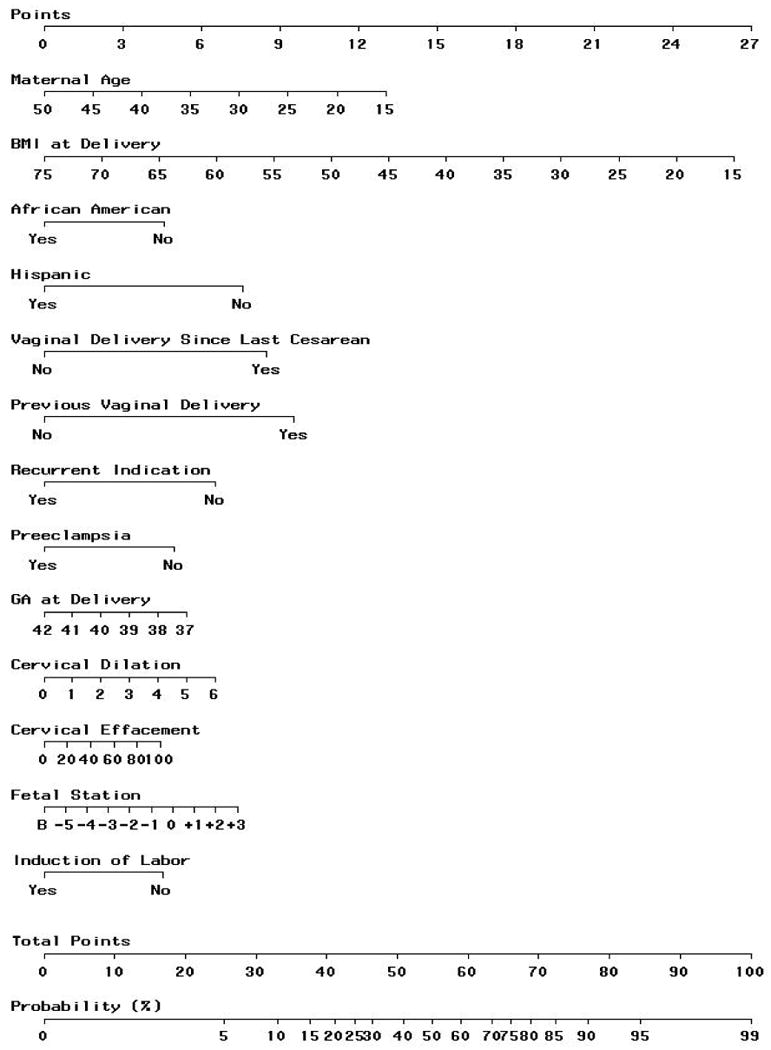
Predictive graphical nomogram, incorporating information available up until the time of admission for delivery, for probability of VBAC success resulting from a trial of labor.
Presented in Figure 2 is the validation curve for the current prediction model. As can be seen, the point estimate of the predicted probability of VBAC success for women in the test set corresponds closely with the probability of VBAC success that these women actually experienced. The narrowness of the 95% confidence band further confirms the adequate calibration of the model.
Figure 2.
Nomogram calibration for the prediction model, derived from the test set, which incorporates patient factors available up until the time of admission for delivery.
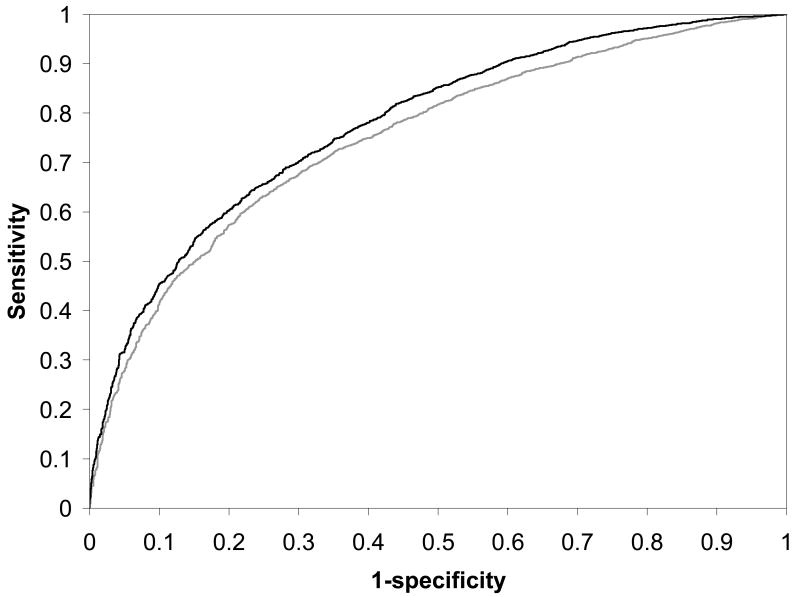
To compare this model with the previously developed model, we identified the subset of patients (N = 6764) in the population who did not have any missing values for the variables in both models. There were 4972 successful VBAC's (73.5%) among the women in this common subset. The c-statistics for the ROC curves were 0.751 (95% C.I. 0.738 – 0.764) and 0.779 (95% C.I. 0.767 – 0.791) for the previous and current models, respectively; these values were significantly different (P < 0.001). Figure 3 provides a comparison of these two ROC curves. This figure also demonstrates the enhanced prediction of the current model at each sensitivity and specificity combination, given that the curve of the new model is always to the left of the curve of the previous model.
Figure 3.
Receiver-operating characteristic (ROC) curves for the logistic regression model for prediction of VBAC success resulting from a trial of labor. The gray curve represents the ROC curve for the logistic model based upon factors available only at the first prenatal visit; the black curve represents the ROC curve for the logistic model that includes factors available up until the time of admission for delivery.
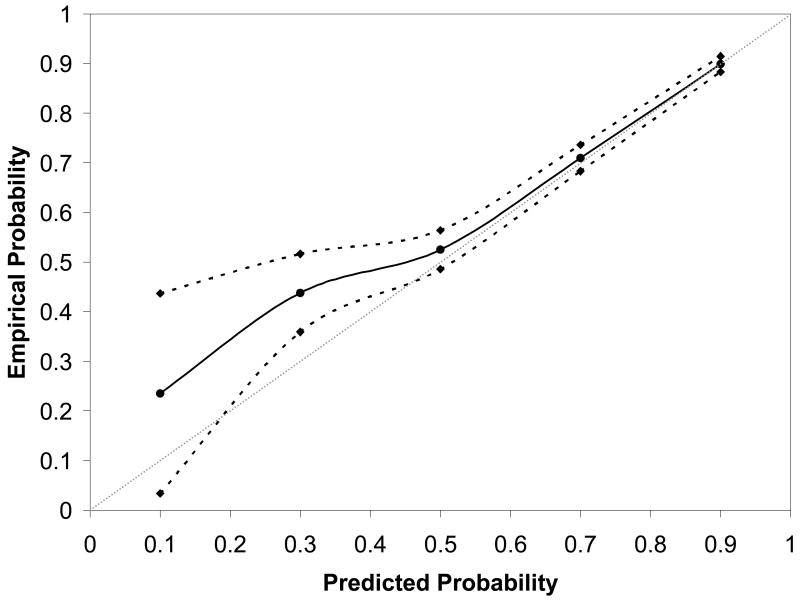
Figure 4, which presents the validation curve for the previously developed prediction model, also demonstrates that the model that incorporates factors that can be ascertained up until the time of admission for delivery is a better predictive model than the previous model that is limited to factors available only at the first prenatal visit. The solid line adheres less closely to the 45-degree validation line and the 95% confidence intervals are wider than in Figure 2, particularly at lower probabilities of VBAC success.
Figure 4.
Nomogram calibration for the prediction model that incorporates patient factors available only at the first prenatal visit. In both figures, the reference line, which an ideal nomogram would produce, is represented by the dotted diagonal line; the actual performance of the current nomogram is represented by the solid line; its 95% confidence band is represented by the two dashed lines. BMI = body mass index.
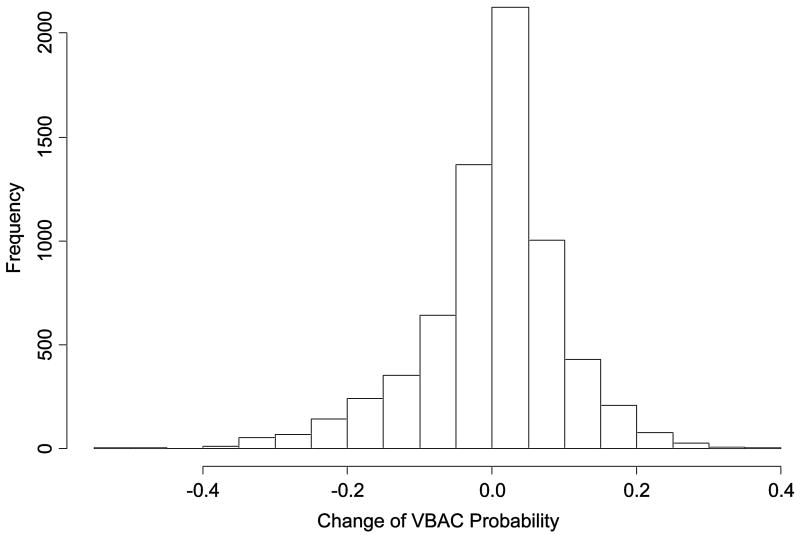
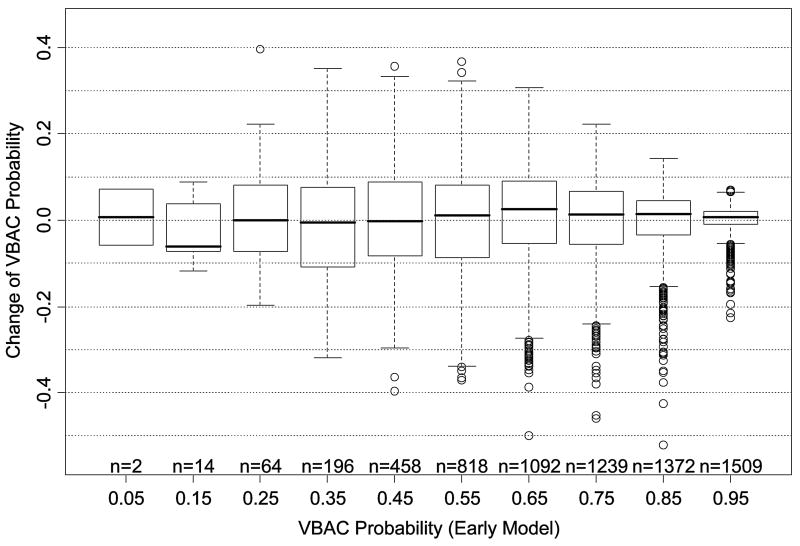
Figures 5a and 5b illustrate the degree to which predicted probability of VBAC for an individual woman differs between the first model (based on factors from the first prenatal visit) and the second model (including factors proximate to delivery). As the histogram in figure 5a demonstrates, in most cases, the probability difference is relatively small between the models. However, in a minority of cases, the difference is large enough to potentially engender a difference in clinical decision making. Figure 5b illustrates the distribution of the differences after stratification by initial predicted probability of VBAC, and demonstrates that the greatest changes in magnitude are actually most likely to be encountered among those women with intermediate probabilities of success.
Figure 5.
Figure 5a. Histogram illustrating the magnitude of probability change, for individual women, between the second (proximate-to-delivery) and first (factors available at the first prenatal care visit) prediction models. VBAC = vaginal birth after cesarean
Figure 5b. Probability change from the first to the second prediction model as a function of a woman's initial probability of vaginal birth after cesarean (VBAC). The solid line within each box represents the median change, while the bottom and top of the box itself represent the amount of change at the first and third quartiles, respectively. Circles represent outlying values.
Comment
In this study, we have demonstrated that the probability of VBAC success for women undergoing a TOL can be predicted using characteristics that are present at the time prenatal care is initiated, and that this model can be further honed by incorporating factors that are apparent only as the pregnancy progresses. The ease of use for the clinician is enhanced by its representation as a graphical nomogram. This prediction model extends the results of our previously published prediction model for VBAC success, which was based solely upon patient characteristics that could be discerned at a first prenatal visit.3 Although the prediction characteristics of that model were good, the characteristics of the present model, with a more extended set of variables, appear to be better, as indicated by an AUC of the ROC that is statistically significantly greater and a validation curve that adheres more closely to the ideal validation line.
Although the newly derived model does appear to provide more accurate prediction, this difference should not be overemphasized. While it is true that the AUC of the new model's ROC curve is statistically greater, the difference between these two curves is relatively small. This does not imply, however, that there could be no clinically meaningful information that an individual woman could derive from the additional use of the second prediction model. ROC curves reflect the prediction of a dichotomous outcome, in this case, whether or not a woman will have a VBAC success. Yet, in predicting outcome for an individual, a more nuanced approach may be useful. That is, a woman and her care provider may be able to make better decisions after being appraised of her individual probability of a successful VBAC. The capacity of the nomogram to estimate this risk is better illustrated by the validation curves. As previously noted, the appearance of these curves indicates that the predicted probability of VBAC success obtained from the newly derived model adheres more closely to the empirical probabilities of VBAC success.
The nomogram itself makes clear how factors ascertained at admission for delivery may change perspective. A 30 year old Caucasian woman with an initial BMI of 25 kg/m2 who has had a cesarean for a breech presentation and who has not had neither a prior vaginal delivery nor any recurrent indication for cesarean has a 75% chance of achieving a VBAC. If she achieves 40 weeks of gestation, is normotensive with a BMI of 40 kg/m2, and requires induction of labor with a cervix 1 cm dilated and 25% effaced, and with the vertex presenting at -3 station, her chance of VBAC success will have decreased to 46%. Figures 4a and 4b graphically depict the point that although the two models will often generate similar probabilities, a potentially meaningful change in probability, such as that noted above, may occur for a tangible subset of women.
We have not incorporated any information into this model that can be ascertained only after admission to the hospital for delivery. Thus, factors such as prolonged labor or birth weights are not included. With regard to the latter, there is little sense in including factors in a prediction model that cannot be known until after the predicted event has occurred. With regard to the former, the reason for exclusion is not that it is fundamentally illogical, but that it is logistically onerous and clinically impractical to include. Theoretically, any number of intrapartum factors could be included in a prediction model for VBAC success. Yet, this would establish the equivalent of a moving target for a patient and her provider, and as different events occurred, the probability of VBAC would need to be constantly updated.
Ultimately, these two models provide insights into the probability of VBAC success if a woman undergoes a TOL, which may be helpful at different points in pregnancy. The decision to undergo a TOL after a prior cesarean often takes prolonged reflection for a given woman, who weighs the risks and benefits that the TOL offers. The initial discussion between a woman and her provider with regard to these issues should, if possible, ideally occur weeks, if not months, before the onset of labor. Therefore, the only information a provider will have when the discussion begins is that information which can be ascertained at the start of pregnancy. Even if the prediction model that uses only the factors available at the first prenatal visit is not as precise at the more extended prediction model, that distinction is initially moot, since the more extended model cannot be utilized. Yet, as the pregnancy progresses, information may become available that will augment predictive ability, and it seems reasonable, given that the more extended model improves the precision of prediction and may materially change the probability of VBAC success for an individual, to try and incorporate this information into decision making close to or at the onset of labor, when the decision to undergo a TOL can be re-evaluated.
There is no one right answer as to whether a woman should or should not have a TOL, as that decision depends upon her own weighing of the risks and benefits, including the probability of VBAC success. Only an accurate representation of this chance, therefore, can maximize her decision-making ability. The prediction model for VBAC success presented here, along with the prediction model previously published (both available at http://www.bsc.gwu.edu/mfmu/vagbirth.html) can, therefore, assist the health care provider and the patient alike.
Acknowledgments
The authors would like to thank the following core committee members who participated in protocol development and coordination between clinical research centers (Francee Johnson, BSN, Julia McCampbell, RN), protocol/data management and statistical analysis (Elizabeth Thom, PhD), and protocol development and oversight (Alan M. Peaceman, MD).
In addition to the authors, other members of the Eunice Kennedy Shriver National Institute of Child Health and Human Development Maternal-Fetal Medicine Units Network are as follows:
Ohio State University — J. Iams, S. Meadows, H Walker
University of Alabama at Birmingham — J. Hauth, A. Northen, S. Tate
University of Texas Southwestern Medical Center — S. Bloom, D. Bradford
University of Utah — M. Belfort, F. Porter, B. Oshiro, K. Anderson, A. Guzman
University of Chicago — J. Hibbard, P. Jones, M. Ramos-Brinson, M. Moran, D. Scott
University of Pittsburgh — K. Lain, M. Cotroneo, D. Fischer, M. Luce
Wake Forest University — M. Swain, C. Moorefield, K. Lanier, L. Steele
Thomas Jefferson University — A. Sciscione, M. DiVito, M. Talucci, M. Pollock
Wayne State University — M. Dombrowski, G. Norman, A. Millinder, C. Sudz, B. Steffy
University of Cincinnati — T. Siddiqi, H. How, N. Elder
Columbia University — F. Malone, M. D'Alton, V. Pemberton, V. Carmona, H. Husami
Brown University — H. Silver, J. Tillinghast, D. Catlow, D. Allard
Northwestern University — M. Socol, D. Gradishar, G. Mallett
University of Miami, Miami, FL — G. Burkett, J. Gilles, J. Potter, F. Doyle, S. Chandler
University of Tennessee — W. Mabie, R. Ramsey
University of Texas at San Antonio — S. Barker, M. Rodriguez
University of North Carolina — K. Moise, K. Dorman, S. Brody, J. Mitchell
University of Texas at Houston — L. Gilstrap, M. Day, M. Kerr, E. Gildersleeve
Case Western Reserve University — P. Catalano, C. Milluzzi, B. Slivers, C. Santori
The George Washington University Biostatistics Center — E. Thom, S. Leindecker, H. Juliussen-Stevenson, M. Fischer
Eunice Kennedy Shriver National Institute of Child Health and Human Development — D. McNellis, K. Howell, S. Pagliaro
Supported by grants from the Eunice Kennedy Shriver National Institute of Child Health and Human Development (HD21410, HD21414, HD27860, HD27861, HD27869, HD27905, HD27915, HD27917, HD34116, HD34122, HD34136, HD34208, HD34210, HD40500, HD40485, HD40544, HD40545, HD40560, HD40512, and HD36801).
Appendix A
Logistic regression equation for prediction of achieving VBAC after a trial of labor: Predicted Probability of Successful VBAC = exp(w)/[1+exp(w)], where w = 7.059 − 0.037(age) − 0.044 (BMI) − 0.460 (African-American race) − 0.761 (Hispanic race) + 0.955 (any prior vaginal delivery) + 0.851 (vaginal delivery after prior cesarean) − 0.655 (recurring indication for cesarean) − 0.109 (estimated gestational age at delivery) − 0.499 (hypertensive disease of pregnancy) + 0.044 (effacement) + 0.109 (dilation) + 0.082 (station) − 0.452 (labor induction)
References
- 1.Grobman WA, Lai Y, Landon MB, Spong CY, Leveno KJ, Rouse DJ, et al. Prediction of uterine rupture associated with attempted vaginal birth after cesarean delivery. Am J Obset Gynecol. doi: 10.1016/j.ajog.2008.03.039. in press. [DOI] [PMC free article] [PubMed] [Google Scholar]
- 2.Macones GA, Cahill AG, Stamilio DM, Odibo A, Peipert J, Stevens EJ. Can uterine rupture in patients attempting vaginal birth after cesarean delivery be predicted? Am J Obstet Gynecol. 2006;195:1148–52. doi: 10.1016/j.ajog.2006.06.042. [DOI] [PubMed] [Google Scholar]
- 3.Grobman WA, Lai Y, Landon MB, Spong CY, Leveno KJ, Rouse DJ, et al. Development of a nomogram for prediction of a vaginal birth after cesarean delivery. Obstet Gynecol. 2007;109:806–12. doi: 10.1097/01.AOG.0000259312.36053.02. [DOI] [PubMed] [Google Scholar]
- 4.Landon MB, Leindecker S, Spong C, Hauth JC, Bloom S, Varner MW, et al. The MFMU cesarean registry: Factors affecting the success of trial of labor after previous cesarean delivery. Am J Obstet Gynecol. 2005;193:1016–23. doi: 10.1016/j.ajog.2005.05.066. [DOI] [PubMed] [Google Scholar]
- 5.Grobman WA, Gilbert S, Landon MB, Spong CY, Leveno KJ, Rouse DJ, et al. Outcomes of induction of labor after one prior cesarean. Obstet Gynecol. 2007;109:262–9. doi: 10.1097/01.AOG.0000254169.49346.e9. [DOI] [PubMed] [Google Scholar]
- 6.Landon MB, Leindecker S, Spong C, Hauth JC, Bloom S, Varner MW, et al. The MFMU cesarean registry: Factors affecting the success of trial of labor after previous cesarean delivery. Am J Obstet Gynecol. 2005;193:1016–23. doi: 10.1016/j.ajog.2005.05.066. [DOI] [PubMed] [Google Scholar]
- 7.Gong G, Samaniego FJ. Psuedo maximum likelihood estimation: theory and applications. Ann Stat. 1981;9:861–9. [Google Scholar]
- 8.Hastie T, Tibshirani R, Friedman J. The elements of statistical learning. Springer-Verlag; 2001. [Google Scholar]


