Abstract
The purpose of the present study was to build a clinically useful automated seizure detection system for scalp EEG recordings. To achieve this, a computer algorithm was designed to translate complex multichannel scalp EEG signals into several dynamical descriptors, followed by the investigations of their spatiotemporal properties that relate to the ictal (seizure) EEG patterns as well as to normal physiologic and artifact signals. This paper describes in detail this novel seizure detection algorithm and reports its performance in a large clinical dataset.
Keywords: seizure detection, scalp EEG, pattern match regularity statistic (PMRS), local maximum frequency, amplitude variation, artifact rejection, sensitivity, false detection rate
1. INTRODUCTION
Seizures result from the sustained, organized, and synchronized discharge of massive numbers of cerebral neurons. Seizures may begin locally in one cerebral hemisphere (where they may remain, or may spread to involve the ipsilateral or both hemispheres diffusely), or they may originate in both cerebral hemispheres simultaneously. Electroencephalography (EEG) is the recording of electrical activity along the scalp produced primarily by summed synaptic potentials of neurons within the cortex of the brain. Long-term EEG monitoring has become a standard procedure for seizure diagnosis and classification and for presurgical evaluation of patients with medically refractory seizures. In the United States, the mean length of stay for patients with intractable epilepsy admitted to an epilepsy monitoring unit (EMU) for diagnosis and/or pre-surgical evaluation ranges from 4.7 to 5.8 days with total aggregate charges exceeding $200 million per year [1].
Long-term video-EEG monitoring is usually performed in an EMU. Typically, seizures recorded in EMUs are identified by direct observation of the medical staff or by patients pressing an alarm. However, observers are sometimes not present and/or patients are often unaware of their seizures [2]. In general, unnoticed seizures can be detected by post hoc review of the continuously recorded video-EEG data. This time-consuming review has to be performed at least by trained EEG technologists in order to achieve acceptable accuracy and sensitivity. However, in most centers, complete review of the entire recording by an electroencephalographer for each patient (mostly 4 to 5 days) is almost impossible due to the high volume of patients and a limited number of qualified EEG experts. As a result, recorded seizures, particularly non-convulsive seizures, can escape detection, potentially compromising patient evaluation and/or unnecessarily prolonging the patient’s hospital stay. Therefore, since the 1980s, attempts have been made to develop computerized algorithms for automated seizure detection systems for scalp (non-invasive) EEG recordings [3–10]. Such a system with reliable detection performance would ensure rapid detection and timely review of seizures, thereby minimizing the time required for diagnosis and reducing manpower requirements for data review and analysis. The use of automated tools could decrease the lengths of stay and result in reduced patient risk, lowered cost per patient, and better utilization of limited specialty resources. However, to date, the high false-positive rate of commercially available automated seizure detectors renders them of limited use.
It has long been recognized that designing a computer algorithm to detect seizures from scalp EEG is much more challenging than that from intracranial/depth recordings (see [11–14] for intracranial EEG seizure detection). Scalp EEGs are more sensitive to the recording environment (e.g., electrode failure, electrical artifacts), muscle and movement artifacts (e.g., chewing), as well as to the normal physiological state changes (e.g., sleep-awake cycle). The EEG patterns of these artifacts and activities share a certain degree of signal characteristics similar to those of ictal EEGs, such as signal amplitude and frequency, and thus could generate numerous false detections. Therefore, a successful scalp EEG seizure detection algorithm must include a robust artifact rejection module that is able to distinguish, spatially or temporally, the signal characteristics between artifact and true ictal EEG epochs.
In this report, we introduce a novel automated seizure detection algorithm for accurate and rapid analysis of long-term scalp EEG recordings to identify ictal EEG segments. The algorithm reads, analyzes, and outputs a binary response (seizure or not seizure) for each sequential 5.12 seconds. For each computation epoch, the analysis involves translating each of the EEG channels into six EEG descriptors: (i) pattern-match regularity statistic (PMRS); (ii) local maximal frequency (LFmax); (iii) amplitude variation (AV); (iv) local minimal; (v) maximal amplitude variation (LAVmin and LAVmax); and (vi) maximal amplitude in a high frequency band (AHFmax). The spatiotemporal patterns of these descriptors are used for detecting ictal EEG epochs as well as rejecting the EEGs with significant artifacts. PMRS is used as the primary detector, whereas the other descriptors are used for artifact rejection. The algorithm generates over 800 descriptor traces (both discrete/binary and continuous variables) across 16 EEG channels. The parameters of the algorithm were trained and optimized based on the detection performance, in terms of detection sensitivity and false detection rate, in 47 long-term scalp EEG recordings (47 subjects, 141 seizures in a total of 3652.5 hours of recording). Its detection performance was then validated in a separate test EEG dataset (55 subjects, 146 seizures in a total of 1208 hours of recording). Using the same test dataset, the performance of the proposed algorithm was compared with commercially-available seizure detection software, Reveal® (Persyst Development Corporation).
Detection delay, defined as the time elapsed between the occurrence of the first clear changes in an electrographic seizure pattern and the first epoch detected by the algorithm, was not included in the performance assessment in this study. For a seizure detection algorithm that is coupled with an automated intervention system aimed at controlling and/or aborting a seizure, it is critical to detect a seizure event within seconds of the electrographic onset. Usually such a detection algorithm is applied to intracranial EEG recordings [15–17]. A scalp EEG-based seizure detection algorithm is usually used for fast off-line long-term EEG review or for on-line detection to alert nursing staff when a seizure occurs. From a validation point of view, the detection delay for these applications is less important than the ability to detect the seizure’s occurrence —electrographic seizure onset times are sometimes indeterminate, even among experienced epileptologists.
The remainder of this paper is organized as follows: Section 2 gives detailed descriptions regarding data characteristics (2.1), EEG descriptor calculations (2.2), detection algorithm design (2.3), and performance assessment and statistical analysis (2.4). Section 3 presents the results of detection performance, its assessment, and statistical comparisons. Section 4 presents the conclusions and discussion.
2. METHODS
2.1. Data Characteristics
2.1.1. Test Subjects
All patients were 18 years of age or older with a history of suspected or intractable seizures admitted to Allegheny General Hospital (AGH, Pittsburgh, PA) or the Medical University of South Carolina (MUSC, Charleston, SC) for long-term EEG-video recordings for diagnostic or pre-surgical evaluation, respectively. Collection and analysis of their EEG recordings was approved by AGH’s and MUSC’s Investigational Review Boards, as well as by the Western Investigational Review Boards (WIRB). All patients whose consents were received were included in the study. There were no exclusion criteria. The participated patients included a statistically equal number of males and females, and an ethnic and racial distribution that reflected the regional population of each clinical site.
2.1.2. Datasets (EEG)
Technical Information
EEG recordings collected from AGH were obtained using 128 channel Nicolet BMSI-6000 long-term monitoring systems (Viasys, Madison, WI, USA) with a 400 Hz sampling rate, whereas data collected from MUSC used XLTEK EEG monitoring systems (Oakville, Ontario, Canada) with a 256 Hz sampling rate; both institutions used a montage that included a 19-electrode international 10–20 system (Fig. 1). Only 16 channels (excluding Fz, Cz, and Pz) from a referential montage were utilized in the proposed seizure detection algorithm. The referential channel was decided at the clinical sites, but was usually placed at a location between Cz and Pz, as recommended by the American Clinical Neurophysiology Society [15]. In order to reduce the effects from muscle and movement artifacts, each of the 16 EEG signals were band-pass filtered with a low cut = 1 Hz and high cut = 20 Hz, which covers the frequency ranges of most of the ictal EEG patterns classified in [16].
Fig. 1.
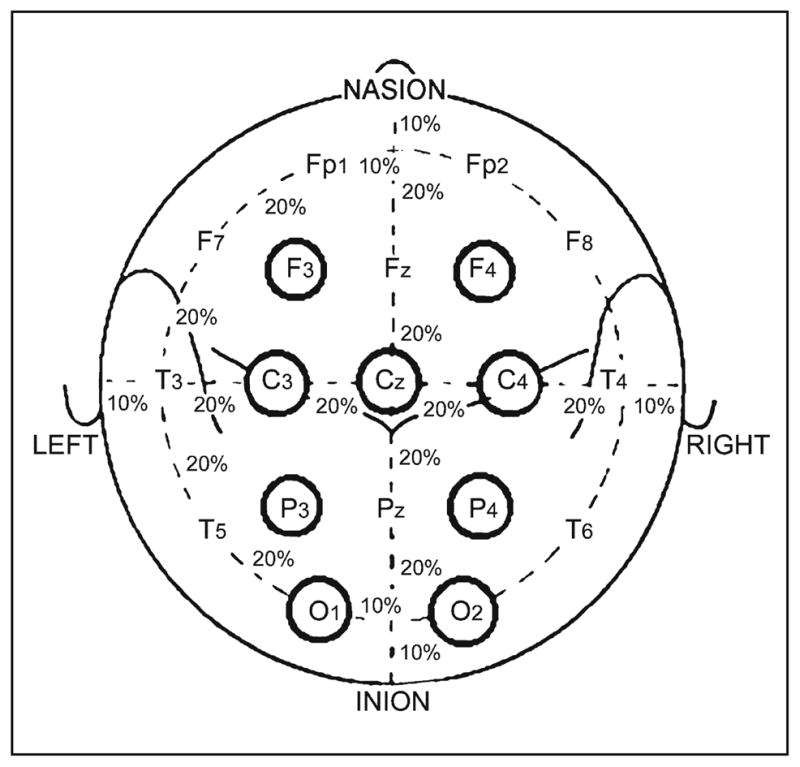
The international 10–20 system seen from above the head: C = central, T = temporal, P = parietal, F = frontal, Fp = frontal polar, and O = occipital.
Training Dataset
This detection algorithm was developed, trained, and optimized in 47 long-term scalp EEG recordings, which contained a total of 141 epileptic seizures in 3652 hours. In order to develop as robust an algorithm as possible, the entire recording from each subject was included in the analysis. As a result, the algorithm was trained with a wide range of seizure patterns, physiologic states, and a variety of artifacts from different resources that are commonly encountered in the clinical setting. Because this dataset was only used for developing and training purposes, identification of the seizure events were primarily based on the clinical seizure reports provided by the collaborative clinical sites (AGHI and MUSC). However, to reduce the possible false positives and negatives from the clinical reports, all the EEG recordings were further reviewed in-house by the algorithm development team. When seizure events were identified in-house but were not noted in the clinical reports (or vice versa), the discrepancies were verified with the investigators at the clinical sites where both EEG and video were available.
Validation Dataset
The data for performance validation consisted of 436 EEG segments, 2 to 3 hours each, sampled from long-term EEG recordings obtained from a separate group of 55 subjects. The total length of the test EEG segments was 1208 hours. Because this dataset was for algorithm validation, it was important that seizure events were determined by an independent review panel that was not involved with the algorithm development. Therefore, all of the EEG segments were independently reviewed by three EEG experts (epileptologists) and a majority rule (i.e., at least 2 out of 3) was applied to determine the occurrences of seizure events in the dataset. As a result, the review panel identified a total of 209 electrographic seizures. However, 53 seizures were identified in one patient, and 7 other subjects had more than 5 seizures identified. To avoid the overall detection performance being overly-contributed from any one patient, seizure events were randomly down-sampled to 5 seizures in all patients with more than 5 reviewer-identified seizures. As a result, a total of 146 electrographic seizures were included in the validation study.
2.2. EEG Descriptors
The seizure detection algorithm calculates six primary EEG descriptors over time (sequential non-overlapping 5.12s) for each of the 16 EEG signals: pattern-match regularity statistic (PMRS), local maximal frequency (LFmax), amplitude variation (AV), local minimal and maximal amplitude variation (LAVmin and LAVmax), and maximal amplitude in a high frequency band (AHFmax). Detailed description for each descriptor is given below.
2.2.1. PMRS
For a given time series data, it is important to know how regular/complex it is. Motivated by the algorithm for calculating approximate entropy (ApEn) [17], we developed a new statistic, PMRS, which quantifies the regularity of a given signal. As with ApEn, it can be used to distinguish normal from abnormal data in instances where moment statistics (e.g., mean and variance) approaches fail to show meaningful differences. Compared to many nonlinear dynamic statistics, a major advantage of PMRS is its ability to interpret both stochastic and deterministic models.
The calculation of ApEn is based on a conditional probability of the next corresponding points being value-matched given that the previous m corresponding points are all value-matched, for a fixed integer m. That is, for any subsequence xi of length m in a given time series U, estimate
where value match is defined as the maximum difference between the corresponding points of two subsequences being less than a critical value r. One main limitation of ApEn is that for a given time series with no further information, it is almost impossible to know how to choose its parameters m and r. For different selections of parameters m and r, ApEn could yield very inconsistent results, even when the choices are within a reasonable range. One reason for this inconsistency could be due to the value match criterion being very sensitive to the critical value r and hence the degree of difficulty to satisfy the value match criterion increases fast even with a small increase of m. Moreover, even when two subsequences are value matched to each other, they may have very different patterns, which could be considered a meaningless match in practice. For example, when the noise portion in a time series has much smaller variation than the other meaningful portion, the value match criterion may have more matches from the subsequences in the noise part. For these reasons, we proposed to use the criterion of pattern match instead of value match to evaluate the regularity of a time series. The following defines the criterion of pattern match.
Suppose that U = {u1, u2, …, un}is the time series to be investigated, and let σ̂u be the sample standard deviation of U. For a fixed integer m, define a series of subsequences of U such that xi = {ui, ui +1, …, ui + m −1}, 1 ≤ i ≤ n − m + 1. Then for a given positive real number r (e.g., r = 0.2σ̂u), xi and xj are considered pattern match to each other if
|ui − uj| ≤ r, |ui + m −1 − uj + m −1| ≤ r, and
for k = 1,2, …, m −1, sign (ui + k − ui + k −1) = sign (uj + k − uj + k −1).
The first condition of this criterion means that the beginning points and the end points of two subsequences must be valued matched, i.e., two subsequences have to be approximately at the same range. The second condition indicates that the points in between must have the same pattern, i.e., pattern matched to each other. Obviously, this matching scheme decreases the degree of dependence on the parameters m and r because the exact value match for the corresponding points of the two subsequences is not required. For the purpose of demonstration, Fig. 2 shows an example of the two subsequences xi and xj that have very similar structure to each other (i.e., pattern match). However, when considering the values for each of the corresponding points, they may not be accepted by the value match criterion depending on how large the critical value r is. Next, we describe how to calculate PMRS using the pattern match criterion.
Fig. 2.
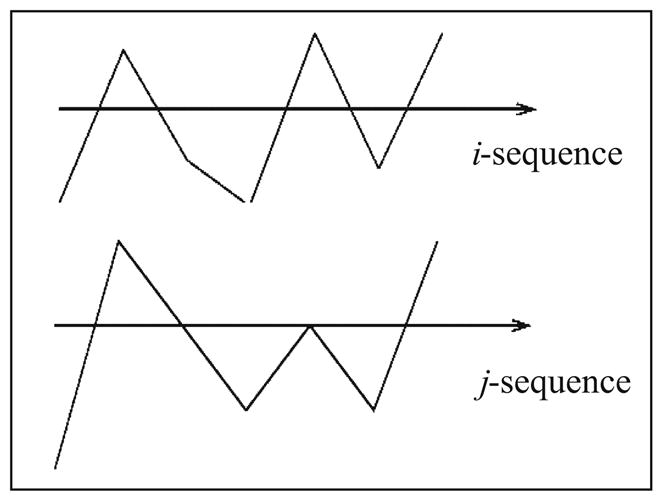
An example of good pattern match but not value match.
The calculation of PMRS is based on the estimation of the conditional probability that the next points of xi and xj have the same change of sign, i.e., sign (ui + m − ui + m −1) = sign (uj + m − uj + m −1), given that xi and xj are pattern-matched to each other. That is, for each subsequence xi of length m, define
where xj is any subsequence of length m in U. Then, by given a time series U of n points, for 1≤ i ≤ n − m, we can estimate pi by using the sequences x1, x2, …, xn − m in U as
and PMRS is calculated as . Intuitively, when the time series U is more regular, p̂i ’s should be larger and therefore PMRS will be smaller.
Simulation Study of PMRS
To demonstrate the utility of PMRS and its comparison with ApEn, we used a MIX(p) process to illustrate the regularity in correlated stochastic processes with a continuous state space (Pincus, 1991). The construction of MIX(p) process is as follows:
Define , for all j = 1,2, ….
Let bj be a family of independent identically distributed (i.i.d.) real random variables with uniform density on the interval [ ].
Let cj be a family of i.i.d. Bernoulli random variables: cj = 1 with probability p and cj = 0 with probability 1 − p, 0 ≤ p ≤ 1.
Define MIX(p)j = (1 − cj) aj + cj bj.
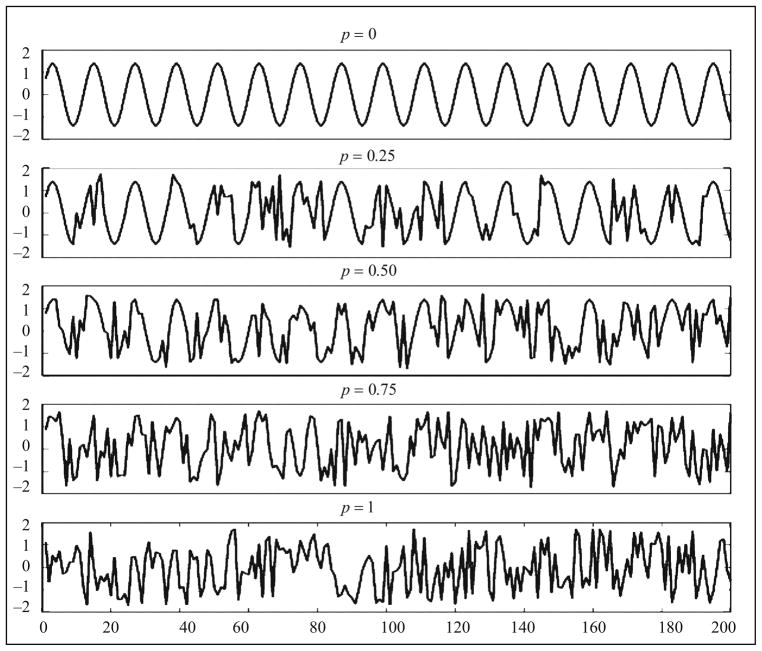
This is a family of stochastic processes that samples a sine wave when p = 0 and samples an i.i.d. uniform random variable when p = 1. Figure 3 shows 200 points of the simulated MIX(p) processes when p = 0, 0.25, 0.50, 0.75, and 1. Obviously, the MIX(p) process becomes more random as p increases. Furthermore, the MIX(p) process has mean 0 and variance 1 for all p, which means that the first and second moment statistics cannot be used to distinguish the degree of regularity (randomness) for different values of p.
Fig. 3.
MIX(p) process for different degree of regularity.
There are two purposes of this comparison. The first purpose is to compare the sensitivity with respect to the change of the randomness parameter p. Theoretically, both PMRS and ApEn should increase when p becomes larger. The second purpose is to compare the consistency of the measure with respect to the different values of parameters m and r in the algorithms. To accomplish these two purposes, PMRS and ApEn profiles (p = 0, 0.01, 0.02, …, 0.99, 1) were generated for m = 2, 3, 4, and 5; r = 0.14, 0.16, 0.18, 0.20, and 0.22. Because the curves may have different scales and we are only interested in how the measures change over p, for the purpose of comparison, the ranges of all curves are normalized from 0 to 1. Each value in the curves is based on an average of 10 values from a Monte Carlo simulation, and the sample size for each simulation is 1000 points.
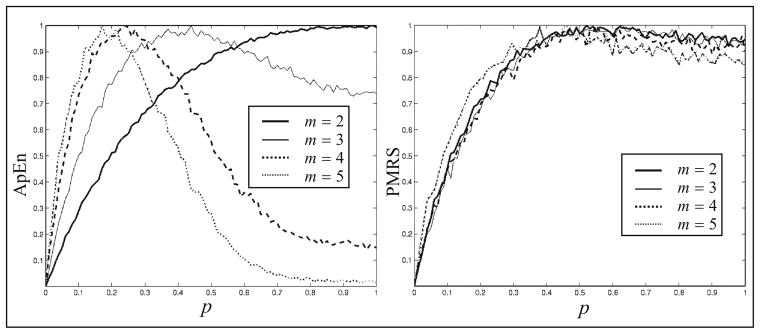
Figure 4 shows the curves of ApEn and PMRS values over p, where the dimension of the constructed subsequences m = 2, 3, 4, and 5, all using a filtering critical value r = 0.18 as used by Pincus (1991). It is clear that ApEn gives inconsistent results with different values of m. Although PMRS could only distinguish well between p = 0 and 0.5, the results are robust across values of m.
Fig. 4.
Normalized ApEn and PMRS versus p in the MIX(p) process for different values of m, given r = 0.18.
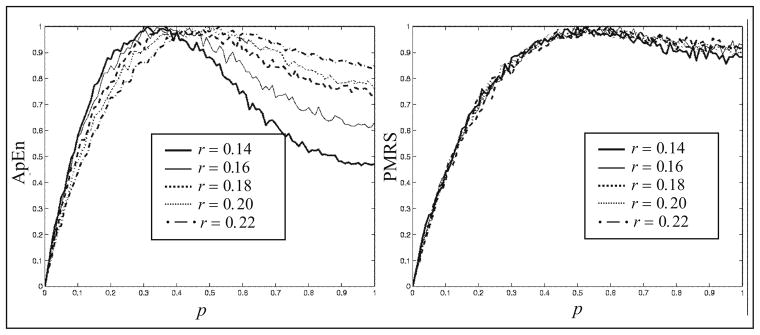
Similarly, Fig. 5 demonstrates comparisons between ApEn and PMRS over different values of r, given that m = 3. Again, ApEn shows inconsistent results for different values of r, whereas the results of PMRS are much more consistent. This is because the pattern match criteria are less dependent on the critical value r. Moreover, in this example, PMRS distinguishes the degree of regularity better than ApEn.
Fig. 5.
Normalized ApEn and PMRS versus p in the MIX(p) process for different values of r, given m = 3.
Demonstration of PMRS on EEG Analysis and Ictal Activities
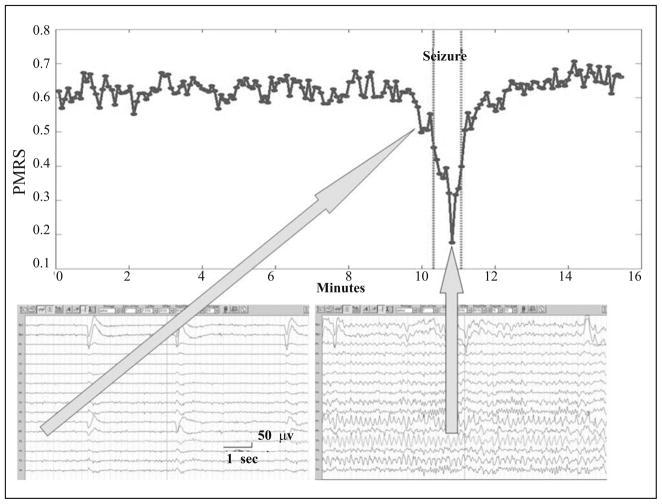
One of the most recognizable signal characteristics of the EEG during a seizure is its highly regular and organized pattern. This pattern usually consists of multiple EEG channels each with a period (seconds to minutes) of continuous repeated waveforms, typically between 2 to 20 Hz in scalp EEG depending on the type of ictal discharge [16]. Because PMRS can be used to detect signals with high regularity, it was used as the primary seizure detector in this seizure detection algorithm. Figure 6 demonstrates the behavior of PMRS values from one EEG channel (T3) that was involved in an ictal discharge. It is clear that, due to the more rhythmic signals during the seizure period, PMRS values drop significantly when compared with the periods before and after the seizure. Therefore, with a proper threshold, the seizure can be easily detected with the change of PMRS values.
Fig. 6.
An example of a PMRS curve before, during, and after a seizure (between the two vertical dotted lines). PMRS values drop significantly during the ictal period compared to the other periods.
2.2.2. EEG Descriptors for Artifact Rejection
Although PMRS can be very sensitive in detecting seizure activities, there are many other EEG patterns with high regularity. For example, the signals dominated by muscle activity are also very regular but with a much higher frequency compared to ictal EEG patterns. Certain sleep EEG patterns can also be very rhythmic and organized, but they usually involve certain EEG channels such as O1 and O2 (occipital region) and have almost no muscle activity. Signals dominated by recording artifacts (due to machine or electrode failure) can be regular but often with much larger amplitudes. To reject these unwanted segments with possible changes in PMRS values, several amplitude- and frequency-based EEG descriptors were incorporated in the detection algorithm.
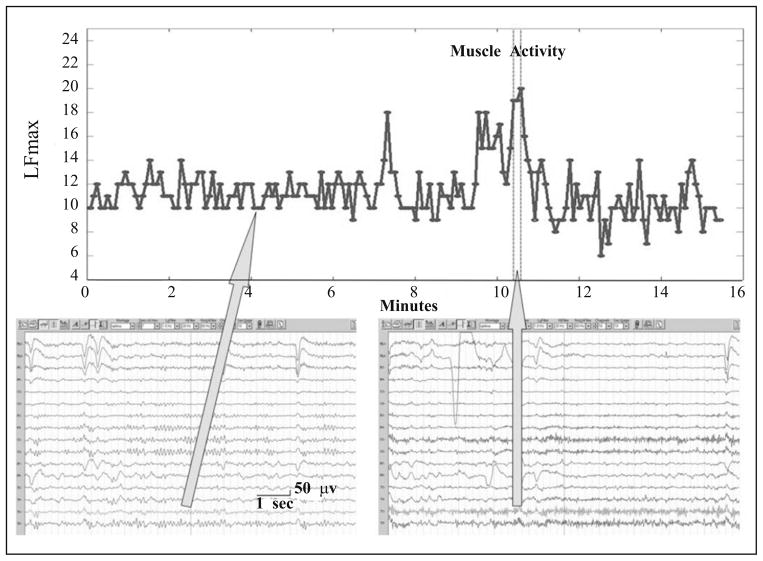
Local maximal frequency (LFmax) observes the maximal frequency of one-directional (negative to positive) zero crossings among the 11 overlapping 1-second time windows within a detection window (5.12 seconds in the algorithm). EEG signals were normalized to zero mean before searching for crossings. Two consecutive 1-second windows are overlapping for 600 ms. LFmax can be used to detect an EEG segment that is dominated by high frequency muscle activities (Fig. 7). LFmax was calculated for each of the 16 EEG channels used in the detection algorithm.
Fig. 7.
An example of an LFmax curve before, during, and after a muscle activity (between the two vertical dotted lines). LFmax values are typically larger than 15 during muscle activities, and are significantly larger than other periods.
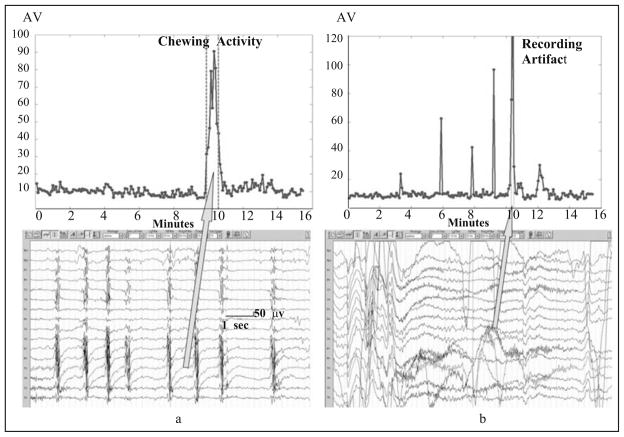
Amplitude variation (AV) is simply the standard deviation of the EEG amplitudes within a detection window. In the absence of seizure (ictal) patterns, high AV can indicate the patient is eating (chewing artifact, an example shown in Fig. 8a) or a recording artifact (Fig. 8b) is present. Following the onset of seizure (ictal) patterns, high AV can indicate the patient has progressed to a more generalized (i.e., tonic-clonic) event with a large amount of muscle activity. Besides, a minimal AV threshold is also used as a necessary condition for detecting a seizure activity. As with LFmax, AV was calculated for each of the 16 EEG channels used in the detection algorithm.
Fig. 8.
(a) An example of AV curve before, during, and after a chewing activity (between the two vertical dotted lines). AV values during a chewing activity are significantly larger than other periods. (b) An example of AV curve before, during, and after a recording artifact (between the two vertical dotted lines). AV values during a recording artifact are significantly larger than other periods.
Local minimal and maximal amplitude variation (LAVmin and LAVmax) calculate minimum and maximum local non-overlapping one-second amplitude variation (standard deviation) within a detection window, respectively. They are used to capture small local changes in signal amplitudes (e.g., eye movement or brief muscle activities) that could be missed in overall amplitude variation. LAVmax and LAVmin were calculated for each of the 16 EEG channels used in the detection algorithm.
Maximal amplitude in a higher frequency band (AHFmax) observes the maximal amplitude of the [25~70] band-passed filtered EEG signal within each detection window. AHFmax was used to detect the existence of any muscle activities, which is a necessary condition for an ictal EEG segment in most of the ictal EEG patterns. AHFmax was only calculated for 8 of the 16 EEG channels used in the detection algorithm: O1, O2, F7, F8, T3, T4, T5, and T6.
2.3. Seizure Detection Algorithm Design
2.3.1. Overview
The detection algorithm analyzes previously recorded scalp EEG records sequentially for each non-overlapping 5.12 second EEG segment and reports a seizure detection when sufficient criteria are met. The choice of the window length was empirical, based on the consideration of accuracy of the EEG descriptor estimates as well as of the stationarity of the signal within the window. EEG signals are band-pass filtered before the EEG descriptor calculations. Once all of the necessary EEG descriptors are calculated, the algorithm analyzes their spatiotemporal dynamics to determine if an EEG segment passes a set of artifact rejection criteria (ARC) designed to reduce false detections, as mentioned previously. When passed, the EEG segment is further examined to determine if its signal characteristics match with the criteria designed for detection of unilateral onset (left- or right-sided) or bilateral onset seizure activity. The criteria consist of comparisons of the aforementioned mathematical descriptors against a series of thresholds, using different channel combinations. If all signal characteristics pass the criteria, then an event detection is reported automatically by storing the detection time. EEG-trained users can easily review the stored times and associated EEG segments to confirm or deny the presence of true seizure activity.
2.3.2. Detailed Algorithm Description
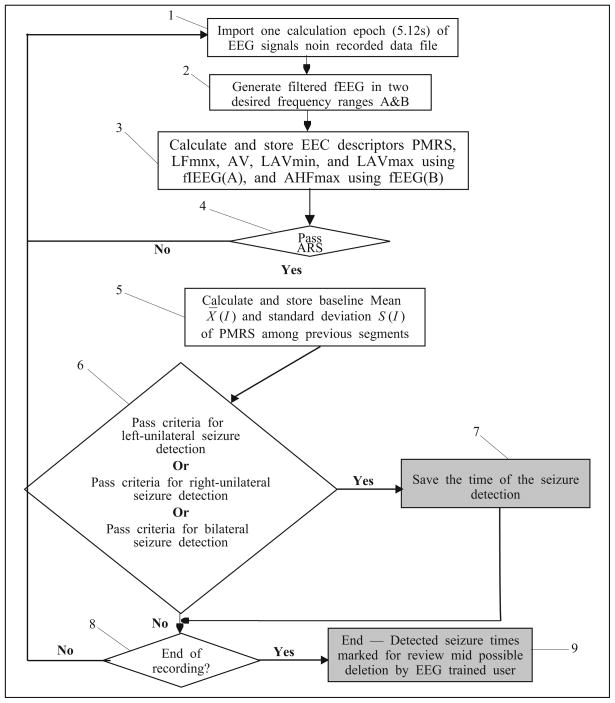
The flow chart depicted in Fig. 9 illustrates the algorithm for seizure detection. This section details each of the 9 steps in the process.
Fig. 9.
A flow chart of the seizure detection system.
-
Step 1
The algorithm imports one 5.12 epoch of 16 referential EEG channels, as depicted in block 1.
-
Step 2
Imported EEG signals are band-pass filtered, as illustrated in block 2, with two frequency band: A=[1, 20] and B=[25, 70]. The A-filtered signals are used to calculate PMRS, LFmax, AV, LAVmin, and LAVmax, while the B-filtered signals are used only to observe the descriptor AHFmax.
-
Step 3
After generating filtered EEG signals for each EEG channel signal, the algorithm calculates all necessary EEG descriptors, as illustrated in block 3.
-
Step 4
Based on EEG descriptors calculated in step 3, a set of artifact rejection criteria (ARC) is applied as shown in block 4 to reject unwanted EEG segments that contain:
Any recording artifact that causes “over-synchrony” among EEG channels. This type of artifact is detected (and rejected) if the algorithm observes the percentage of channel pairs that exhibit similar PMRS or AV values (i.e., difference < ε) is high (e.g., > 50%).
Any sleep EEG pattern that causes low amplitude and high regularity in many EEG channels. This type of artifact is detected (and rejected) if the algorithm observes at least 7 channels exhibit low PMRS values and low LAVmin.
Any activity that causes EEG signals containing almost no muscle activity, which is not normal during a typical ictal activity. This type of artifact is detected (and rejected) if the algorithm observes low AHFmax values in many EEG channels over temporal and occipital regions (i.e., O1, O2, F7, F8, T3, T4, T5, and T6).
Any sleep EEG activity that causes significant difference of signal regularity between the occipital/posterior-temporal (O1, O2, T5, and T6) and temporal/frontal-temporal (T3, T4, F7, and F8) brain regions. This type of artifact is detected (and rejected) if the algorithm observes the difference of the mean PMRS values between the two groups is large.
-
Step 5
Once an EEG epoch passes the ARC, the algorithm calculates the sample mean and standard deviation of the PMRS values over the preceding 60 epochs (~5 minutes interval), shown in block 5, to establish a baseline threshold for the detection of a significant drop of a PMRS value. This is based on the observation that PMRS values for certain EEG channels decrease significantly at the seizure onset (as shown in Fig. 6). To reduce the effects from signal artifacts to the baseline values, the PMRS values are automatically adjusted to a preset “interictal” value (= 0.6) if the corresponding LFmax or AV values exceed preset thresholds.
-
Step 6
After determining the PMRS detection threshold, the algorithm compares the current EEG descriptors with three sets of criteria for detecting a seizure event, as illustrated by block 6. These three sets of criteria were designed based on the EEG signal characteristics of (i) left-unilateral EEG seizure onset, (ii) right-unilateral EEG seizure onset, and (iii) bilateral EEG seizure onset.
-
Step 7
After a seizure is detected, as illustrated by block 7, the system will save the detection time. This allows the software to call the user’s attention to that segment for possible seizure activity.
-
Step 8
After the detection process is finished for the current epoch, the system checks if the end of the recording was reached, as depicted by block 8.
-
Step 9
If the end of the recording was reached, the algorithm will stop processing, as illustrated by block 9. The algorithm then allows the user to review the entire EEG record, calling attention to the seizure detection times stored in step 7, for possible seizure activities. If the end of the record was not reached, the algorithm goes back to step 1 and reads and analyzes the next 5.12-second EEG epoch.
2.4. Performance Assessment and Statistical Analysis
2.4.1. Determining True and False Detections
A detection reported by the algorithm is considered a true detection when the time of the detection was within two minutes of the seizure onset (determined by the EEG reviewers), and is considered a false detection when the detection time was outside the two minute interval of any electrographic event identified by the review panel. The two-minute detection window was chosen based on a general observation that most seizures have ictal period between 30 seconds and 2 minutes. Furthermore, as discussed previously, the purpose of the detection algorithm described and tested in this study is to identify electrographic seizure events in pre-recorded scalp EEGs. Therefore, we consider a two-minute detection window appropriate for the performance evaluation in this study.
2.4.2. Estimating Performance Statistics. Detection Sensitivity and False Detection Rate
Detection Sensitivity
Because each subject had a small number of seizures (≤ 5, as determined by the EEG review panel or down-sampled as needed), it would not be meaningful to calculate individual detection sensitivity. Therefore, we calculated an overall detection sensitivity using the total number of true detections divided by the total number of electrographic seizures (146 seizures in 55 test subjects). This gives a better estimation of the true sensitivity of a test algorithm. The 95% confidence interval of the sensitivity estimation was constructed using the bias-corrected and accelerated (BCa) bootstrap confidence interval [18]. The bootstrap analysis was performed using the statistical software Splus/R.
False Detection Rate
Because this study included sufficient lengths of EEG recordings (range 14.25 ~ 30.521 hours; mean = 21.97 hours) with different physiologic states in each test subject, the false detection rate, calculated as the number of false detections divided by the total number of EEG hours, for each test subject was calculated, and the mean false detection rate (over all test subjects) was estimated. Similarly, the 95% confidence interval of the mean false detection rate was calculated as the BCa bootstrap confidence interval by re-sampling the test subjects.
3. RESULTS
3.1. Training Performance
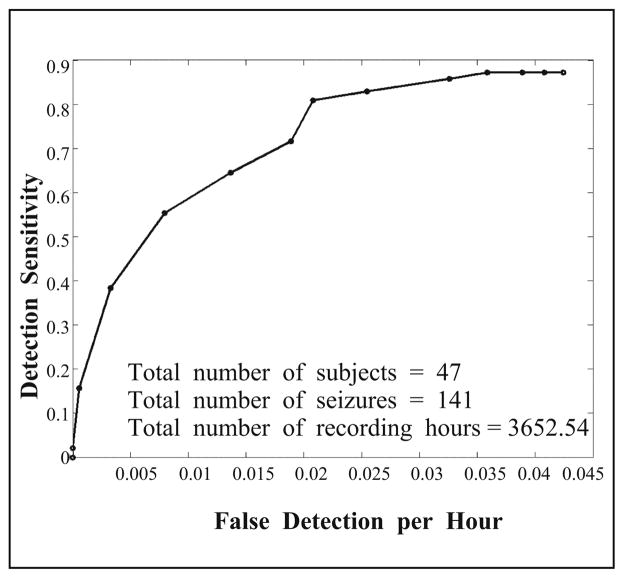
As described previously, the test detection algorithm was developed and trained in a training dataset consisting of 47 long-tern scalp EEG recordings with a total of more than 3,600 recording hours. This rich dataset allowed us to optimize the parameters and detection criteria used in the algorithm. The seizure events were determined by the epileptologists at the clinical sites. Figure 10 shows the detection performance curve in this training dataset that depicts the relationship between the detection sensitivity and false detection rate. The probability threshold for determining the PMRS similarity (first criterion in ARC) was used as the varying parameter on the performance curve. According to this curve, it was determined that the parameter value that gives the algorithm 83% detection sensitivity with a false detection rate of 0.026/hour would be used in the performance validation study.
Fig. 10.
Detection performance curve in the training dataset.
3.2. Assessment of Detection Performance in Test Dataset
To avoid any potential bias from the algorithm development, assessment of the detection performance was conducted in a separate test dataset consisting of 436 EEG segments from 55 subjects with a total of 1208 recording hours. All EEG segments were reviewed by three blinded, independent epileptologists to determine seizure events. As a result, a total of 146 electrographic seizures were included in the validation study. All detection criteria and their thresholds were fixed for all test datasets.
3.2.1. Detection Sensitivity
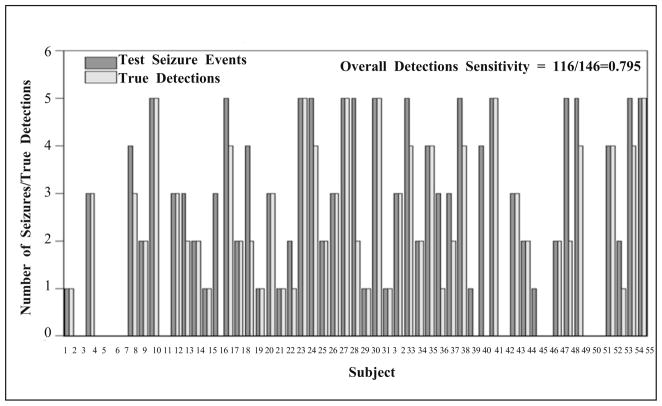
The number of true detections for each test subject from the test algorithm is shown in Fig. 11 (no seizures were identified by the Review Panel in 9 subjects). Using the optimal parameter settings determined from the training dataset, in test dataset, overall detection sensitivity was nearly 80% (79.45%) with its 95% BCa bootstrap confidence interval (number of bootstrap re-sampling = 3,000) = [70%, 87%].
Fig. 11.
The number of test events and the corresponding test algorithm’s true detections for all test subjects. No seizures were identified by the EEG reviewers in nine subjects.
3.2.2. False Detection Rate
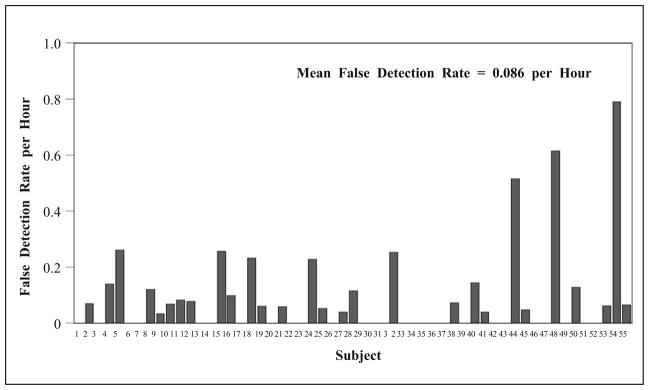
The false detection rate (per hour) for each test subject is shown in Fig. 12. In this test dataset, the test algorithm generated false detections at a mean rate of 0.086 per hour, with its bootstrap standard error equal to 0.02. The 95% BCa bootstrap confidence interval (number of bootstrap re-sampling = 3,000) of the false detection rate = [0.05, 0.14].
Fig. 12.
False detection rate (per hour) by the test algorithm.
3.2.3. Performance Comparison between the Test Algorithm and Reveal Algorithm
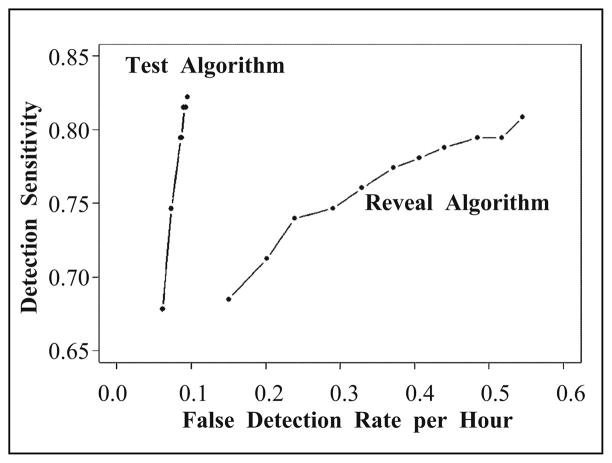
The same test dataset was processed by Reveal using its default setting for scalp EEG (perception score = 0.5) and achieved an overall observed sensitivity of nearly 81% (80.8%) with its 95% confidence interval [72%, 88%]. Using less sensitive settings (generating fewer false detections) with a perception score = 0.8 and 0.9, the observed sensitivity achieved 76% (95% CI = [67%, 85%]) and 74% (95% CI = [64%, 84%]), respectively. Statistical comparison (by bootstrap distribution) of the detection sensitivity between the test algorithm and Reveal suggests that they are not significantly different. With respect to the false detection rate, with 0.5 perception score setting, Reveal generated false detections at a mean rate of 0.55 per hour, with the 95% BCa bootstrap confidence interval = [0.42, 0.71]. With a perception score = 0.8 and 0.9, Reveal performed a mean false detection rate of 0.33 (95% CI = [0.24, 0.44]) and 0.24 (se = 0.93 with 95% CI = [0.17, 0.33]) per hour, respectively. Statistical comparison (by bootstrap distribution) of the false detection rates suggests that the test algorithm performed with a significantly lower false detection rate than Reveal (p < 005. for all three perception score settings).
Figure 13 shows overall detection performance (receiver operating characteristic, ROC, curves) for both test and Reveal algorithm by changing the detection thresholds. It is clear that the false detection rate of the test detection algorithm is significantly smaller than that of Reveal algorithm at different level of detection sensitivities. Furthermore, the difference becomes more and more significant when the detection sensitivity increases.
Fig. 13.
Detection receiver operating characteristic, ROC, curves for the test algorithm and Reveal algorithm.
4. CONCLUSIONS
Multi-channel scalp EEGs are highly complex and nonstationary signals, both in time and in space. This is due to the fact that EEG not only reflects patients’ brain activities during different states, but also contains noise and artifacts from various sources. By applying advanced mathematical tools and novel spatiotemporal pattern recognition techniques, the aim of the present study was to develop a highly reliable and clinically useful computer algorithm for offline seizure detection and identification in multi-day long-term scalp EEG recordings. This algorithm processes EEG recordings at a speed of approximately 50 times of real time on the standard dual-core desktop computer. In other words, it will take less than 30 minutes to process and report detections for a 24-h scalp EEG recording. Computer software based on such an algorithm would greatly enhance the efficiency of long-term EEG monitoring in Epilepsy Monitoring Units (EMU) and Intensive Care Units (ICU).
The seizure detection algorithm introduced in this report extracts various signal characteristics from scalp EEG recordings and translates them into multiple EEG descriptors sequentially in time across the brain recording sites (EEG channels). The process decodes the original EEG recording into a 3-dimensional database. Based on this database, the algorithm was trained to identify EEG epochs that contained ictal EEG patterns. To reduce false detections, the algorithm was also taught to reject EEG epochs that were dominated by common recording artifacts, including muscle and chewing artifacts, or normal sleep EEG patterns. The validation study was conducted in a separate test dataset in which each of the EEG segments was independently reviewed by three blinded epileptologists. The overall results showed that the test detection algorithm was able to detect 80% of the electrographic seizure activities agreed upon by the majority of epileptologists with a mean false detection rate of just 2 per day (0.086 per hour). In fact, more than half of the test subjects had a false detection rate of less than 1 per day. Assessed under the same test dataset, Reveal, one of the most used clinical seizure detection software products available, generated 13 false detections per day when its detection parameter was adjusted to have similar detection sensitivity to the test algorithm.
The results of this study suggest that it is possible to identify different signal patterns contained in complex scalp EEG recordings by mathematically decoding multi-channel signals into quantitative descriptors that represent signal characteristics such as regularity, amplitude, and frequency. These patterns include external artifacts and brain electrical activities from sleep, muscle, movement, and most importantly, epileptic seizures. With further configuration and training, such a system may also offer clinically useful information about other brain disorders that can be diagnosed by scalp EEG monitoring.
Footnotes
This work was supported by the grants 5R01NS050582 (JCS) and 1R43NS064647 (DSS) from NIH-NINDS.
Contributor Information
J. J. Halford, Email: halfordj@musc.edu.
K. M. Kelly, Email: kelly@wpahs.org.
Jui-Hong Chien, Email: cjh425@gmail.com.
P. M. Pardalos, Email: pardalos@ufl.edu.
M. C. K. Yang, Email: yang@stat.ufl.edu.
References
- 1.Agency for Healthcare Research and Quality. 2002 doi: 10.1080/15360280802537332. [DOI] [PubMed] [Google Scholar]
- 2.Kerling F, Mueller S, Pauli E, Stefan H. When do patients forget their seizures? An electroclinical study. Epilepsy Behavior. 2006;9(2):281–285. doi: 10.1016/j.yebeh.2006.05.010. [DOI] [PubMed] [Google Scholar]
- 3.Gotman J. Automatic recognition of epileptic seizures in the EEG. Electroencephalogr Clin Neurophysiol. 1982;54:530–540. doi: 10.1016/0013-4694(82)90038-4. [DOI] [PubMed] [Google Scholar]
- 4.Gotman J. Automatic seizure detection: Improvements and evaluation. Electroencephalogr Clin Neurophysiol. 1990;76:317–324. doi: 10.1016/0013-4694(90)90032-f. [DOI] [PubMed] [Google Scholar]
- 5.Gabor AJ, Leach RR, Dowla FU. Automatic seizure detection using a selforganizing neural network. Electroencephalogr Clin Neurophysiol. 1996;99:257–266. doi: 10.1016/0013-4694(96)96001-0. [DOI] [PubMed] [Google Scholar]
- 6.Wilson SB, Scheuer ML, Emerson RG, Gabor AJ. Seizure detection: Evaluation of the reveal algorithm. Clinical Neurophysiology. 2004;115(10):2280–2291. doi: 10.1016/j.clinph.2004.05.018. [DOI] [PubMed] [Google Scholar]
- 7.Wilson SB. A neural network method for automatic and incremental learning applied to patient-dependent seizure detection. Clinical Neurophysiology. 2005;116(8):1785–1795. doi: 10.1016/j.clinph.2005.04.025. [DOI] [PubMed] [Google Scholar]
- 8.Saab ME, Gotman J. A system to detect the onset of epileptic seizures in scalp EEG. Clinical Neurophysiology. 2005;116(Issue 2):427–442. doi: 10.1016/j.clinph.2004.08.004. [DOI] [PubMed] [Google Scholar]
- 9.Hopfengartner R, Kerling F, Bauer V, Stefan H. An efficient, robust and fast method for the offline detection of epileptic seizures in long-term scalp EEG recordings. Clinical Neurophysiology. 2007;118(Issue 11):2332–2343. doi: 10.1016/j.clinph.2007.07.017. [DOI] [PubMed] [Google Scholar]
- 10.Meier R, Dittrich H, Schulze-Bonhage A, Aertsen A. Detecting epileptic seizures in long-term human EEG: A new approach to automatic online and real-time detection and classification of polymorphic seizure patterns. J of Clinical Neurophysiology. 2008;25(3):119–131. doi: 10.1097/WNP.0b013e3181775993. [DOI] [PubMed] [Google Scholar]
- 11.Harding GW. An automated seizure monitoring system for patients with indwelling recording electrodes. Electroencephalogr Clin Neurophysiol. 1993;86:428–437. doi: 10.1016/0013-4694(93)90138-l. [DOI] [PubMed] [Google Scholar]
- 12.Osorio I, Frei MG, Giftakis J, et al. Performance reassessment of a real-time seizure detection on long ECoG series. Epilepsia. 2002;43:1522–1535. doi: 10.1046/j.1528-1157.2002.11102.x. [DOI] [PubMed] [Google Scholar]
- 13.Khan YU, Gotman J. Wavelet-based automatic seizure detection in intracerebral electroencephalogram. Clinical Neurophysiology. 2003;114(5):898–908. doi: 10.1016/s1388-2457(03)00035-x. [DOI] [PubMed] [Google Scholar]
- 14.Gardner AB, Krieger AM, Vachtsevanos G, Litt B. One-class novelty detection for seizure analysis from intracranial EEG. J Mach Learn Res. 2006;7:1025–1044. [Google Scholar]
- 15.Peters TE, Bhavaraju NC, Frei MG, Osorio I. Network system for automated seizure detection and contingent delivery of therapy. J of Clinical Neurophysiology. 2001;18(6):545–549. doi: 10.1097/00004691-200111000-00004. [DOI] [PubMed] [Google Scholar]
- 16.Tsakalis K, Chakravarthy N, Sabesan S, Iasemidis LD, Pardalos PM. A feedback control systems view of epileptic seizures. Cybern Syst Analysis. 2006;42(4):483–495. [Google Scholar]
- 17.Founta KN, Smith JR. A novel closed-loop stimulation system in the control of focal, medically refractory epilepsy. Acta Neurochirurgica Supplements. 2007;97(2):357–362. doi: 10.1007/978-3-211-33081-4_41. [DOI] [PubMed] [Google Scholar]
- 18.Guideline 1: Minimum technical requirements for performing clinical electroencephalography. J of Clinical Neurophysiology. 2006;23(2):86–91. doi: 10.1097/00004691-200604000-00002. [DOI] [PubMed] [Google Scholar]
- 19.Ebersole JS, Pacia SV. Localization of temporal lobe foci by ictal EEG patterns. Epilepsia. 1996;37(4):386–399. doi: 10.1111/j.1528-1157.1996.tb00577.x. [DOI] [PubMed] [Google Scholar]
- 20.Pincus SM. Approximate entropy as a measure of system complexity. Proc of National Academy of Science of the USA. 1991;88:2297–2301. doi: 10.1073/pnas.88.6.2297. [DOI] [PMC free article] [PubMed] [Google Scholar]
- 21.Efron B, Tibshirani RJ. An Introduction to the Bootstrap. Chapman & Hall/CRC; Boca Raton, FL: 1994. [Google Scholar]


