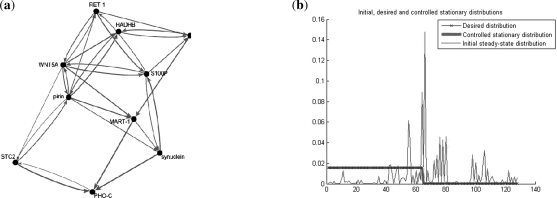
Fig. 1.
Optimal intervention in the human melanoma gene regulatory network. (a) An abstract diagram of the melanoma gene regulatory network (Kim et al., 2002). Thicker lines or closer genes are used to convey a stronger relationship between the genes. The notion of stronger relation between genes is used convey a higher probability of influence on their gene expression levels. For instance, WNT5A and pirin have a strong relationship to each other as illustrated by their proximity in the diagram and the thickness of the lines connecting between them; (b) The original (red line), desired (blue line) and minimal-perturbation energy controlled (green line) steady-state distributions of the human melanoma gene regulatory network. The x-axis represents the 128 states of the network ranging from 00…0 to 11 … 1, and the y-axis indicates the probability of each state. Note that the controlled and desired steady-state distributions are identical.

