

Abstract
Motivation: An important question that has emerged from the recent success of genome-wide association studies (GWAS) is how to detect genetic signals beyond single markers/genes in order to explore their combined effects on mediating complex diseases and traits. Integrative testing of GWAS association data with that from prior-knowledge databases and proteome studies has recently gained attention. These methodologies may hold promise for comprehensively examining the interactions between genes underlying the pathogenesis of complex diseases.
Methods: Here, we present a dense module searching (DMS) method to identify candidate subnetworks or genes for complex diseases by integrating the association signal from GWAS datasets into the human protein–protein interaction (PPI) network. The DMS method extensively searches for subnetworks enriched with low P-value genes in GWAS datasets. Compared with pathway-based approaches, this method introduces flexibility in defining a gene set and can effectively utilize local PPI information.
Results: We implemented the DMS method in an R package, which can also evaluate and graphically represent the results. We demonstrated DMS in two GWAS datasets for complex diseases, i.e. breast cancer and pancreatic cancer. For each disease, the DMS method successfully identified a set of significant modules and candidate genes, including some well-studied genes not detected in the single-marker analysis of GWA studies. Functional enrichment analysis and comparison with previously published methods showed that the genes we identified by DMS have higher association signal.
Availability: dmGWAS package and documents are available at http://bioinfo.mc.vanderbilt.edu/dmGWAS.html.
Contact: zhongming.zhao@vanderbilt.edu
Supplementary Information: Supplementary data are available at Bioinformatics online.
1 INTRODUCTION
Genome-wide association studies (GWAS) have revealed hundreds of common variants conferring susceptibility to common diseases. According to the National Human Genome Research Institute (NHGRI) Catalog of Published Genome-Wide Association Studies (Hindorff et al., 2009), there have been 2898 SNPs reported in 596 publications (as of July 1, 2010, http://www.genome.gov/gwastudies/). Although the discovered single nucleotide polymorphisms (SNPs) greatly expanded our knowledge of the molecular mechanisms of common diseases, only limited heritability has been explained, and it still remains unclear how these markers/genes interact and confer a predisposition to disease. Depending on the underlying genetic structure of diseases, it is possible that many markers/genes, having low or moderate risk in and of themselves, interact to confer a significant combined effect. So far, GWAS data analysis has largely focused on single marker discovery. However, at the stringent genome-wide significance level of P < 5 × 10⁻⁸, many markers that are truly but weakly associated with disease often fail to be detected. Novel statistical or computational methods to detect the combined effect of a set of genes may provide useful alternative approaches in GWAS.
Recently, integrative analysis of GWAS data with other high-throughput datasets has been shown to be effective in the examination of multiple variants' combined effect. One example is the application of gene-set-based methods to systematically examine gene sets, typically in the form of biological pathways or functional groups, using GWAS datasets. Representative examples include gene set enrichment analysis (GSEA) adapted from the original microarray expression data analysis (Wang et al., 2007), the SNP ratio test (O'Dushlaine et al., 2009) and the hypergeometric test. These methods search for significantly enriched gene sets collected from predefined canonical pathways or functional annotations such as Gene Ontology (GO) terms. However, by sorting genes into classical pathways or functional categories, the results of these methods might be over-limited to a priori knowledge (e.g. predefined gene sets) and, thus, make it difficult to identify a meaningful combination of genes (Ruano et al., 2010). Realizing this problem, Ruano et al. (2010) suggested that investigators group genes by cellular functions instead of classical pathways, assuming that genetic variation might converge on components acting across pathways. However, this strategy requires strong disease-specific background knowledge, and still uses predefined gene sets. Another limitation is the incomplete annotation of pathways or GO annotations in the current knowledgebase.
The protein–protein interaction (PPI) network-based approach may largely overcome these limitations because it allows flexibility in setting the components of a gene set. This approach has recently been applied to GWAS data for multiple sclerosis to search for overrepresented modules (Baranzini et al., 2009). So far, there has been no user-friendly tool to integrate a GWAS dataset with a PPI network and search for enriched subnetworks.
In this study, we introduced a network-based searching method by integrating GWAS and PPI information. We first mapped all SNP markers in a GWAS dataset to genes and then weighed genes by the P-values of their mapped markers. Then, weighted genes were loaded onto a comprehensive human PPI network to construct a node-weighted PPI network. We modified a previous method (Chuang et al., 2007) that was designed for dense module searching (DMS) in gene expression datasets, and used it to search for subnetworks that locally maximize the proportion of low-P-value genes in the GWAS dataset. This method has the advantage of searching the whole interactome and examining the combined effect of multiple genes in an exhaustive manner. We further implemented the method into a computational tool for public use.
2 METHODS
2.1 Data source
We used two datasets to demonstrate our method: breast cancer GWAS (Hunter et al., 2007) and pancreatic cancer GWAS (Amundadottir et al., 2009). Both are from the National Cancer Institute Cancer Genetics Markers of Susceptibility (CGEMS, http://cgems.cancer.gov/) study and were obtained through an approved data request application. Both GWA scan datasets were genotyped using an Illumina HumanHap 550 array. For breast cancer, individual genotyping data for 1145 breast cancer cases and 1142 controls, nested within the prospective Nurses' Health Study cohort, were downloaded from dbGaP (http://www.ncbi.nlm.nih.gov/gap). These women were included in Stage I of the CGEMS breast cancer study. We excluded samples with missing genotype rates > 0.05, or SNPs with minor allele frequency (MAF) < 0.05 or genotyping success rate < 95% for our analysis. After quality control, a total of ∼ 522000 SNPs were included in the subsequent data analysis.
We used the trend test to calculate P-values of all markers in the GWAS dataset. We mapped a SNP to a gene if it was located within the gene or 20 kb immediately upstream or downstream. The most significant SNP of each gene, i.e. the SNP with the smallest χ2 trend statistic P-value, was chosen to represent the association of the gene in the follow-up analysis. The breast cancer GWAS data represented 19 542 genes.
For pancreatic cancer, we performed the same quality control and SNP mapping. A total of 1924 cases and 2042 controls were finally included in our analysis, involving ∼ 510 000 SNPs covering 19 574 genes in this dataset.
We used a comprehensive human PPI network downloaded from the Protein Interaction Network Analysis platform (PINA; Wu et al., 2009), which collected and annotated data from six public PPI databases (MINT, IntAct, DIP, BioGRID, HPRD and MIPS/MPact). Approximately 12 000 nodes and 64 000 interactions were included in this network (as of March 4, 2010).
2.2 DMS method
2.2.1 Scoring subgraphs
Our ‘module’ is defined as a subgraph within the whole network with a locally maximum proportion of low-P-value genes. To quantitatively evaluate the density of low-P-value genes held by a module, we computed a score Zm by
| (1) |
where k is the number of genes in the module and zi is transferred from P according to zi = Φ −1(1 − Pi). Here, Φ−1 denotes the inverse normal distribution function. In this way, a smaller P-value corresponds to a larger zi. Thus, a module with a higher proportion of markers with small P-values will have a higher combined score Zm (Ideker et al., 2002).
2.2.2 Normalization of Zm
Zm was normalized by using a random set of genes to determine whether it was higher than expected. Specifically, for a module m with k genes, we randomly chose the same number of genes from the whole network, computed Zm accordingly and denoted it by Zm(π). Then, we repeated this process for 100 000 times to achieve sufficient randomization. The resultant Zm(π) formed an estimated background distribution of Zm for module m with size k. Zm was then normalized by
| (2) |
ZN is independent of size k and, thus, modules with different sizes are comparable by their ZN.
2.2.3 Permutation-based normalization of Zm
To further evaluate whether a module was significantly associated with the disease, we performed permutation (N = 1000) of the original GWAS data by swapping the disease labels while ensuring the same number of cases and controls as in the real case using PLINK (Purcell et al., 2007). During each permutation, we repeated the calculation of Zm and denoted it as Zm(p). A nominal P was then computed for each module by counting the number of permutations that have Zm(p) greater than the real case, divided by the total number of permutations, i.e.,
| (3) |
Note that normalization by Equation (2) and permutation by Equation (3) test different features of the module. In normalization, the null hypothesis is that there is no difference between the investigated module and modules randomly selected from the whole network. In permutation testing, the null hypothesis is that there is no association between the module and the disease in investigation. Both are important; however, ZN is used to rank modules because (i) it measures how different a module is from random cases in the real dataset, while nominal P is used to filter out false-positive modules that are not associated with the disease based on permutation data; (ii) ZN has been corrected for module size; and (iii) practically, many modules were observed to have nominal P-values equal to 0 using Equation (3), thus it is not possible to rank modules by their nominal P-values.
2.2.4 Searching strategy
The following steps perform greedy searching iteratively using each gene in the network as a seed.
A seed module is assigned. In the beginning, the seed module contains only the seed gene. Zm is computed for the current seed module.
Identify neighborhood interactors, which are defined as nodes whose shortest path to any node in the module is shorter or equal to a predefined distance constraint d (e.g. d = 2).
Examine the neighborhood interactors defined in Step (2) and find the genes generating the maximum increment of Zm. Nodes will be added if the increment is greater than Zm × r, where r is the rate of proportion increment. That is, the expanded module has a score Zm+1 greater than Zm × (1 + r) (details are provided in Supplementary Materials and online user's guide).
Repeat Steps 1–3 until adding any neighborhood nodes cannot yield an increment that is greater than Zm × r.
The parameters d and r in the above procedure are the two important factors to be decided in implementation. The parameter d was suggested to set at 2 in a previous work (Chuang et al., 2007), based on the fact that the median distance between any two proteins in the human PPI network is less than 5. Nevertheless, we assessed both d = 1 and d = 2 in this study. The parameter r has a substantial effect on the results. When r is small, it imposes a loose restriction during the module expanding process; thus, unrelated nodes with lower zi scores (higher P-values) might be included. On the other hand, when r is large, a strict restriction is imposed and only those nodes with very high zi scores (very low P-values) could be included. As a result, it may not include informative nodes having moderate association P-values. In our work, we primarily used r = 0.1 and also evaluated other values for r.
2.3 Pathway enrichment of DMS genes
We used the ingenuity pathway analysis (IPA) system (http://www.ingenuity.com) to perform pathway enrichment tests of the genes from our DMS modules. Fisher's exact test was implemented in IPA to compute a P-value for each pathway. For GSEA method, we used the R source code downloaded from MSigDB (http://www.broadinstitute.org/gsea/msigdb/index.jsp) and adapted it for the analysis of GWAS datasets.
3 IMPLEMENTATION
We implemented the DMS method in an R package, dmGWAS, which is freely available from the web site (http://bioinfo.mc.vanderbilt.edu/dmGWAS.html). Figure 1 shows the workflow of the searching process. dmGWAS can directly take GWAS association results as input and identify dense modules in a PPI network that are significantly convergent with GWAS association signals. Several comprehensive methods are implemented in dmGWAS. The DMS is efficient. Its execution took ∼2 h on a server (3.00 GHz Quad Core Intel® Xeon® Processor X5450 and 16.0 GB of RAM, one thread) for a typical GWAS dataset, in addition to the running time of PLINK, which may take hours to generate permutation data depending on datasets and number of permutations. We briefly introduce the key steps here. Detailed documentation along with annotation data can be found at the above web site.
Fig. 1.
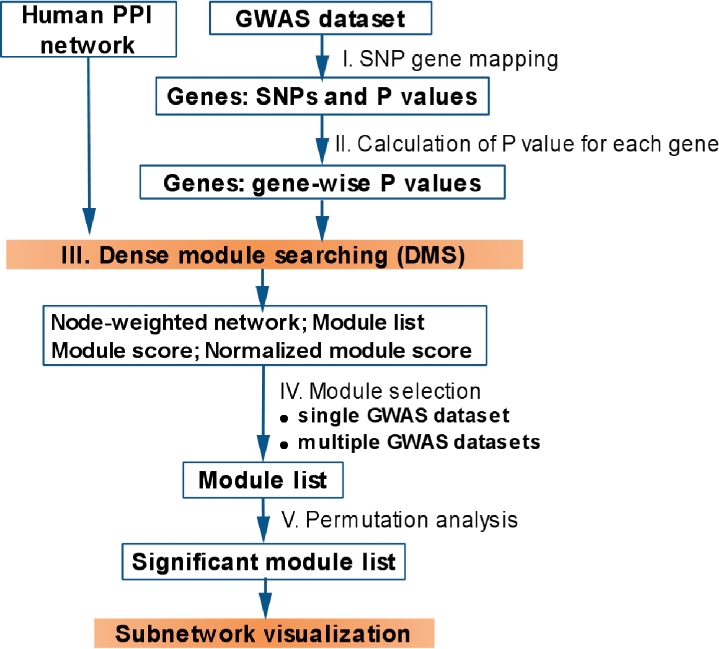
dmGWAS workflow.
3.1 GWAS data preprocessing
dmGWAS first maps the SNPs genotyped in a GWA study to genes by the following command:
> gene.map = SNP2Gene.match(assoc.file, snp2gene.file, id.type = “affy”, dist = 20)
where assoc.file is the GWAS data generated from PLINK (Purcell et al., 2007) and snp2gene.file is the annotation file, which can be downloaded from our dmGWAS web site or prepared by the user. Gene boundaries are extended by dist, e.g. 20 kb.
To compute a gene-based P-value (i.e. gene-wise P-value), dmGWAS provides several options, including using the most significant SNP, by Simes' method (Chen et al., 2006), by Fisher's method, or using the smallest gene-wise false discovery rate (FDR) value (Peng et al., 2010). One example command is:
> gene.weight = PCombine(gene.map, method = “smallest”).
3.2 DMS
A single function, dms, performs DMS, removes unqualified modules, generates random networks and normalizes module scores to assess the random effect. For example,
> res.list = dms(network, gene.weight).
The returned object, res.list, contains all related data for a user's records, such as the node-weighted network used for searching, the resultant dense modules, the module score matrix containing Zm and ZN and randomization data. Of note, we implemented further quality control in the dms function, which includes (i) removing modules whose size are less than five genes and (ii) keeping only one module when multiple modules share the same component genes though generated by different seed genes.
3.3 Module selection, permutation and visualization
Because of the nature of the DMS algorithm, thousands of modules might be generated with extensive overlap between closely ranked modules. We suggest the user to select the top modules ranked by ZN, and then evaluate their association with the disease of interest using the permutation data from the GWAS (see online documents). For example,
> simpleChoose(res.list, top = 100, plot = T)
> zn.permutation(module.list, gene2snp, gene2snp.method = “smallest”, assoc.file, permutation.dir)
where permutation.dir contains the permutation files generated by PLINK. Modules whose nominal P-values are both significantly enriched in the whole network and significantly associated with the disease may be used for further analysis and interpretation. Selected modules can be presented graphically:
> moduleChoose(seed.list, res.list, plot = T)
where seed.list is the seed genes of significant modules.
4 APPLICATIONS
In this section, we applied the DMS method to two cancer GWAS datasets (breast and pancreatic cancers). Based on these two specific cases, we also evaluated two key parameters in the DMS method. Finally, we compared the DMS method with the popularly used GSEA method.
4.1 Breast cancer GWAS analysis
We applied the DMS method to the CGEMS breast cancer dataset (Hunter et al., 2007) using d = 2 and r = 0.1. A total of 9212 single modules were generated. On average, the module size was 11.65 ± 1.79 (mean ± SD). The normalized module score, ZN, was within a range from 2.95 to 7.17. As described in Section 2, for each module, its normalized score ZN indicated the extent of departure from randomness, and was used to rank modules. These 9212 modules served as the candidate pool for further selection. To select a set of most significant candidate modules straightforwardly, one may transform ZN back to P-values (PZN = 1 − Φ(ZN)), as ZN has normal distribution. However, PZN of breast cancer modules was observed in a range from 1.61 × 10⁻³ to 3.63 × 10⁻¹³, thus, it would generate too many modules with PZN as the criterion. Besides, this algorithm introduces extensive overlap among the closely ranked modules, making it inappropriate to perform multiple testing correction directly. Even so, there were > 8000 modules having P < 0.05 after Bonferroni correction, leaving too many to select from.
We thus proposed to select the top ranked modules whose scores are within the top 1% in module score distribution for the follow-up analysis. Although this criterion is arbitrary, we consider it appropriate to include modules that have high association scores, while not introducing too many unrelated modules. Applying this rule resulted in 93 modules, which were further evaluated using the permutation data. All of them remained significant after permutation testing and had nominal P < 0.001, indicating that they were not only significantly enriched but also significantly associated with breast cancer. Therefore, these 93 modules were considered as candidate modules, and contained 166 non-redundant genes. The detailed gene information is provided in Supplementary Table 1. These 166 genes were considered as candidate genes for breast cancer and used for our subsequent bioinformatics analysis.
Table 1.
Top 10 pathways by IPA
| Ingenuity canonical pathways | P-value* | Ratioa |
|---|---|---|
| Breast cancer | ||
| PTEN signaling | 7.94 × 10⁻¹² | 0.124 |
| EGF signaling | 1.58 × 10⁻¹¹ | 0.204 |
| FAK signaling | 7.94 × 10⁻¹¹ | 0.120 |
| Thrombin signaling | 1.20 × 10⁻¹⁰ | 0.078 |
| Neuregulin signaling | 1.32 × 10⁻¹⁰ | 0.117 |
| Integrin signaling | 1.55 × 10⁻¹⁰ | 0.079 |
| IL-2 signaling | 1.55 × 10⁻¹⁰ | 0.172 |
| Molecular mechanisms of cancer | 1.95 × 10⁻⁹ | 0.051 |
| PDGF signaling | 2.04 × 10⁻⁹ | 0.132 |
| Fcγ receptor-mediated phagocytosis in macrophages and monocytes | 2.95 × 10⁻⁹ | 0.109 |
| Pancreatic cancer | ||
| Myc-mediated apoptosis signaling | 1.70 × 10⁻⁷ | 0.127 |
| Neuregulin signaling | 2.82 × 10⁻⁷ | 0.087 |
| Fcγ receptor−mediated phagocytosis in macrophages and monocytes | 3.72 × 10⁻⁷ | 0.089 |
| Agrin interactions at neuromuscular junction | 4.07 × 10⁻⁷ | 0.116 |
| ERK/MAPK signaling | 1.62 × 10⁻⁶ | 0.057 |
| FAK signaling | 2.51 × 10⁻⁶ | 0.080 |
| PTEN signaling | 3.24 × 10⁻⁶ | 0.076 |
| HGF signaling | 6.17 × 10⁻⁶ | 0.078 |
| Molecular mechanisms of cancer | 7.24 × 10⁻⁶ | 0.038 |
| 14-3-3-mediated signaling | 1.55 × 10⁻⁵ | 0.070 |
aRatio is the number of molecules from the 166 breast cancer candidate genes that map to the pathway divided by the total number of molecules that map to the canonical pathway.
*P-values were calculated by Fisher's exact test, indicating probability of the association of the candidate genes with the canonical pathway from chance.
4.1.1 Breast cancer candidate genes and subnetwork
Among the 166 candidate genes, most had nominally significant P-values (e.g. 79.5% had P < 0.05). The most significant genes included FGFR2, MMRN1, POLR1A, PTCD3, BMPR1B and STXBP1 (P < 10−4). Of note, FGFR2 was the most significant gene reported in the original GWA study (Hunter et al., 2007) and was also included by our DMS method. Among the 166 candidate genes, 13 have been collected by the Cancer Gene Census category (CGC, http://www.sanger.ac.uk/genetics/CGP/Census/) as known cancer genes; they are: ATIC, BCL3, EGFR, EWSR1, FGFR2, GATA2, JAK1, KIT, PIK3R1, RAF1, RB1, SOCS1 and SYK (Futreal et al., 2004). These genes have been indicated by CGC as having mutations causally implicated in cancer. There were also other genes of interest such as BARD1 (De Brakeleer et al., 2010), SMAD3 (Ito et al., 2010), TP73 (Tomkova et al., 2008) and SOS1 (Sastry et al., 1997), which have been well studied in breast cancer.
Next, we specifically examined the module with the highest score (i.e. the top-ranked module). This module contained 12 genes, including: BARD1, FGFR2, GSK3B, HGS, PIK3R1, POLR1A, PRKCA, PRKCB, PTCD3, SF3B1, STXBP1 and TCERG1 (Fig. 2A). The nominal P-values of these genes were generally low (Supplementary Table 1), thus, this module was strongly enriched with the genetic signal of breast cancer. We further examined the 10 modules with the highest scores (top 10 modules), including 28 non-redundant genes (Supplementary Table 1) shown in Figure 2B. Finally, we merged all 93 modules to construct a breast cancer-specific subnetwork based on this CGEMS GWAS data (Fig. 2C). The combined subnetwork includes several genes with high degrees, including PIK3R1, EGFR, PRKCA, GSK3B, PTK2, INSR, EWSR1, PLCG1, JAK1, SYK, SMAD3, PRKCB and KIT, all of which with degree > 10.
Fig. 2.

PPI subnetwork for breast cancer using the CGEMS GWAS dataset. (A) The module having the best score. (B) PPI subnetwork constructed using the top 10 modules. (C) The subnetwork containing 166 candidate genes from the top 93 modules (top 1% of all modules generated). The darkness of a node is proportional to its P-value.
Of note, some genes in the merged network had a weak association signal. They were recruited by DMS because they interacted with a substantial portion of other network nodes with stronger association signals. For example, the gene-wise P-value of gene SMAD3 was not significant itself (P = 0.10), however, it interacted with several genes having moderate association P-values, such as TP73 (P = 1.6 × 10⁻³), POLR1A (P = 3.7 × 10⁻⁵), and BARD1 (P = 1.1 × 10⁻³). The same scenario was observed in several interesting genes such as PIK3R1, PLCG1 and EWSR1, which could not pass nominal significance but interacted with other moderately significant genes. These results indicate the power of DMS in leveraging the combined effect of a gene set instead of single gene(s).
4.1.2 Pathway enrichment
We used the IPA system to evaluate our resultant module genes. As shown in Table 1, several cancer-related pathways were enriched in our module genes, including PTEN signaling (P = 7.94 × 10⁻¹²), EGF signaling (P = 1.58 × 10⁻¹¹), molecular mechanisms of cancer (P = 1.95 × 10⁻⁹) and PDGF signaling (P = 2.04 × 10⁻⁹). These results further indicate the significant enrichment of our identified subnetwork with genes related to cancer (Blanco-Aparicio et al., 2007; Cully et al., 2006; Roussidis et al., 2007; Roy et al., 2010), as GWA study is essentially hypothesis free.
4.2 Pancreatic cancer GWAS analysis
For the analysis of the pancreatic cancer GWAS dataset, we also used d = 2 and r = 0.1 to perform DMS and identified 9281 single modules. The modules have an average size of 10.27 (SD = 1.85). Similar to breast cancer, we selected the top 1% of modules based on module score distribution as candidates. Ninety-three modules were thus selected; their ZN values ranged from 6.95 to 7.51. Examination of the 93 modules using permutation data indicated that all were significantly associated with pancreatic cancer (nominal P < 0.001). We then selected the 159 non-redundant genes involved in these modules as candidate genes for pancreatic cancer (Supplementary Table 2).
Table 2.
Comparison of GSEA results of module gene sets with canonical pathways
| Pathway | Set size | ESa | NES | Nominal P-value | FDR |
|---|---|---|---|---|---|
| Breast cancer | |||||
| CGEMS_Breast_Cancer | 166 | 0.723 | 9.741 | < 0.001 | 0.000 |
| SIG IL4 receptor in B lyphocytes | 27 | 0.556 | 2.658 | 0.004 | 0.333 |
| SA B-cell receptor complexes | 24 | 0.627 | 2.645 | 0.005 | 0.333 |
| Axon guidance | 126 | 0.524 | 2.562 | 0.005 | 0.333 |
| Regulation of actin cytoskeleton | 209 | 0.427 | 2.552 | 0.002 | 0.266 |
| Pancreatic cancer | |||||
| CGEMS_Pan_Cancer | 159 | 0.748 | 11.193 | < 0.001 | 0.000 |
| Aldosterone-regulated sodium reabsorption | 41 | 0.615 | 3.659 | < 0.001 | 0.000 |
| Cell-to-cell pathway | 13 | 0.761 | 3.422 | < 0.001 | 0.000 |
| N_glycan biosynthesis | 21 | 0.636 | 3.148 | < 0.001 | 0.000 |
| B-cell receptor signaling pathway | 74 | 0.508 | 3.106 | 0.001 | 0.076 |
aES: enrichment score.
4.2.1 Pancreatic cancer candidate genes and subnetwork
Among the 159 genes, 84.3% achieved nominal significance (P < 0.05). Survey of the CGC data revealed that 13 genes have been previously reported as cancer genes; they are ALK, ASXL1, ATIC, EGFR, EP300, HNRNPA2B1, KIAA1549, KTN1, LCK, MYC, NSD1, ROS1 and SEPT6 (Folch-Puy et al., 2006; Futreal et al., 2004; Gayther et al., 2000).
We further combined these top 93 modules and constructed a PPI subnetwork for pancreatic cancer (Supplementary Fig. 1). In this subnetwork, the genes of highest degree (degree ≥6) are EGFR, ATF7IP, GRB2, NCK1, ESR1, ACTB, RAC1, MEPCE, STAT3, FASLG, SRC, EP300, ATXN1, BCAR1, MYC, LCK, FAS, DLG2 and DOCK1. As observed in breast cancer, we found some genes with non-significant P-values were recruited by DMS, such as EP300 (P = 0.062) (Mees et al., 2010) and GRB2 (P = 0.15) (Sastry et al., 1997).
4.2.2 Pathway enrichment analysis
Pathway enrichment analysis using IPA revealed several cancer-related pathways enriched in the subnetwork (Table 1). For example, Myc-mediated apoptosis signaling (P = 1.70 × 10⁻⁷), ERK/MAPK signaling (P = 1.62 × 10⁻⁶) and molecular mechanisms of cancer (P = 7.24 × 10⁻⁶) were significantly enriched and ranked within the top 10 pathways. Most of these pathways have been reported to play roles in cell-cycle regulation, cell survival and cell apoptosis (Cully et al., 2006; Furukawa, 2008). Constitutive activation of the ERK/MAPK signaling pathway has been observed in many tumors with consequences including increased cell proliferation, motility and invasion, and inhibition of apoptotic mechanisms (Modjtahedi and Essapen, 2009). The gene EGFR from the ERK/MAPK signaling pathway, which is a highly connected node in our subnetwork (Supplementary Figure 1), was found to be over-expressed in multiple cancers, and has been specifically designated as a promising drug target in pancreatic cancer (Furukawa, 2008; Modjtahedi and Essapen, 2009).
4.3 Comparison with GSEA of GWAS datasets
Our application of dmGWAS to two cancer GWAS datasets revealed interesting results that evade identification by the typical single marker/gene analysis of GWAS data (Amundadottir et al., 2009; Hunter et al., 2007). To evaluate whether DMS has better performance than other methods, we compared our DMS results with those generated by GSEA, a method widely used in microarray expression data and other genomic data analysis including GWAS analysis.
To compare with the GSEA algorithm, we took the 166 module genes for breast cancer as one gene set (termed ‘CGEMS_Breast_Cancer’), and analyzed it using the GSEA method adapted to GWAS (Jia et al., 2010; Wang et al., 2007), together with other pathway gene sets downloaded from MSigDB (Subramanian et al., 2005). Pathways with ≥20 genes and ≤250 genes were used for testing. In total, 533 pathways were examined using both the original and permutation datasets of CGEMS breast cancer. The top five enriched pathways are listed in Table 2.
Strikingly, our module gene set has the highest normalized enrichment score (NES) compared with all other canonical pathway gene sets, indicating that the genes we identified using DMS result in more association signal than any prior-knowledge pathways. A full list of pathways with nominal P < 0.05 and NES > 0 were provided in Supplementary Table 3.
We also performed GSEA using the 159 pancreatic cancer candidate genes as one gene set (termed as CGEMS_Pan_Cancer) plus canonical pathways. GSEA was performed with both the original and permutated GWAS datasets of CGEMS pancreatic cancer. As shown in Table 2, CGEMS_Pan_Cancer is the most significant one with NES as 11.193. There are also other significant pathways that have significant nominal P-values, such as aldosterone-regulated sodium reabsorption, cell-to-cell pathway and N_glycan biosynthesis. However, the CGEMS_Pan_Cancer gene set has the highest NES, which is mostly used in GSEA method to rank gene sets. A full list of pathways with nominal P < 0.05 and NES > 0 were provided in Supplementary Table 4.
4.4 Parameter settings in dmGWAS
There are two key parameters in the implementation of DMS: d, the shortest path from a candidate node to any node in a module and r, the rate of proportion increment of Zm. We used d = 2 and r = 0.1 in the above demonstration using DMS to analyze breast cancer and pancreatic cancer datasets. However, we also examined other potential values and showed that the values we used are appropriate.
To evaluate the effect of d, we performed the same procedure on breast cancer GWAS dataset using d = 1. The top 1% modules and involved genes were selected and analyzed using IPA. However, most of the cancer pathways and functions are no longer ranked as significant, e.g. the three most significant pathways are axonal guidance signaling, ephrin receptor signaling and thrombopoietin signaling (data not shown). Similar results occurred in analysis of the pancreatic cancer dataset. These results indicate that the value we chose for d is effective.
To assess the impact of r during the DMS process, we used four different r-values (0.05, 0.1, 0.15 and 0.2) for both breast cancer and pancreatic cancer data, following the same procedure for benchmarking. As shown in Figure 3, the average module size decreases when r increases. For breast cancer, average module size was 20.08 when r = 0.05, 11.65 when r = 0.1, 8.50 when r = 0.15 and 7.00 when r = 0.2. The same trend was observed for pancreatic cancer. When r is small, the size of modules tends to be large so that non-specific nodes might be included and, thus, dilute the signal. When r is large, the size of the modules became small, possibly excluding informative genes from the module. When r is 0.2, the module size is close to five, the value that we used for inclusion of a module.
Fig. 3.

Module size using different values of r. (A) Impact of r on breast cancer GWAS dataset. (B) Impact of r on pancreatic cancer GWAS dataset.
5 DISCUSSION
We introduced a DMS method to prioritize candidate genes by integrating the association signal from GWAS datasets with a protein-protein interaction network. We proposed a comprehensive strategy to incorporate the method into GWAS data analysis and provide an R-package implementation for public use. Although the original searching algorithm has been applied in expression data analysis, the strategy proposed and the novel tool developed here are more specifically designed for GWAS, thus making a more direct application possible for geneticists.
5.1 DMS results revealed more cancer-related genes and pathways
For both breast and pancreatic cancer, our DMS method identified a set of disease candidate genes including many cancer genes enriched in several cancer-related pathways. These genes generally have modest association levels in the original GWAS data, i.e. most of them could not reach genome-wide significance (5 × 10⁻⁸); thus, they have remained unidentified by single marker analysis. However, these genes were recruited by DMS because of their combined effect, specifically in the form of a module in the human interactome, which is significant in respect of both an enrichment test (indicated by ZN) and association test (nominal P). It is worth noting that our DMS of CGEMS dataset could not identify two breast cancer genes, BRCA1 or BRCA2, because they did not have small P-values of markers (the smallest P-value was 0.324 in BRCA1 and 0.102 in BRCA2), neither were they located in a low-P-value PPI environment. Furthermore, caution should be used that those genes are not directly clinically relevant; rather, they are assessed by functional enrichment analysis and prior evidence.
Comparison with pathway-based methods showed that the DMS method is flexible in searching for and defining a gene set associated with a disease. The pathways enriched in our modules as identified by IPA are generally more relevant to each disease than those revealed by GSEA. For example, the PTEN signaling pathway is involved in multiple cellular processes including apoptosis, metabolism, cell proliferation and cell growth and has been reported to be involved in many tumors (Blanco-Aparicio et al., 2007; Li et al., 1997). Germline mutations in PTEN have been commonly observed in breast cancer patients and intimately involve cross-talk with the PI3K signaling pathway and the EGF signaling pathway (Li et al., 1997; Navolanic et al., 2003). Although PTEN was not included in our breast cancer subnetwork, several key participants involved in these signaling pathways, such as EGFR, GSK3B, JAK1, PIK3R1, PIK3R2, RAF1 and SOS1 were observed in breast cancer (Cully et al., 2006). For pancreatic cancer, the PTEN signaling pathway was significantly enriched as well as Myc-mediated apoptosis signaling and ERK/MAPK signaling, which have been well documented for involvement (Jimeno et al., 2008; Roy et al., 2010). Therapies targeting epidermal growth factor receptors (EGFRs) and RAS-MAPK pathways have also been developed and investigated (Furukawa, 2008). Interestingly, EGFR is the hub node in our pancreatic cancer subnetwork with the most interactors (Supplementary Fig. 1). Compared with the pathways identified by GSEA, the genes and pathways we identified tend to be more relevant to cancer and may provide further clues in understanding the interactions between these genes.
Our results also prove that genetic signals may converge in certain subnetworks in the human interactome that are enriched with interesting biological pathways and functional groups. This is consistent with the hypothesis that pathway-based methods often adopt, i.e. that certain pathways might be significantly enriched in the whole dataset (Wang et al., 2007). Recent developments in the understanding of human genetics have demonstrated that for most complex diseases, there might be a few rare variants that dispose significant risk to cause the disease, while it is also possible that multiple common variants are responsible for the disease, each predisposing a modest risk factor and affecting certain important molecular processes. Our results provide further support for the second hypothesis that genes with modest association P-values could converge in a specific subnetwork significantly associated with the disease.
5.2 Determination of d and r
The DMS method relies on two key parameters, i.e. d and r. In our demonstration, we used d = 2 and r = 0.1. Our examination of other values for d and r showed that the values we used are effective. As suggested by Chuang et al. (2007) work, the parameter d is suggested to be 2 in most cases, which has also been proved in our comparative results (Section 4.4). The parameter r appeared to have moderate impact on the results because r can directly affect the size of a module and the genes included during module expansion process. The value of r might work in a way dependent on specific datasets [e.g. in expression data, r is set as 0.05 (Chuang et al., 2007)]. Thus, we propose to assess multiple values of r to select an appropriate value before performing module searching. This option has been made easily available in our R package.
5.3 Module selection strategies
Although the strategy we used to select top modules appears to be arbitrary, it works appropriately, as demonstrated by our follow-up evaluation using a permutated GWAS dataset. Our evaluation showed that these modules are significantly associated with the disease. A previous work by Baranzini et al. (2009) used jActiveModule in Cytoscape and performed similar network-based analysis of GWAS dataset for multiple sclerosis. They selected modules with minimum overlap. We consider this as another option to select modules and could be incorporated in the updated version of dmGWAS. However, jActiveModule was originally designed for microarray gene expression data and is not immediately used for GWAS data, especially dealing with the permutation process of the GWAS datasets. With the fast development and data generation in the field of GWAS, more and more datasets are expected to be available in the near future; thus, we propose a method of selecting significant modules by using two GWAS datasets, one as discovery and the other as an evaluation dataset, in order to minimize bias. We have implemented this dual-evaluation strategy (the ‘multiple GWAS datasets’ strategy in Fig. 1 and detailed documentation can be found in dmGWAS web site) in the dmGWAS package and it will be incorporated in our future work.
In conclusion, we proposed a DMS method for integrative analysis of GWAS data and PPI data and implemented the method in an R package, dmGWAS. We demonstrated the method in two GWAS datasets for breast cancer and pancreatic cancer and identified a set of candidate genes for each disease. Importantly, our DMS method showed the connections among these genes in the context of PPI network, and thus may help further understanding and elucidation of the mechanisms underlying complex diseases. Each gene set was further assessed using pathway enrichment methods and it was shown that several cancer-related pathways were enriched in both gene sets. The genes we identified greatly expanded the candidate gene list as revealed in the original GWA studies and provide more targets for future validation. The R package we provided also makes the method easily applicable in the analysis of other complex diseases.
Supplementary Material
ACKNOWLEDGEMENTS
We would like to thank Todd Edwards for his assistance in GWAS data preparation and Jeffrey Ewers for his critical reading of the manuscript. The datasets used for the analyses described in this work were from the Cancer Genetics Markers of Susceptibility (CGEMS) pancreatic and breast cancer studies and were obtained from the database of Genotype and Phenotype (dbGaP) found at http://www.ncbi.nlm.nih.gov/gap through an approved data request application. The accession number of the breast cancer CGEMS GWAS dataset is phs000147.v1.p1 whereas for the pancreatic cancer it is phs000206.v2.p1. A full list of the investigators who contributed to the generation of data is available from http://cgems.cancer.gov/.
Funding: National Institutes of Health (grants P20AA017828 and R21AA017437 to Z.Z.); NARSAD Young Investigator Award (to Z.Z.); Vanderbilt's Specialized Program of Research Excellence in GI Cancer (grant P50CA95103 to Z.Z. and W.Z.); and the Vanderbilt-Ingram Cancer Center Core (grant P30CA68485 to Z.Z. and W.Z.).
Conflict of Interest: none declared.
REFERENCES
- Amundadottir L, et al. Genome-wide association study identifies variants in the ABO locus associated with susceptibility to pancreatic cancer. Nat. Genet. 2009;41:986–990. doi: 10.1038/ng.429. [DOI] [PMC free article] [PubMed] [Google Scholar]
- Baranzini SE, et al. Pathway and network-based analysis of genome–wide association studies in multiple sclerosis. Hum. Mol. Genet. 2009;18:2078–2090. doi: 10.1093/hmg/ddp120. [DOI] [PMC free article] [PubMed] [Google Scholar]
- Blanco-Aparicio C, et al. PTEN, more than the AKT pathway. Carcinogenesis. 2007;28:1379–1386. doi: 10.1093/carcin/bgm052. [DOI] [PubMed] [Google Scholar]
- Chen BE, et al. Resampling-based multiple hypothesis testing procedures for genetic case-control association studies. Genet. Epidemiol. 2006;30:495–507. doi: 10.1002/gepi.20162. [DOI] [PubMed] [Google Scholar]
- Chuang HY, et al. Network-based classification of breast cancer metastasis. Mol. Syst. Biol. 2007;3:140. doi: 10.1038/msb4100180. [DOI] [PMC free article] [PubMed] [Google Scholar]
- Cully M, et al. Beyond PTEN mutations: the PI3K pathway as an integrator of multiple inputs during tumorigenesis. Nat. Rev. Cancer. 2006;6:184–192. doi: 10.1038/nrc1819. [DOI] [PubMed] [Google Scholar]
- De Brakeleer S, et al. Cancer predisposing missense and protein truncating BARD1 mutations in non-BRCA1 or BRCA2 breast cancer families. Hum. Mutat. 2010;31:E1175–1185. doi: 10.1002/humu.21200. [DOI] [PubMed] [Google Scholar]
- Folch-Puy E, et al. Pancreatitis-associated protein I suppresses NF-kappa B activation through a JAK/STAT-mediated mechanism in epithelial cells. J. Immunol. 2006;176:3774–3779. doi: 10.4049/jimmunol.176.6.3774. [DOI] [PubMed] [Google Scholar]
- Furukawa T. Molecular targeting therapy for pancreatic cancer: current knowledge and perspectives from bench to bedside. J. Gastroenterol. 2008;43:905–911. doi: 10.1007/s00535-008-2226-1. [DOI] [PubMed] [Google Scholar]
- Futreal PA, et al. A census of human cancer genes. Nat. Rev. Cancer. 2004;4:177–183. doi: 10.1038/nrc1299. [DOI] [PMC free article] [PubMed] [Google Scholar]
- Gayther SA, et al. Mutations truncating the EP300 acetylase in human cancers. Nat. Genet. 2000;24:300–303. doi: 10.1038/73536. [DOI] [PubMed] [Google Scholar]
- Hindorff LA, et al. Potential etiologic and functional implications of genome-wide association loci for human diseases and traits. Proc. Natl Acad. Sci. USA. 2009;106:9362–9367. doi: 10.1073/pnas.0903103106. [DOI] [PMC free article] [PubMed] [Google Scholar]
- Hunter DJ, et al. A genome-wide association study identifies alleles in FGFR2 associated with risk of sporadic postmenopausal breast cancer. Nat. Genet. 2007;39:870–874. doi: 10.1038/ng2075. [DOI] [PMC free article] [PubMed] [Google Scholar]
- Ideker T, et al. Discovering regulatory and signalling circuits in molecular interaction networks. Bioinformatics. 2002;18(Suppl. 1):S233–S240. doi: 10.1093/bioinformatics/18.suppl_1.s233. [DOI] [PubMed] [Google Scholar]
- Ito I, et al. Estrogen inhibits transforming growth factor beta signaling by promoting Smad2/3 degradation. J. Biol. Chem. 2010;285:14747–14755. doi: 10.1074/jbc.M109.093039. [DOI] [PMC free article] [PubMed] [Google Scholar]
- Jia P, et al. Common variants conferring risk of schizophrenia: a pathway analysis of GWAS data. Schizophr. Res. 2010;122:38–42. doi: 10.1016/j.schres.2010.07.001. [DOI] [PMC free article] [PubMed] [Google Scholar]
- Jimeno A, et al. Coordinated epidermal growth factor receptor pathway gene overexpression predicts epidermal growth factor receptor inhibitor sensitivity in pancreatic cancer. Cancer Res. 2008;68:2841–2849. doi: 10.1158/0008-5472.CAN-07-5200. [DOI] [PubMed] [Google Scholar]
- Li J, et al. PTEN, a putative protein tyrosine phosphatase gene mutated in human brain, breast, and prostate cancer. Science. 1997;275:1943–1947. doi: 10.1126/science.275.5308.1943. [DOI] [PubMed] [Google Scholar]
- Mees ST, et al. EP300–a miRNA-regulated metastasis suppressor gene in ductal adenocarcinomas of the pancreas. Int. J. Cancer. 2010;126:114–124. doi: 10.1002/ijc.24695. [DOI] [PubMed] [Google Scholar]
- Modjtahedi H, Essapen S. Epidermal growth factor receptor inhibitors in cancer treatment: advances, challenges and opportunities. Anticancer Drugs. 2009;20:851–855. doi: 10.1097/CAD.0b013e3283330590. [DOI] [PubMed] [Google Scholar]
- Navolanic PM, et al. EGFR family signaling and its association with breast cancer development and resistance to chemotherapy (Review) Int. J. Oncol. 2003;22:237–252. [PubMed] [Google Scholar]
- O'Dushlaine C, et al. The SNP ratio test: pathway analysis of genome-wide association datasets. Bioinformatics. 2009;25:2762–2763. doi: 10.1093/bioinformatics/btp448. [DOI] [PubMed] [Google Scholar]
- Peng G, et al. Gene and pathway-based second-wave analysis of genome-wide association studies. Eur. J. Hum. Genet. 2010;18:111–117. doi: 10.1038/ejhg.2009.115. [DOI] [PMC free article] [PubMed] [Google Scholar]
- Purcell S, et al. PLINK: a tool set for whole-genome association and population-based linkage analyses. Am. J. Hum. Genet. 2007;81:559–575. doi: 10.1086/519795. [DOI] [PMC free article] [PubMed] [Google Scholar]
- Roussidis AE, et al. The importance of c-Kit and PDGF receptors as potential targets for molecular therapy in breast cancer. Curr. Med. Chem. 2007;14:735–743. doi: 10.2174/092986707780090963. [DOI] [PubMed] [Google Scholar]
- Roy SK, et al. Inhibition of PI3K/AKT and MAPK/ERK pathways causes activation of FOXO transcription factor, leading to cell cycle arrest and apoptosis in pancreatic cancer. J. Mol. Signal. 2010;5:10. doi: 10.1186/1750-2187-5-10. [DOI] [PMC free article] [PubMed] [Google Scholar]
- Ruano D, et al. Functional gene group analysis reveals a role of synaptic heterotrimeric G proteins in cognitive ability. Am. J. Hum. Genet. 2010;86:113–125. doi: 10.1016/j.ajhg.2009.12.006. [DOI] [PMC free article] [PubMed] [Google Scholar]
- Sastry L, et al. Multiple Grb2-protein complexes in human cancer cells. Int. J. Cancer. 1997;70:208–213. doi: 10.1002/(sici)1097-0215(19970117)70:2<208::aid-ijc12>3.0.co;2-e. [DOI] [PubMed] [Google Scholar]
- Subramanian A, et al. Gene set enrichment analysis: a knowledge-based approach for interpreting genome-wide expression profiles. Proc. Natl Acad. Sci. USA. 2005;102:15545–15550. doi: 10.1073/pnas.0506580102. [DOI] [PMC free article] [PubMed] [Google Scholar]
- Tomkova K, et al. Contribution of p53, p63, and p73 to the developmental diseases and cancer. Neoplasma. 2008;55:177–181. [PubMed] [Google Scholar]
- Wang K, et al. Pathway-based approaches for analysis of genomewide association studies. Am. J. Hum. Genet. 2007;81:1278–1283. doi: 10.1086/522374. [DOI] [PMC free article] [PubMed] [Google Scholar]
- Wu J, et al. Integrated network analysis platform for protein-protein interactions. Nat. Meth. 2009;6:75–77. doi: 10.1038/nmeth.1282. [DOI] [PubMed] [Google Scholar]
Associated Data
This section collects any data citations, data availability statements, or supplementary materials included in this article.