Abstract
The synthesis, linear photophysical and photochemical parameters, two-photon absorption (2PA), and superfluorescence properties of 2,2′-(5,5′-(9,9-didecyl-9H-fluorene-2,7-diyl)bis(ethyne-2,1-diyl)bis(thiophene-5,2-diyl))dibenzo[d]thiazole (1) were investigated, suggesting its potential as an efficient fluorescent probe for bioimaging applications. The steady-state absorption, fluorescence, and excitation anisotropy spectra of 1 were measured in several organic solvents and aqueous media. Probe 1 exhibited high fluorescence quantum yield (∼ 0.7-0.8) and photochemical stability (photobleaching quantum yield ∼ (3 - 7)·10-6). The 2PA spectra were determined over a broad spectral range (640-920 nm) using a standard two-photon induced fluorescence method under femtosecond excitation. A well-defined two-photon allowed absorption band at 680-720 nm with corresponding 2PA cross sections δ2PA ≈ 800-900 GM was observed. The use of probe 1 in bioimaging was shown via one- and two-photon fluorescence imaging of HCT-116 cells. An amplification of the stimulated emission of 1 was demonstrated in organic solvents and thin polystyrene films, which potentially can be used for the development of new fluorescent labels with increased spectral brightness.
1. Introduction
The development of new highly fluorescent organic compounds with efficient two-photon absorption (2PA) properties is a subject of broad scientific and technological interest for a number of multidisciplinary applications,1-7 including 3D biological imaging by two-photon fluorescence microscopy (2PFM) methods.5-7 Directional synthesis of new fluorescent labels and comprehensive investigations of their linear photophysical, nonlinear-optical and photochemical properties can appreciably extend the abilities of bioimaging applications. High fluorescence quantum yield, Φ, large values of 2PA cross sections, δ2PA, as well as their product, (so-called two-photon action cross section8), and photochemical stability under high intensity laser irradiation are the primary properties required for 2PFM-based applications of organic chromophores.9-11 A number of potential fluorescence labels with suitable 2PA properties have been synthesized for two-photon bioimaging use (see, e.g., nonlinear optical properties of water soluble [2.2]paracyclophane-based fluorophores with high values of ,8 2,6-bis(p-dialkylaminostyryl)anthracene derivatives,12 and dipyrrylmetheneboron difluoride compounds13). Among these, high two-photon absorbing fluorene-based derivatives are promising fluorescent labels for 2PFM bioimaging applications.14-16 In addition to strong 2PA transitions, fluorene derivatives exhibit efficient stimulated emission depletion17 and lasing properties,18 which can dramatically improve the quality and scope of microscopic images and techniques.
In this paper, we report a new fluorene-based probe, 2,2′-(5,5′-(9,9-didecyl-9H-fluorene-2,7-diyl)bis(ethyne-2,1-diyl)bis(thiophene-5,2-diyl))dibenzo[d]thiazole (1),19 and comprehensive characterization of its linear photophysical, 2PA, superfluorescence, and lasing properties in isotropic solutions. The rationale for the molecular design of this compund was previously described.19 Linear photophsyical investigations include a detailed analysis of the nature of absorption bands by excitation anisotropy,20 along with fluorescence lifetime and quantum yield measurements, in various organic solvents and aqueous media. 2PA spectra of probe 1 were obtained over a broad spectral range by a two-photon induced fluorescence (2PF) method.9 Probe 1 was encapsulated in Pluronic® F127 and used as a fluorescent probe to image endosomes and lysosomes via one- and two-photon fluorescence micrososopy in HCT-116 cells. The investigation of the broad range of excited state absorption (ESA) spectra, superfluorescence, and lasing potential of 1 is just the first step in the development of new types of organic labels with high spectral brightness for fluorescence microscopy applications.
2. Experimental Section
2.1. Synthesis of probe 1
2-(5-Bromothiophen-2-yl)benzothiazole (2) and 2,7-dibromo-9,9-didecyl-9H-fluorene (5) were prepared as described in the literature.21, 22 Microwave-facilitated reactions were carried out under N2 in a CEM Discover microwave reactor in 10 mL closed vessels, programmed at a maximum temperature of 130 °C, maximum pressure of 100 psi, and maximum power of 100 Watts. All reagents and solvents were used as received from commercial suppliers unless otherwise noted. 1H and 13C NMR spectra were recorded in CDCl3 on a Varian NMR spectrometer at 500 and 125 MHz, respectively. Elemental analyses were performed by Atlantic Microlab, Inc.
Synthesis of 4-(5-(benzothiazol-2-yl)thiophen-2-yl)-2-methylbut-3-yn-2-ol (3)
2-(5-Bromothiophen-2-yl)benzothiazole (2) (200 mg, 0.67 mmol), 2-methyl-3-butyn-2-ol (170 mg, 2.02 mmol), Pd(PPh3)2Cl2 (19 mg, 0.027 mmol) and CuI (5 mg, 0.027 mmol) were dissolved in a 1:4 mixture of Et3N:toluene (5 mL). The mixture was either heated under reflux for 12 h or irradiated by microwave for 2 min, at which time it was determined by TLC that the reaction was completed. The mixture was filtered through a celite plug, and purified by column chromatography using hexanes:EtOAc (1:1) to yield 192 mg (96%) of pale yellow solid by either method; m.p. 164-165 °C. 1H NMR (500 MHz, CDCl3) δ 8.02 (d, J=8.04Hz, 1H, Ph-H), 7.85 (d, J=7.87Hz, 1H, Ph-H), 7.50 (d, J=3.95 Hz, 1H, Thy-H), 7.47 (m, 1H, Ph-H), 7.38 (m, 1H, Ph-H), 7.18 (d, J=3.95 Hz, 1H, Thy-H), 2.11 (s, 1H, -OH), 1.64 (s, 6H, CH3). 13C NMR (125 MHz, CDCl3) δ 160.4, 153.6, 137.9, 134.7, 132.9, 128.3, 126.4, 125.4, 123.1, 121.5, 121.4, 100.2, 75.2, 65.8, 31.3. Anal. Calcd for C16H13NOS2: C, 64.18; H, 4.38; N, 4.68. Found: C, 64.10; H, 4.33; N, 4.64.
Synthesis of 2-(5-ethynylthiophen-2-yl)benzothiazole (4)
4-(5-(Benzothiazol-2-yl)thiophen-2-yl)-2-methylbut-3-yn-2-ol (3) (300 mg, 1.0 mmol) and KOH (300 mg, 5.3 mmol) were heated either under reflux for 2 h or under microwave irradiation for 8 min. The mixture was filtered, and purified by column chromatography using hexanes to yield 180 mg (75%) by conventional heating or 236 mg (98%) via microwave of pale yellow solid; m.p. 117-118 °C. 1H NMR (500 MHz, CDCl3) δ 8.03 (d, J=8.21Hz, 1H, Ph-H), 7.86 (d, J=8.21Hz, 1H, Ph-H), 7.51 (d, J=3.94 Hz, 1H, Thy-H), 7.48 (m, 1H, Ph-H), 7.39 (m, 1H, Ph-H), 7.28 (d, J=3.94 Hz, 1H, Thy-H), 3.50 (s, 1H, C≡C-H). 13C NMR (125 MHz, CDCl3) δ 160.2, 153.6, 138.5, 134.8, 133.9, 133.7, 127.8, 126.5, 125.4, 123.2, 121.6, 84.0, 76.5. Anal. Calcd for C13H7NS2: C, 64.70; H, 2.92; N, 5.80. Found: C, 64.64; H, 2.91; N, 5.75.
Synthesis of 2,2′-(5,5′-(9,9-didecyl-9H-fluorene-2,7-diyl)bis(ethyne-2,1-diyl)bis(thiophene-5,2-diyl))dibenzothiazole (1):19
2,7-Bibromo-9,9-didecyl-9H-fluorene (5) (300 mg, 0.50 mmol), 2-(5-ethynylthiophen-2-yl)benzothiazole (4) (263 mg, 1.09 mmol), Pd(PPh3)2Cl2 (30 mg, 0.04 mmol), and CuI (8 mg, 0.04 mmol) were dissolved in a 1:4 mixture of Et3N:toluene (5 mL). The mixture was heated under reflux for 12 h or by microwave for 1 h. The mixture was filtered through a celite plug and purified by column chromatography using hexanes:EtOAc (10:1) to yield 252 mg (55%) of a yellow solid by conventional heating and 298 mg (65%) when microwave irradiation was used; m.p. 74.0-75.5 °C. 1H NMR (500 MHz, CDCl3) δ 8.04 (dd, J=8.09 Hz, J=0.54 Hz, 2H, Ph-H), 7.87 (dd, J=8.04 Hz, J=0.53 Hz, 2H, Ph-H), 7.70 (d, J=7.83 Hz,2H, Ph-H), 7.57 (d, J=3.89 Hz, 1H, Thy-H), 7.55 (m, 2H, Ph-H), 7.53 (m, 2H, Ph-H), 7.49 (m, 2H, Ph-H), 7.39 (m, 2H, Ph-H), 7.31 (d, J=3.89 Hz, 1H, Thy-H), 2.00 (m, 4H, CH2), 1.15 (m, 28H, CH2), 0.84 (t, J=6.96 Hz, 6H, CH3), 0.61 (m, 4H, CH2). 13C NMR (125 MHz, CDCl3) δ 160.5, 153.7, 151.3, 141.1, 138.0, 134.7, 132.6, 130.8, 128.4, 127.1, 126.6, 125.9, 125.5, 123.1, 121.5, 121.3, 120.2, 97.0, 82.9, 55.4, 40.3, 31.9, 30.0, 29.6, 29.5, 29.3, 29.3, 23.8, 22.7, 14.1. Anal. Calcd for C59H60N2S4: C, 76.58; H, 6.54; N, 3.03. Found: C, 76.79; H, 6.75; N, 2.79.
2.2. Linear photophysical characterization and one-photon bioimaging
The steady-state linear spectral data, fluorescence quantum yields, and lifetimes of 1 were measured in hexane, cyclohexane, toluene, tetrahydrofuran (THF), dichloromethane (DCM), dimethylsulfoxide (DMSO), acetonitrile (ACN), and an aqueous mixture (95 wt% water and 5 wt% DMSO) at room temperature. All solvents were of spectroscopic grade, received from commercial sources, and used without further purification. One-photon absorption spectra of 1 were obtained with an Agilent 8453 UV–visible spectrophotometer using quartz cuvettes with different path lengths (0.01, 0.1, 1.0 and 10 mm) for a broad range of molecular concentrations 10-2 M ≤ C ≤ 10-6 M. The steady-state fluorescence and excitation anisotropy spectra were measured with a PTI QuantaMaster spectrofluorimeter, in 10 mm spectrofluorometric quartz cuvettes for low concentration solutions C ≤ 10-6 M. All experimentally registered fluorescence spectra were corrected for the spectral responsivity of the PTI detection system. The excitation anisotropy spectra of 1 were obtained in the L-format configuration geometry,20 with extraction of pure solvent emission and scattered light. Fluorescence quantum yields, Φ, of 1 at low concentration were determined by a standard relative method with 9,10 diphenylanthracene in cyclohexane as a reference compound.20 The values of fluorescence lifetimes of 1, τ, were obtained with a time-correlated single photon counting system PicoHarp 300 under linear polarized (oriented by the magic angle) femtosecond excitation, with time resolution ≈ 80 ps. The values of τ were obtained through the best tail fitting.
Epifluorescence one-photon fluorescence images were obtained using inverted microscope (Olympus IX70) equipped with a QImaging cooled CCD (Model Retiga EXi) and excitation mercury lamp 100 W and an Olympus IX81 DSU equipped with a Hammamatsu EM-CCD C9100. In order to improve the fluorescence background-to-image ratios a customized filter cube (Ex 377/50, DM 409, Em 460/50) was used for the one-photon fluorescence images. The specifications of the filter cube were tailored to match the excitation and emission of 1.
Cell culture and incubation
HCT 116 cell were cultured in DMEM, supplemented with 10% FBS, and 1% penicillin, 1% streptomycin, at 37 °C, under 5% CO2 environment. N° 1 round 12 mm coverslips were treated with poly-D-lysine, to improve cell adhesion, and washed (3×) with PBS buffer solution. The treated cover slips were placed in 24-well plates and 80,000 cells/well were seeded and incubated at the same conditions as indicated above until 75-85% confluency was reached on the coverslips. From a 3.03 × 10⁻⁴ M stock solution of Pluronic 127 encapsulated probe 1, a series of 0.1, 1, 10, 25, and 50 μM solutions in culture media were prepared, all containing 75 nM of Lysotracker™ Red (Invitrogen). These solutions were used to incubate the cells for 3 h. The dye solutions were extracted and the coverslipped cells were washed abundantly with PBS (4×).
Cell fixing and mounting
Cells were fixed with 3.7% solution of paraformaldehyde in pH=7.4 PBS buffer for 10 min. The fixing agent was extracted and washed (2×) with PBS. To reduce autofluorescence, a fresh solution of NaBH4 (1 mg/mL) in pH=8 PBS buffer was used to treat the fixed cells (2×). The coverslipped cells were then washed with buffer PBS (2×) and mounted on microscope slides using Prolong Gold (Invitrogen) as mounting media.
Cell viability
Cell viability was assessed with CellTiter® 96 AQ (Promega). HCT 116 cells were seeded (5×10³ cells/well) in a 96 well plate and incubated for 24 h in 90 μL of DMEM (Invitrogen) without phenol red, supplemented with 10% FBS (Atlanta Biologicals), and 1% penicillin-streptomycin. The cells were incubated for an additional 24 h with 60, 50, 25, 10, and 1 μM solutions of Pluronic® K 127-encapsulated probe 1 in FBS complemented (10%) culture media. Then 20 μM of the CellTiter® 96 AQ reagent was added into each well and subsequently incubated for another 4 h, 37 °C, after which the respective absorbance values were read on a SpectraMax M5 plate reader (Molecular Devices) at 490 nm to determine the relative amount of formazan produced.23 Cell viability % was calculated by the following expression:
where Abss490nm is the absorbance of the cells at the different concentrations of micelle encapsulated probe 1, AbsB490nm is the absorbance of a cell-free well containing only encapsulated probe 1 at the concentrations that were studied, AbsC490nm is the absorbance of cells incubated in media without any other component, and AbsB2490nm is the absorbance of a cell-free well.
The photochemical decomposition quantum yields of 1, Φph, were determined in organic solvents and aqueous mixture by the absorption method,24 based on precise measurements of kinetic changes in the corresponding absorption spectra during one-photon UV irradiation (405 nm diode laser with CW irradiance ∼ 30 mW/cm2). In this case, the values of Φph can be expressed by the equation:
| (1) |
were D(λ,t), NA, ɛ(λ), I(λ) and tir are the optical density, Avogadro's number, extinction coefficient, laser irradiance, and total irradiation time, respectively. A comprehensive description of this methodology was described previously.24
2.3. Two-photon spectral and bioimaging measurements
2PA spectra of probe 1 were measured over a broad spectral region in spectroscopic grade cyclohexane, DMSO, and aqueous media using a typical 2PF method relative to Rhodamine B in methanol as a standard.25 The 2PF technique employed a PTI QuantaMaster spectrofluorimeter coupled with a femtosecond Clark-MXR CPA-2010 laser that pumped an optical parametric generator/amplifiers (TOPAS) with a 600-950 nm tuning range, pulse duration ≈ 140 fs (FWHM), 1 kHz repetition rate, and pulse energies up to ∼ 0.15 μJ. Two-photon fluorescence measurements were performed in 10 mm fluorometric quartz cuvettes with dye concentrations ∼ 10-5 M. The values of 2PA cross section, δ2PA, were determined by the equation:9
| (2) |
where 〈F(t)〉, 〈P(t)〉, C, and φ are the averaged fluorescence intensity, excitation power, molecular concentration, and geometric factor, respectively. Subscripts S and R refer to the sample and reference compound. The quadratic dependence of 2PF intensity on the excitation power was determined for each excitation wavelength, λex, while special attention was paid to verify the independence of the fluorescence quantum yield on λex.
Two-photon fluorescence imaging was performed on a modified Olympus Fluoview FV300 laser scanning confocal microscopy system equipped with a broadband, tunable Coherent Mira Ti:sapphire laser (200 fs pulse width, 76 MHz repetition rate), pumped by a 10 W Coherent Verdi frequency doubled Nd:YAG laser. The laser was tuned and modelocked to 700 nm and used as the two-photon excitation source. The two-photon induced fluorescence was collected by a 60× microscope objective (UPLANSAPO 60×, N.A.=1.35 Olympus). A high transmittance (>95%) short-pass filter (cutoff 685 nm, Semrock) was placed in front of the PMT detector within the FV300 scanhead in order to filter off background radiation from the laser source (700 nm).
2.4. ESA superfluorescence and lasing measurements
The ESA spectra of 1 were obtained in hexane, cyclohexane, toluene, DMSO, ACN, and aqueous mixtures using a pump-probe technique with a picosecond Nd:YAG laser (PL 2143 B Ekspla). The experimental setup is illustrated in Figure 1. A strong pump beam at λex = 355 nm, with pulse duration, τp ≈ 35 ps, (FWHM), pulse energy, Ep ≤ 20 μJ, and repetition rate 10 Hz, was focused into a 1 mm cuvette with dye concentration C ∼ 5·10-5 M, to a waist radius ≈ 1.5 mm.
Figure 1.
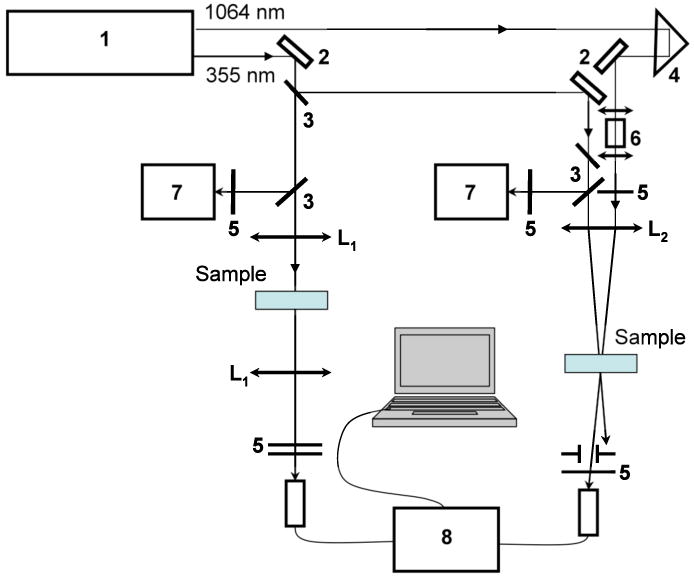
Experimental setups for ESA, superfluorescence and lasing measurements: picosecond laser (1); 100% reflection mirrors (2); beam splitters (3); delay line (4); focusing lens (L1 - 15 cm; L2 - 25 cm); neutral density and color filters (5); water cell (6); silicon detectors (7); spectrometer (8).
A weak pulse of white light continuum (WLC), generated by the main laser output (1064 nm) in a 10 cm path length quartz cuvette with de-ionized water,26 served as the probe beam. The probe and pump beams were linearly polarized in the vertical direction and spatially overlapped inside the sample. A small delay, ∼ 80 ps, was introduced between pump and probe pulses to avoid undesirable interaction. ESA spectra were determined with a Ocean Optics USB-2000 spectrometer. The suprefluorescence and lasing spectra of 1 were measured in hexane, cyclohexane, and polystyrene matrices with dye concentration C ∼ 5·10-3 - 5·10-5 M, under longitudinal pumping at 355 nm (see Fig. 1, left channel) with pulse energy EP ≤ 20 μJ. Liquid solutions of 1 were placed in 0.1, 1.0, and 10 mm quartz cells. Dye-doped polymeric samples were prepared by dissolving polystyrene in a cyclohexane solution containing 1, followed by solvent evaporating over 24 h. The resulting polymer films (thickness < 100 μm) were placed between high optical quality quartz plates. The position of the samples inside the focusing caustic (15 cm lens (Figure 1, L1)) was chosen to reach the highest efficiency of the investigated effects. Measurements were performed with the same USB-2000 spectrometer. It should be mentioned, that laser oscillation was observed in the direction perpendicular to the exit surfaces of the quartz cells and served as a resonator, while superfluorescence emission occurred in the direction of the pumping beam. This allowed us to separate the observed superfluorescence and lasing phenomena.
3. Results and discussion
3.1. Linear spectral properties
Probe 1 was prepared in three steps as shown in Figure 2. Each of the three steps was accomplished by either thermal or microwave-facilitated heating. In each case, the microwave-assisted reaction occurred at significantly shorter times. While the conventaional (thermal) and microwave-assisted reaction yields were the same for the first step, microwave-facilitated reactions provided high yields of product for the latter two steps.
Figure 2.
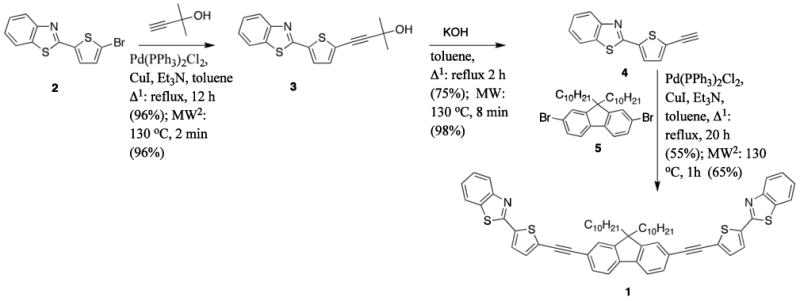
Multistep synthesis of probe 1.
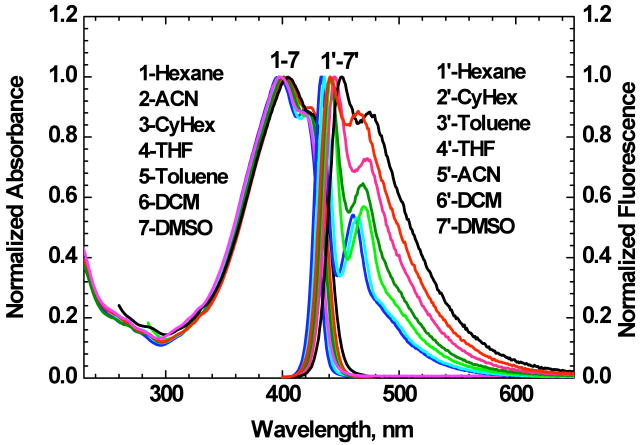
The main linear photophysical and photochemical parameters of new symmetrical fluorene derivative 1 with alkynyl triple bonds in the chromophore system, along with the steady-state absorption and fluorescence spectra in various organic solvents are presented in Table 1 and Figure 3, respectively. The shape of absorption spectra and maximum values of extinction coefficients, ε max, were independent of molecular concentration up to C ≈ 10-2 M, which is indicative of negligible aggregation effects. As can be seen in Figure 3, linear one-photon absorption spectra of 1 in all of the investigated solvents were nearly independent of solvent polarity, Δf, and exhibited relatively high extinction coefficients ε max ∼ 105 M-1 cm-1 in the long wavelength absorption bands. In contrast, the steady-state fluorescence spectra of 1 (Figure 3, curves 1′-7′) exhibited noticeable solvatochromic behavior with relatively strong vibronic structure, even in the polar solvent DMSO. Dramatic changes in the shape of the fluorescence spectra of symmetrical fluorene derivatives with extended π-conjugation are typical for donor-acceptor fluorenes17, 27, 28 and can be explained by symmetry breaking effects occurring in the first excited state, S1, after electronic excitation.29 All fluorescence spectra of 1 were independent of excitation wavelength, λex, and exhibited high fluorescence quantum yield (Φ ∼ 0.7 - 0.8) in all organic solvents. The fluorescence decay curves corresponded to a single-exponential decay process with τ ∼ 0.7 - 0.8 ns (see Table 1), indicative of the relatively fast spontaneous relaxation, with velocity 1/τn = Φ/τ ∼ 109 s-1, where τn is the natural lifetime.20
Table 1.
Major linear photophysical parameters of 1 in different solvents with corresponding polarity Δf and viscosity η: absorption and fluorescence maxima, Stokes shifts, maximum extinction coefficients ε max, quantum yields Φ, fluorescence lifetimes τ and photobleaching quantum yields, ΦPh, under one-photon excitation.
| N/N | Hexane | Cyclohexane | Toluene | THF | DCM | DMSO | ACN | Aqueous mixture* |
|---|---|---|---|---|---|---|---|---|
| Δf | 8·10-5 | 7·10-4 | 0.0135 | 0.209 | 0.217 | 0.263 | 0.305 | 0.321 |
| η, cP | 0.313 | 0.97 | 0.59 | 0.48 | 0.4 | 2.0 | 0.34 | 0.6 |
| , nm | 397 ± 1 | 399 ± 1 | 402 ± 1 | 401 ± 1 | 403 ± 1 | 404 ± 1 | 398 ± 1 | 406 ± 1 |
| , nm | 433 ± 1 | 436 ± 1 | 441 ± 1 | 441 ± 1 | 445 ± 1 | 451 ± 1 | 441 ± 1 | 488 ± 1 |
| Stokes shift, nm | 36 ± 2 | 37 ± 2 | 39 ± 2 | 40 ± 2 | 42 ± 2 | 47 ± 2 | 43 ± 2 | 82 ± 2 |
| εmax ·10-3, M-1·cm-1 | 110 ± 7 | 105 ± 5 | 104 ± 5 | 104 ± 5 | 107 ± 5 | 90 ± 10 | - | 63 ± 10 |
| Φ | 0.81 ± 0.05 | 0.80 ± 0.05 | 0.8 ± 0.05 | 0.77 ± 0.05 | 0.78 ± 0.07 | 0.72 ± 0.05 | 0.76 ± 0.05 | 0.14 ± 0.02 |
| τ, ns | 0.73 ± 0.04 | 0.72 ± 0.04 | 0.70 ± 0.04 | 0.75 ± 0.04 | 0.73 ± 0.05 | 0.80 ± 0.04 | 0.80 ± 0.04 | 0.46±0.05 1.7 ± 0.3 |
| ΦPh·106 | 7.0 ± 1.0 | 3.1 ± 0.6 | 3.2 ± 0.6 | 3.3 ± 0.7 | 35 ± 6 | 5.7 ± 0.9 | - | 45 ± 10 |
Water (95 wt%) and DMSO (5 wt%).
Figure 3.
Normalized one-photon absorption (1-7) and fluorescence (1′-7′) spectra of 1 in organic solvents. Corresponding solvents are listed in the order of increasing wavelength and .
In aqueous solution probe 1 exhibited nearly the same steady-state absorption spectrum as in organic media, with an increased Stokes shift, substantial decrease in fluorescence quantum yield, and bi-exponential fluorescence decay (see Table 1) with the primary short component ≈ 0.46 ns (∼ 95 % amplitude). It should be noted that in an aqueous medium, the shape of fluorescence spectrum of 1 and the value of its quantum yield, Φ, were also independent of λex. The nature of this spectral behavior is not sufficiently clear and will be the subject of further investigation.
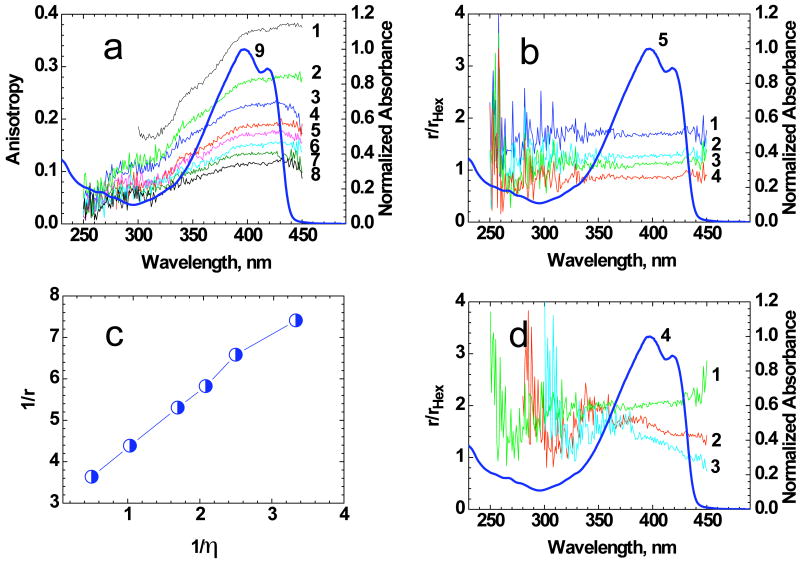
The excitation anisotropy spectra of 1 in organic solvents and in viscous polyTHF (pTHF) are presented in Figure 4. In low viscosity solvents (hexane, toluene, ACN, etc.) the anisotropy values, r, decreased due to rotational movement of the molecule in accordance with r = r0/(1 + τ/θ), where r0 = (3cos2 α−1)/5 is the fundamental anisotropy value (α is the angle between absorption S0 → S1 and emission S1 → S0 transition dipole moments) and θ is the rotational correlation time.20 In viscous pTHF at room temperature the fluorescence lifetime τ ≪ θ (θ =ηV/kT > 10 ns; V is the volume of the molecule, k and T are the Boltzmann constant and absolute temperature, respectively). Therefore, in pTHF excitation anisotropy reached its maximum value r ≈ r0≈ 0.38 (Figure 4a, curve 1), which is close to theoretical limit 0.4, reflecting a nearly parallel orientation of the absorption and emission transition dipoles. In this case, it is possible to determine the mutual dipole orientation for the S0 → S1 and higher excited S0 → Sn (n = 2, 3, …) electronic transitions.
Figure 4.
(a) Excitation anisotropy spectra of 1 in pTHF (1), DMSO (2), cyclohexane (3), toluene (4), THF (5), DCM (6), hexane (7), and ACN (8). (b) Dependences r/rhex =f(λex) for 1 in cyclohexane (1), THF (2), DCM (3), and ACN (4). (c) Dependence for 1 in organic media. (d) Dependences r/rhex =f(λex) for 1 in DMSO (1), toluene (2), and pTHF (3). Normalized one-photon absorption spectrum of 1 in hexane: (a) curve 9; (b) 5, and (d) 4.
Excitation anisotropy spectra provided information regarding the nature of the one-photon absorption bands. From Figure 4a, curve 1, the value of anisotropy was not sufficiently constant in the main long wavelength absorption band (see, for comparison, anisotropy spectra of typical fluorene derivatives28, 30, 31). This suggests that more than one electronic transition with different dipole orientations corresponded to the main absorption band. Following extremes or constant values in the anisotropy spectra in the short wavelength region, the spectral positions of another S0 → Sn absorption band was indicated. Normalization of excitation anisotropy spectra in different organic solvents, r(λex), with respect to the excitation anisotropy spectrum in hexane, rher(λex), are presented Figure 4b and d. Nearly constant values of r/rhex in the spectral range 280 nm ≤ λex ≤ 450 nm (Figure 4b) reflect similar mutual orientations of the corresponding electronic transitions S0 → Sn (n = 1, 2, 3,…) of 1 in hexane, cyclohexane, THF, DCM, and ACN. In contrast, mutual orientation of the electronic transitions in toluene, DMSO, and pTHF (see corresponding functions r/rhex=f(λex) in Fig. 4d) exhibited different types of solvent influence on the electronic structure of 1.
The analysis of the experimental dependence (Figure 4c) revealed good agreement with a theoretical linear function:20
| (3) |
which is indicative of the weak dependence of the fundamental anisotropy r0 on the solvent properties and nearly constant effective rotational molecular volume V in all of the investigated organic solvents. This means that the effective size of the solvate cages in different solvents are sufficiently close and correspond to V ≈ 5000 Å3.
The photochemical stability of probe 1 was investigated by an absorption method24 in the investigated organic solvents and aqueous media, except for ACN, in which a relatively low solubility of 1 was observed. Corresponding values of the photobleaching quantum yields, ΦPh, are presented in Table 1. A high level of photostability (ΦPh ∼ (3 - 7)·10-6) was observed for 1 in all investigated solvents except for electron-accepting DCM and aqueous media. Polar DCM exhibits specific photochemical interaction with fluorene derivatives,32, 33 resulting in a dramatic decrease in their photostability (by ca. one order of magnitude) and efficient formation of nonfluorescent photoproducts in the visible region. The estimations of the photochemical stability of 1 were performed under one-photon excitation conditions, since reactions from the first exited state are nearly independent of the type of excitation (one- or two-photon) for typical fluorene derivatives in organic solvents.24, 32, 33 It should be mentioned that the observed level of photostability of probe 1 is one of the highest among known fluorescent probes used in bioimaging applications.
3.2. 2PA properties of 1 and bioimaging
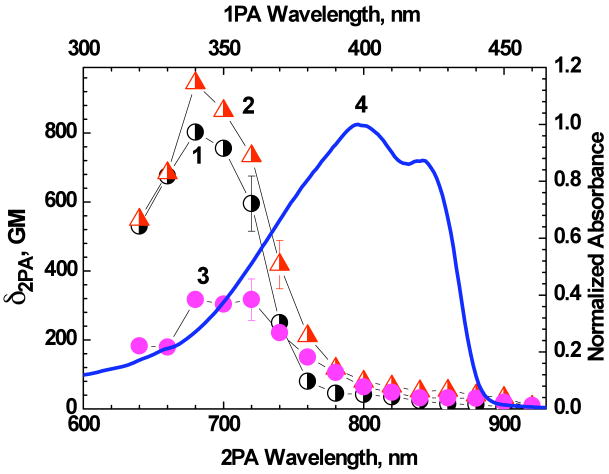
The efficiency of two-photon processes of 1 was investigated in cyclohexane, DMSO, and aqueous solution by a relative 2PF method,9 with the corresponding broad range 2PA spectra presented in Figure 5. The symmetrical probe 1 exhibited one well defined 2PA band at λex ≈ 680-720 nm with maxima cross sections δ2PA∼ 800-900 GM and weak dependence on solvent polarity. The spectral position of this band corresponded to the shoulder at λex ≈ 340-360 nm in the excitation anisotropy spectrum of 1 (Figure 4a, curve 1) and could not be extracted from the linear absorption spectrum (curve 9). Dramatic decrease in the 2PA efficiency in the main one-photon allowed absorption band is typical, consistent with the relatively symmetrical structure of 1. Regardless of the decrease in 2PA efficiency, the values of δ2PA and remain sufficiently high (∼ 50-500 GM) in the main tuning range of Ti:sapphire laser, which is the most convenient excitation source for bioimaging applications. In aqueous solution (95 wt% water and 5 wt% DMSO) probe 1 exhibited decreased 2PA efficiency in the main two-photon allowed absorption band relative to pure DMSO, and nearly the same values of δ2PA in the spectral range λex ≥ 750 nm.
Figure 5.
2PA spectra of 1 in cyclohexane (1), DMSO (2), and aqueous solution (95 wt% water and 5 wt% DMSO) (3). Normalized one-photon absorption spectrum of 1 in cyclohexane (4).
The hydrophobic character of probe 1 made it challenging to attempt delivering the dye directly in a solution that was compatible to the solubility of the cell media. This made it an ideal candidate for encapsulating this dye in a poloxomer micelle. The poloxomer of choice was Pluronic® F-127, an FDA approved triblock copolymer that consists of a propylene oxide portion flanked by two ethylene oxide chains. Pluronic® F-127 has been used in drug delivery applications to enhance the solubility of hydrophobic substances such as anticancer drugs.34, 35 Pluronic micelles are known to be uptaken by MDCK cells by means of clathrin-mediated endocytosis when present above critical micelle concentration (CMC).36 Probe 1 was encapsulated in Pluronic® F-127, with the purpose of it being endocytosed, and subsequently tracked through the vesicle maturation process.
HCT 116 cells were incubated for 3 h in Pluronic® F-127 encapsulated probe 1. A series of 0.1, 1, 10, 25, and 50 μM solutions of the micelle-encapsulated probe in culture media was prepared. These samples were coincubated with 75 nM of Lysotracker™ Red (Invitrogen) for colocalization studies to determine whether the micelle-encapsulated probe reached the lysosomes. After fixation, the one-photon fluorescence images exhibited good agreement between the Lysotracker™ Red (Figure 6b) and the Pluronic® F-127 encapsulated 2PA probe 1 (Figure 6c), as shown by the overlay of micrographs of these two channels (Figure 6d). The excellent colocalization agreement was further confirmed by determining the colocalization coefficient (≅ 0.91).37
Figure 6.
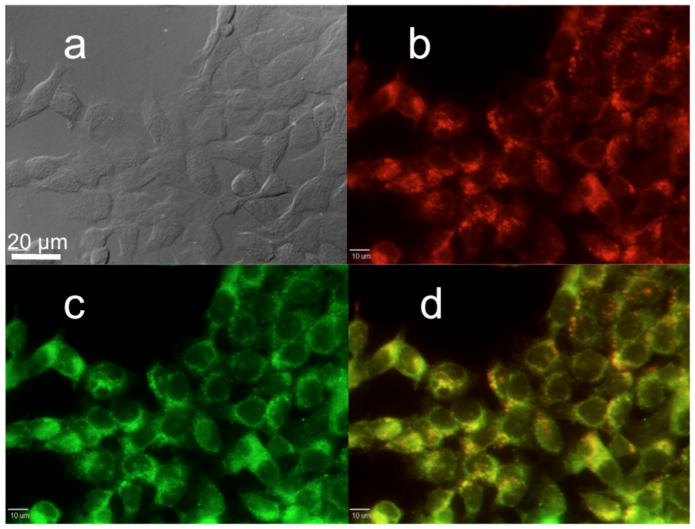
Confocal fluorescence images of HCT 116 cells incubated with probe 1 encapsulated in Pluronic® F-127 (25 μM, 3 h) and Lysotracker™ Red (100 nM, 3 h). (a) differential interference contrast (DIC) image; (b) one-photon fluorescence image showing Lysotracker™ Red; (c) probe 1 encapsulated in Pluronic® F-127 micelles, and (d) colocalization (overlay of b and c).
Two-photon fluorescence microscopy (2PFM) images of fixed HCT 116 cells incubated with probe 1 encapsulated in Pluronic® F-127 (50 μM, 3 h) were collected on a modified Olympus Fluoview FV300 microscope system coupled to a tunable Coherent Mira 900F Ti:sapphire, 76 MHz, modelocked, 200 fs laser tuned to 700 nm (Figure 7c). The 2PFM image, Figure 7c, revealed remarkable contrast when compared to one-photon fluorescence image (Figure 7b), and revealing the potential that this probe-micelle formulation has for following the endocytotic process by 2PFM.
Figure 7.
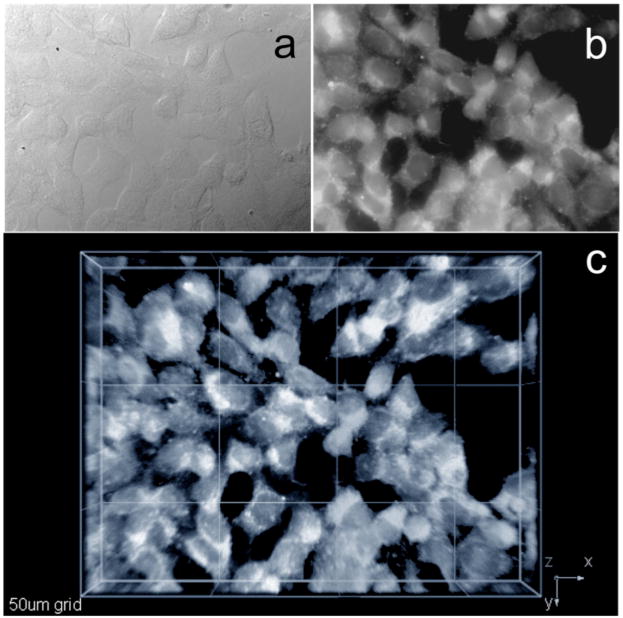
One-and two-photon fluorescence micrographs of HCT 116 cells incubated with probe 1 encapsulated in Pluronic® F-127 (50 μM, 3 h). (a) DIC image; (b) one-photon fluorescence and (c) 3D reconstruction from overlaid 2PFM images, 76 MHz, 200 fs laser, 700 nm, 60× objective (NA= 1.35, Olympus).
3.3. ESA superfluorescence and lasing properties
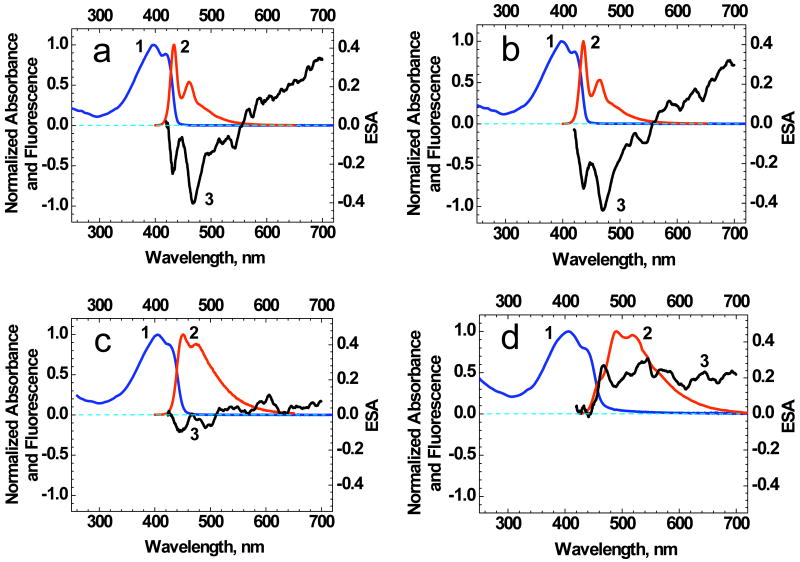
The ESA spectra of 1 (Figure 8) were obtained in the region of its fluorescence (420-700 nm) in order to estimate potential superfluorescence and lasing abilities of this new probe in organic media with different polarity and in aqueous solution. Deduced from the data in Figure 8, potential amplification (i.e. negative values of ESA) was obtained only in nonpolar media (hexane, cyclohexane) in the fluorescence region of 1. In the aqueous mixture, the ESA spectrum was completely positive (Figure 8d) and the existence of small negative regions in ESA spectrum of 1 in DMSO (Figure 8c) was not sufficient to reach real amplification. Therefore, superfluorescence and lasing properties of 1 were investigated in nonpolar media, such as hexane, cyclohexane, and polystyrene films.
Figure 8.
Normalized absorption (1), fluorescence (2), and ESA (3) spectra of 1 in hexane (a), cyclohexane (b), DMSO (c), and aqueous solution (95 wt% water and 5 wt% DMSO) (d).
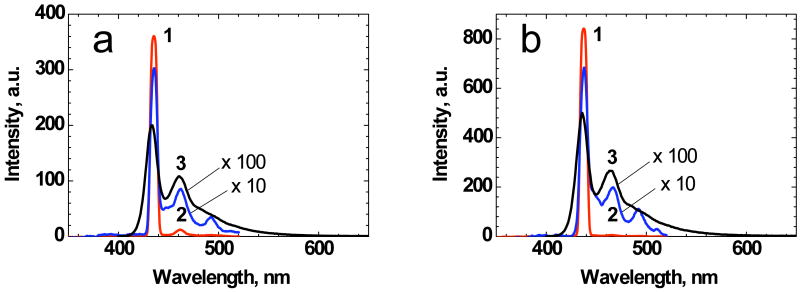
Efficient superfluorescence and lasing effects under longitudinal pumping at 355 nm were observed for 1 in hexane and cyclohexane solutions placed in 10 mm regular spectrofluorometric cuvettes. The corresponding fluorescence and amplified stimulated emission spectra are presented in Figure 9. The lasing spectra of 1 (curves 1) are characterized by spectral width ∼ 8-10 nm (FWHM), which are typical for organic dyes in a nondispersive resonator (consisting of the exit uncoated surfaces of the cuvette).38 Under the experimental conditions, a low resonator quality facilitated simultaneous observation of superfluorescence phenomenon in the pumping direction, which was not completely suppressed by resonator's oscillation.
Figure 9.
Lasing (1), superfluorescence (2), and fluorescence (3) spectra of 1 in hexane (a) and cyclohexane (b) under 355 nm longitudinal pumping in 10 mm quartz cuvettes.
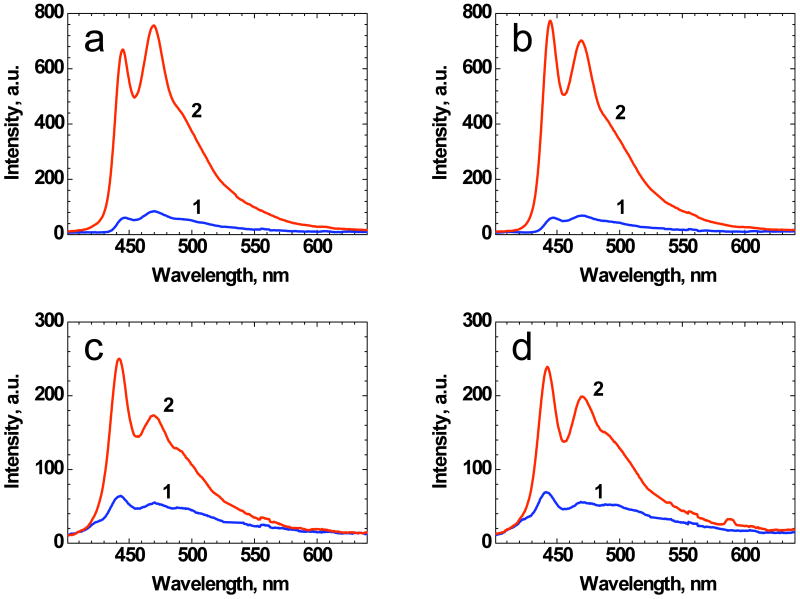
Polystyrene samples with small thickness (< 100 μm) were used in order to check superfluorescence potential of 1 in the case of small length amplification, which may have application in bioimaging if the probe were contained within a hydrophobic medium (such as the micelles above). The superfluorescence spectra of 1 in the polystyrene films with different thicknesses are presented in Figure 10. According to these spectra, even for a 5 μm polymeric layer, some degree of amplification was observed for 1. This suggests that sufficiently high amplification per unit length in nonpolar medium can be utilized for increasing of the spectral brightness of fluorescence labels. These amplification conditions potentially can be realized inside specially constructed micelles with high concentrated solution of 1 and high reflective envelope. The development of such fluorescent labels for bioimaging with increased spectral brightness is currently ongoing in our lab.
Figure 10.
Fluorescence (1) and superfluorescence (2) spectra of 1 in polystyrene films with thicknesses: 85 μm (a), 50 μm (b), 15 μm (c), and 5 μm (d) under 355 nm longitudinal pumping.
4. Conclusions
The synthesis, linear photophysical, and nonlinear optical properties of a new fluorene-based probe 1 with alkynyl bonds in the chromophore system were investigated in organic solvents and aqueous solution as a potential fluorescent label for two-photon bioimaging applications. The shape and maximum extinction coefficients of the absorption spectra of 1 were independent of solvent polarity and no molecular aggregation effects were observed in the range of concentrations up to 10-2 M. The fluorescence spectra of relatively symmetrical probe 1 were independent of λex and exhibited noticeable solvatochromic behavior with substantial changes in their shape. The values of the fluorescence quantum yields were sufficiently high in organic media (Φ ≈ 0.7-0.8) and independent of solvent polarity, while single-exponential fluorescence decays were observed. In contrast, an aqueous solution of 1 exhibited a dramatic decrease in quantum yield accompanied by a bi-exponential decay in fluorescence emission.
The excitation anisotropy spectra revealed a complicated nature of the main long wavelength absorption band of 1, consisting of more than one electronic transition. A weak dependence of the fundamental anisotropy r0 on the solvent properties and nearly constant effective rotational molecular volume V in all investigated organic solvents were shown. Importantly, a high level of photostability (ΦPh ∼ (3 - 7)·10-6) was observed for probe 1 under one-photon excitation conditions in several of the investigated solvents.
The 2PA spectra of 1 were obtained under femtosecond excitation over a broad spectral range (∼ 640-920 nm) by a 2PF method. 2PA efficiency was characterized by the one well defined two-photon allowed absorption band at 680-720 nm with corresponding maxima cross sections δ2PA ≈ 800-900 GM.
The potential that probe 1 has for 2PFM is based on its promising linear and nonlinear photophysical properties, on the excellent contrast obtained with it both in one- and two-photon fluorescence micrographs, and its selectivity to cell lysosomes of HCT 116 cells when encapsulated in Pluronic® F-127. The simplicity of micelle encapsulation and straightforward synthesis make it a probe that can be promptly prepared by the methods described. Furthermore, 2PFM facilitated the observation of cell features that were not entirely resolved in the epifluorescence counterpart. This probe is certainly amenable to other applications in selective imaging of tissue, where further functionalization of the Pluronic® 127 (with a peptide or an antibody for example) could be employed for in vitro or in vivo tissue 2PFM imaging.
The ESA spectra revealed the possibility of potential light amplification in nonpolar solutions of 1. Efficient lasing and superfluorescence effects were shown in hexane, cyclohexane, and polystyrene films under the longitudinal pumping at 355 nm. A possibility for amplification was shown for 1 in thin polymer films up to 5 μm thickness, which can be used for the development of new fluorescent labels with increased spectral brightness. Based on these results, the new probe 1, with its high fluorescence quantum yield, 2PA cross section, photochemical stability, and efficient superfluorescence properties is a promising fluorescent label for two-photon bioimaging applications.
Acknowledgments
We wish to acknowledge the Civilian Research and Development Foundation (UKB2-2923-KV-07), the Ministry of Education and Science of Ukraine (grant M/49-2008), the National Institutes of Health (1 R15 EB008858-01), and the National Science Foundation (ECS-0621715, ECCS-0925712, and CHE-0832622) for partial support of this work.
References
- 1.He GS, Helgeson R, Lin TC, Zheng QD, Wudl F, Prasad PN. IEEE J Quant Electron. 2003;39(8):1003–1008. [Google Scholar]
- 2.Folling J, Belov V, Riedel D, Schonle A, Egner A, Eggeling C, Bossi M, Hell SW. ChemPhysChem. 2008;9(2):321–326. doi: 10.1002/cphc.200700655. [DOI] [PubMed] [Google Scholar]
- 3.Hagen S, Leyssner F, Nandi D, Wolf M, Tegeder P. Chem Phys Lett. 2007;444(1-3):85–90. [Google Scholar]
- 4.Corredor CC, Huang ZL, Belfield KD, Morales AR, Bondar MV. Chem Mater. 2007;19(21):5165–5173. [Google Scholar]
- 5.Denk W, Strickler JH, Webb WW. Science. 1990;248(4951):73–76. doi: 10.1126/science.2321027. [DOI] [PubMed] [Google Scholar]
- 6.Konig K. J Microscopy-Oxford. 2000;200:83–104. doi: 10.1046/j.1365-2818.2000.00738.x. [DOI] [PubMed] [Google Scholar]
- 7.Zipfel WR, Williams RM, Webb WW. Nature Biotech. 2003;21(11):1368–1376. doi: 10.1038/nbt899. [DOI] [PubMed] [Google Scholar]
- 8.Woo HY, Korystov D, Mikhailovsky A, Nguyen TQ, Bazan GC. J Am Chem Soc. 2005;127(40):13794–13795. doi: 10.1021/ja054911q. [DOI] [PubMed] [Google Scholar]
- 9.Albota MA, Xu C, Webb WW. Appl Opt. 1998;37(31):7352–7356. doi: 10.1364/ao.37.007352. [DOI] [PubMed] [Google Scholar]
- 10.Patterson GH, Piston DW. Biophys J. 2000;78(4):2159–2162. doi: 10.1016/S0006-3495(00)76762-2. [DOI] [PMC free article] [PubMed] [Google Scholar]
- 11.Ha-Thi MH, Penhoat M, Drouin D, Blanchard-Desce M, Michelet V, Leray I. Chemistry-Eur J. 2008;14(19):5941–5950. doi: 10.1002/chem.200800084. [DOI] [PubMed] [Google Scholar]
- 12.Yang WJ, Seo MS, Wang XQ, Jeon SJ, Cho BR. J Fluores. 2008;18(2):403–411. doi: 10.1007/s10895-007-0280-3. [DOI] [PubMed] [Google Scholar]
- 13.Meltola NJ, Wahlroos R, Soini AE. J Fluores. 2004;14(5):635–647. doi: 10.1023/b:jofl.0000039350.94256.53. [DOI] [PubMed] [Google Scholar]
- 14.Morales AR, Schafer-Hales KJ, Marcus AI, Belfield KD. Bioconjugate Chem. 2008;19(12):2559–2567. doi: 10.1021/bc800415t. [DOI] [PMC free article] [PubMed] [Google Scholar]
- 15.Hernandez FE, Belfield KD, Cohanoschi I, Balu M, Schafer KJ. Appl Opt. 2004;43(28):5394–5398. doi: 10.1364/ao.43.005394. [DOI] [PubMed] [Google Scholar]
- 16.Schafer-Hales KJ, Belfield KD, Yao S, Frederiksen PK, Hales JM, Kolattukudy PE. J Biomed Opt. 2005;10(5):051402-1–051402-8. doi: 10.1117/1.2104528. [DOI] [PubMed] [Google Scholar]
- 17.Belfield KD, Bondar MV, Yanez CO, Hernandez FE, Przhonska OV. J Phys Chem B. 2009;113(20):7101–7106. doi: 10.1021/jp902060m. [DOI] [PMC free article] [PubMed] [Google Scholar]
- 18.Belfield KD, B MV, Yanez CO, Hernandez FE, Przhonska OV. J Mater Chem. 2009;19:7498–7502. [Google Scholar]
- 19.Andrade CD, Yanez CO, Rodriguez L, Belfield KD. J Org Chem. 2010;75:3975–3982. doi: 10.1021/jo1005075. [DOI] [PMC free article] [PubMed] [Google Scholar]
- 20.Lakowicz JR. Principles of Fluorescence Spectroscopy. Kluwer; New York: 1999. [Google Scholar]
- 21.Zeng DX, Chen Y. J Photochem Photobiol A: Chem. 2007;186(2-3):121–124. [Google Scholar]
- 22.Belfield KD, Yao S, Morales AR, Hales JM, Hagan DJ, Van Stryland EW, Chapela VM, Percino J. Polym Adv Technol. 2005;16(2-3):150–155. [Google Scholar]
- 23.Cory AH, Owen TC, Barltrop JA, Cory JG. Cancer Comm. 1991;3(7):207–212. doi: 10.3727/095535491820873191. [DOI] [PubMed] [Google Scholar]
- 24.Corredor CC, Belfield KD, Bondar MV, Przhonska OV, Yao S. J Photochem Photobiol A: Chem. 2006;184(1-2):105–112. [Google Scholar]
- 25.Makarov NS, Drobizhev M, Rebane A. Opt Exp. 2008;16(6):4029–4047. doi: 10.1364/oe.16.004029. [DOI] [PubMed] [Google Scholar]
- 26.De Boni L, Toro C, Hernandez FE. Opt Exp. 2008;16(2):957–964. doi: 10.1364/oe.16.000957. [DOI] [PubMed] [Google Scholar]
- 27.Bondar MV, Przhonska OV, Yanez CO, Belfield KD. Ukr J Phys. 2009;54(1-2):14–21. [Google Scholar]
- 28.Belfield KD, Bondar MV, Kachkovsky OD, Przhonska OV, Yao S. J Lumin. 2007;126(1):14–20. [Google Scholar]
- 29.Terenziani F, Painelli A, Katan C, Charlot M, Blanchard-Desce M. J Am Chem Soc. 2006;128(49):15742–15755. doi: 10.1021/ja064521j. [DOI] [PubMed] [Google Scholar]
- 30.Belfield KD, Bondar MV, Hales JM, Morales AR, Przhonska OV, Schafer KJ. J Fluores. 2005;15(1):3–11. doi: 10.1007/s10895-005-0207-9. [DOI] [PubMed] [Google Scholar]
- 31.Belfield KD, Bondar MV, Hernandezt FE, Przhonska OV, Yao S. J Phys Chem B. 2007;111(44):12723–12729. doi: 10.1021/jp074456f. [DOI] [PubMed] [Google Scholar]
- 32.Belfield KD, Bondar MV, Przhonska OV, Schafer KJ. Photochem Photobiol Sci. 2004;3(1):138–141. doi: 10.1039/b307426a. [DOI] [PubMed] [Google Scholar]
- 33.Belfield KD, Bondar MV, Przhonska OV, Schafer KJ. J Photochem Photobiol A: Chem. 2004;162(2-3):569–574. doi: 10.1039/b307426a. [DOI] [PubMed] [Google Scholar]
- 34.Batrakova EV, Kabanov AV. J Control Rel. 2008;130(2):98–106. doi: 10.1016/j.jconrel.2008.04.013. [DOI] [PMC free article] [PubMed] [Google Scholar]
- 35.Escobar-Chavez JJ, Lopez-Cervantes M, Naik A, Kalia YN, Quintanar-Guerrero D, Ganem-Quintanar A. J Pharm Pharmaceut Sci. 2006;9(3):339–358. [PubMed] [Google Scholar]
- 36.Sahay G, Batrakova EV, Kabanov AV. Bioconjugate Chem. 2008;19(10):2023–2029. doi: 10.1021/bc8002315. [DOI] [PMC free article] [PubMed] [Google Scholar]
- 37.Manders EMM, Verbeek FJ, Aten JA. J Microscopy-Oxford. 1993;169:375–382. doi: 10.1111/j.1365-2818.1993.tb03313.x. [DOI] [PubMed] [Google Scholar]
- 38.Shafer FP. Dye Lasers. Springer-Verlag; New York: 1973. p. 285. [Google Scholar]


