Abstract
The objective of this study was to determine how an initial fatigue bout (FAT1 at 37°C) affects free myoplasmic Ca2+ concentration and force ([Ca2+]i/force) during a subsequent fatigue bout (FAT2) in mouse flexor digitorum brevis (FDB). During FAT1, both tetanic [Ca2+]i/force decreased; however, they decreased to significantly lower levels when FAT1 was carried out in the presence of glibenclamide, a sarcolemmal KATP (sKATP) channel blocker. Glibenclamide also elicited greater increases in unstimulated [Ca2+]i/force, which occurred when fibres failed to fully relax between contractions during FAT1. Finally, glibenclamide impaired force recovery after FAT1. The decreases in tetanic [Ca2+]i/force and increases in unstimulated [Ca2+]i/force were slower during FAT2 elicited 60 min after FAT1. Under control conditions, the effects were small with very few significant differences. In the presence of glibenclamide, on the other hand, the differences between FAT1 and FAT2 were very large. Unexpectedly, the differences in unstimulated and tetanic [Ca2+]i/force between control and glibenclamide conditions observed during FAT1 were no longer observed during FAT2. The lack of differences was not related to a failure of glibenclamide to block KATP channels during FAT2 because the effects of FAT1 on FAT2 were also observed using Kir6.2−/− mouse FDB, which lack sKATP channel activity. The differences in [Ca2+]i/force between FAT1 and FAT2 could be observed with FAT1 duration of just 30 s and a FAT1–FAT2 interval of at least 30 min. A modulation of factors involved in ischaemic pre-conditioning, i.e. A1-adenosine receptors, sKATP and mitochondrial KATP (mKATP) channels, PKC and reactive oxygen species, during FAT1 had no effect on FAT2 fatigue kinetics. It is concluded that a preceding fatigue bout triggers an acute physiological process that prevents the contractile dysfunction induced by non-functioning KATP channels.
Introduction
Muscle fatigue is defined as a decrease in the capacity of muscle to generate force or do work during repetitive activity. It has been proposed that fatigue is a mechanism that prevents damaging ATP depletion and large increases in free myoplasmic Ca2+ ([Ca2+]i) (McKenna et al. 2008). One major component involved in the aetiology of muscle fatigue is the sarcolemmal ATP-sensitive K+ channel (sKATP channel). Studies that have used mouse knockout models have shown significant fibre damage in muscle lacking the KATP channel following swimming and treadmill exercise (Zingman et al. 2002; Kane et al. 2004; Thabet et al. 2005). The sKATP channel is activated by decreases in intracellular ATP levels and increases in intracellular ADP and H+ and extracellular adenosine (Noma, 1983; Vivaudou et al. 1991; Davies et al. 1992; Barrett-Jolley et al. 1996); thus, the channel behaves as an energy sensor, being activated by decreases in energy metabolism. Being an ion channel, it also links the energy state of the fibre to the electrical activity of the cell membrane. As such, an activation of sKATP channels reduces action potential amplitude, which then results in lowered Ca2+ release from the sarcoplasmic reticulum and force generation by the sarcomere (Matar et al. 2000; Gong et al. 2003). It has been suggested that this mechanism is important in reducing ATP utilization by the contractile machinery to prevent damagingly low ATP levels.
The absence of sKATP channel activity during fatigue also leads to contractile dysfunctions, which are defined as any event from the generation of action potentials to the actin–myosin interaction that is depressed in a manner not associated with the normal process of fatigue (or any metabolic stress), and that eventually incapacitates muscle and prevents the generation of force (Cifelli et al. 2007). The first of these dysfunctions is an excessive cell membrane depolarization to −30 mV as opposed to −60 mV when KATP channels are active. This depolarization leads to further dysfunctions including large Ca2+ influx through L-type Ca2+ channels, excessive increased in [Ca2+]i and Ca2+-induced fibre damage (Cifelli et al. 2007, 2008). The sKATP channel is therefore critical for myoprotection against fibre damage and contractile dysfunctions during acute physiological stress such as exercise and fatigue.
Skeletal muscles are known to respond to repetitive activity and can adapt according to physiological demands. For example, resistance to fatigue increases when skeletal muscles are chronically subjected to a regime of exercises. This type of adaptation involves changes in metabolic enzymes and contractile proteins that occur over several days to weeks (Pette & Vrbová, 1992; Allen et al. 2001). To date, there is no report demonstrating that in vitro fatigue results in an acute adaptive response in skeletal muscle. At 22°C, two successive fatigue bouts separated by a 60 min recovery period produce similar decreases in tetanic [Ca2+]i/force in flexor digitorum brevis (FDB) single muscle fibres (Chin & Allen, 1997). Here we show similar results at 37°C under control conditions. However, we found a very different situation in fibres with non-functioning KATP channels, where an initial fatigue bout produced under control conditions prevented the contractile dysfunction induced by inhibition of KATP channels. We name this new and acute physiological adaptation ‘fatigue pre-conditioning’ (FPC). So, the first objective of this study was to characterize this phenomenon in terms of (i) the duration of the first fatigue bout and (ii) the time interval between the two fatigue bouts necessary to elicit FPC.
The second objective of this study was to determine the intracellular signalling pathway involved with FPC. Short and non-damaging ischaemic periods increase the resistance against fibre damage during a subsequent longer and damaging ischaemic period; this phenomenon is known as ischaemic pre-conditioning (IPC) (Pang & Forrest, 1995). IPC and FPC both involve metabolic stress raising the possibility that factors involved in IPC are also involved in FPC.
The intracellular signalling pathways for IPC have been extensively studied in cardiac muscle (Garlid et al. 2009) and to a lesser extent in skeletal muscle. Briefly, there are several paracrine factors that are released during the pre-conditioning ischaemic period, one of them being adenosine. Among the many factors downstream of the paracrine factors is the activation of PKCɛ, which phosphorylates mitochondrial KATP (mKATP) channels. The phosphorylation activates mKATP channels leading to a small increase in reactive oxygen species (ROS) production. ROS then activate a second inner membrane PKCɛ, which inhibits the mitochondrial permeability transition (MPT) pore, a major component involved in cell death. Opening of the mKATP channels also protects against Ca2+ overload along with mild uncoupling to prevent excessive and deleterious ROS production (Murata et al. 2001). For this study, we tested the hypothesis that adenosine, protein kinase C (PKC), mKATP channels and ROS, four factors involved in IPC, are also involved in FPC.
Methods
Animals, muscle bundle and single fibre preparation
Most experiments were carried out using 2- to 3-month-old wild-type CD1 mice (from Charles River, Canada). In some experiments, Kir6.2−/− mice were used as they are null mice for the gene for Kir6.2, which makes the pore of the sKATP channel, and were generated as previously described (Miki et al. 1998). All mice weighed 20–25 g, were fed ad libitum, and housed according to the guidelines of the Canadian Council for Animal Care (CCAC). The Animal Care Committee of the University of Ottawa approved all experimental procedures used in this study. The authors have also complied with the policies and regulations outlined by The Journal of Physiology (Drummond, 2009). Mice were anaesthetized with a single intraperitoneal injection of 2.2 mg ketamine, 0.44 mg xylazine, and 0.22 mg acepromazine per 10 g of body mass. Flexor digitorum brevis (FDB) muscles were excised from the hind paw and mice were killed with an overdose of anaesthetics.
FDB muscle bundles and single fibres were prepared as described by Cifelli et al. (2007). Briefly, the bundles of fibres controlling the fourth digit were excised by cutting along the lateral fascia separating the muscle fibres of the third and fourth digits. Single fibres were dispersed by trituration after a 4 h collagenase (0.2% type I, Sigma, USA) digestion at 37°C in culture medium containing minimum essential medium (MEM) with Earle's salt and l-glutamine (Gibco, Canada) supplemented with 10% fetal bovine serum (FBS; Gibco, Canada), 100 units ml−1 of penicillin and 100 μg ml−1 of streptomycin (Gibco, Canada).
Solutions
During experiments, FDB bundles and single muscle fibres were constantly immersed in physiological saline solution. The control solution contained (in mm): 118.5 NaCl, 4.7 KCl, 2.4 CaCl2, 3.1 MgCl2, 25 NaHCO3, 2 NaH2PO4, and 5.5 d-glucose. All solutions were continuously bubbled with 95% O2–5% CO2 to maintain a pH of 7.4. Solutions containing glibenclamide (10 μm to block sKATP and mKATP channels) and chelerythrine (1 μm to inhibit PKC) were prepared by first dissolving them in DMSO, which was then added to the saline solution so that the final DMSO concentration was 0.1% (v/v) in all solutions (including control solutions). The A1-adenosine receptor agonist (–)-N6-(2-Phenylisopropyl)adenosine (R-PIA, 100 μm), L-type Ca2+ channel blocker verapamil (1 μm to partially block channels), ROS scavengers N-acetyl-l-cysteine (NAC; 10 mm to scavenge hydroxyl radicals), Tiron (10 mm to scavenge superoxide radicals) and N-2-mercaptoproprionyl glycine (2-MPG; 1 mm), and the mKATP channel blocker 5-hydroxydecanoate (5-HD; 300 μm) were dissolved directly into the saline solution. Muscles were exposed to the drugs for 30 min prior to eliciting the fatigue bouts. Cifelli et al. (2007) have argued that while the FDB temperature in mice at rest is about 32°C, the temperature is expected to exceed 37°C during exercise leading to fatigue. So, all experiments were carried out at 37°C.
Force measurements
Force measurements were carried out using FDB bundles as described by Cifelli et al. (2007). Briefly, tetanic force was monitored with an ergometer (model 300, Cambridge Technology, Lexington, MA, USA) or a force transducer (model UC2, Gould/Statham, USA), and digitized at 5 kHz by an A-D board (model DAS-50, Keithley Metrabyte, Taunton, MA, USA). Tetanic force represented the maximum change in force during tetanic stimulation and was calculated as the difference between the maximum force during the contraction and the force just before the contraction was elicited. Unstimulated force was defined as the force exerted by FDB bundles between contractions when they failed to fully relax and was calculated by averaging the force during the 5 ms immediately preceding a contraction.
[Ca2+]i measurements
[Ca2+]i measurements were carried out using single FDB muscle fibres as described by Cifelli et al. (2007). Briefly, single FDB fibres were loaded with Fura-2 by exposing them for 30 min at 37°C to 5 μm Fura-2AM (Molecular Probes/Invitrogen, Burlington, Ontario Canada). Cover slips containing FDB fibres were installed in a chamber (model RC-25, Warner Instruments, LLC, Hamden, CT, USA), and flow of saline solution was adjusted at 5 ml min−1. [Ca2+]i was monitored prior to fatigue, during fatigue and in the recovery period by illuminating the fibres alternately between 340 and 380 nm and measuring fluorescence at 505 nm using a spectrofluorometer (Model DM3000, Spex Industries, Inc., Edison, NJ, USA). [Ca2+]i could not be calculated for many sKATP channel deficient fibres following the first fatigue bout because they supercontracted and became damaged making it impossible to determine RMIN and RMAX. To be consistent for all fibres, [Ca2+]i was calculated as previously described using average values for RMIN and RMAX measured in the same fibres (Westerblad & Allen, 1991), Briefly, RMIN was determined by exposing fibres to 10 μm BAPTA-AM and RMAX using 1 mm Ca2+ and 10 μm ionomycin. The [Ca2+]i was calculated from the 340/380 fluorescence ratio (R) using the following equation:
where Kd at 37°C was 224 nm (Li et al. 2010), RMIN 89 ± 0.7% (n = 7 fibres) of the resting ratio, RMAX 126.1 ± 7.5% of the maximum tetanic ratio, and β the fluorescence at 380 nm excitation of Ca2+ free divided by Ca2+ bound Fura-2, being 3.17 ± 0.72.
Two parameters are reported in this study. The first is unstimulated [Ca2+]i, which is defined as the [Ca2+]i when fibres are not stimulated. This term was chosen to be consistent with the term unstimulated force. Unstimulated [Ca2+]i was determined by averaging the [Ca2+]i during the 100 ms period preceding a contraction. Tetanic [Ca2+]i was defined as the maximum [Ca2+]i observed during a tetanic contraction and determined by averaging the [Ca2+]i during the tetanic plateau phase.
Stimulation and fatigue protocol
Tetanic contractions were elicited with 200 ms trains of 0.3 ms, 8 V (supramaximal voltage) pulses; stimulation frequencies for bundles and single fibres were respectively 200 and 140 Hz (FDB single fibres were unstable at stimulation frequencies exceeding 140 Hz). Pulses were generated with a Grass S88 stimulator and a Grass SIU5 isolation unit (Grass Technologies/Astro-Med Inc., West Warwick, RI, USA). For FDB bundles, the stimulating platinum wires (4 mm apart) were located on opposite sides of the fibres. For single FDB fibres, the platinum wires (7 mm apart) were positioned on each side of the chamber. All FDB bundles and single fibres were allowed 30 min equilibration before any fatigue bout. During that time, tetanic contractions were elicited every 100 s. All fatigue bouts consisted of one tetanic contraction per second for 180 s (unless specified otherwise). Following each fatigue bout, muscles were stimulated every 100 s to measure [Ca2+]i or force recovery.
Statistical analysis
Data in figures and tables are presented as means ± s.e.m. ANOVA was used to determine significant differences. Split plot designs were used because muscles were tested at all time levels. ANOVA calculations were made using the version 9.2 GLM (General Linear Model) procedures of the Statistical Analysis Software (SAS Institute Inc., Cary, NC, USA). When a main effect or an interaction was significant, the least square difference (LSD) was used to locate the significant differences (Steel & Torrie, 1980). The word ‘significant’ refers only to a statistical difference (P < 0.05).
Results
Tetanic and unstimulated [Ca2+]i
Tetanic [Ca2+]i
Tetanic [Ca2+]i represented the maximum [Ca2+]i that was observed during a tetanic contraction. A total of 11 fibres were fatigued with a first fatigue bout under control conditions (FAT1-Con) and a second fatigue bout under control conditions (FAT2-Con). The mean tetanic [Ca2+]i calculated from all fibres increased from 0.78 to 1.59 μm in 22 s. It then significantly decreased reaching 0.64 μm at 130 s; thereafter, it changed very little (Fig. 1B). During the subsequent recovery period, [Ca2+]i returned to 0.77 μm, a value not significantly different from the mean tetanic [Ca2+]i observed before FAT1. The initial increases in tetanic [Ca2+]i during FAT2-Con were not significantly different from those observed during FAT1-Con. The subsequent decreases in tetanic [Ca2+]i were slightly slower during FAT2-Con compared to FAT1-Con, but only for a very brief period.
Figure 1. The decreases in tetanic [Ca2+]i were slower during a second fatigue bout (FAT2, •) than during a first bout (FAT1, ○) in the presence of glibenclamide.
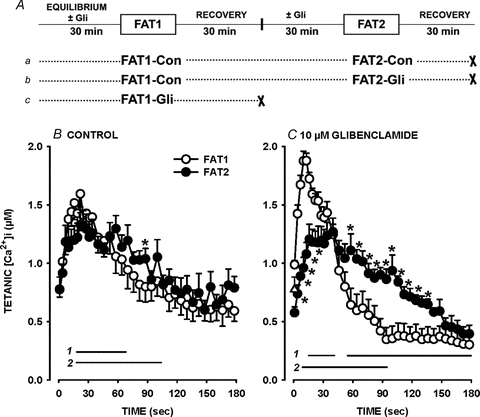
A, fatigue protocols. All fatigue bouts were elicited with one tetanic contraction every second for 3 min. ‘×’ indicates the end of an experiment. B and C, FAT1 and FAT2 were elicited under control conditions (Con) (B) or in the presence of 10 μm glibenclamide (Gli) (C). Tetanic [Ca2+]i is the maximum [Ca2+]i observed during the tetanic contraction. ▵, tetanic [Ca2+]i prior to FAT1-Con that preceded FAT2-Gli. Vertical bars represent the s.e.m. of 11 fibres for all conditions except for FAT1-Gli with 19 fibres. Horizontal bars (with numbers indicating the fatigue bout number) represent the time period when mean tetanic [Ca2+]i was significantly different from the value at time 0 s; *mean values for FAT1 and FAT2 were significantly different. ANOVA and LSD, P < 0.05.
When the first fatigue bout was elicited in the presence of 10 μm glibenclamide (FAT1-Gli; Fig. 1Ac), mean tetanic [Ca2+]i rose from 0.99 to 1.88 μm in 10 s (Fig. 1C). Thereafter, the mean tetanic [Ca2+]i sharply decreased to 0.38 μm by 90 s, which was significantly less than the 0.64 μm observed at the same time during FAT1-Con. Thus, the decreases were much more pronounced during FAT1-Gli than during FAT1-Con. During that time, most fibres (79%) stopped contracting as they were partially or fully supercontracted; a supercontraction was observed when fibres with length varying between 300 and 800 μm shortened to a final length of less than 50 μm with no apparent striations as previously reported by Cifelli et al. (2007), while a partial supercontraction was observed when a portion of the fibre remained intact including the appearance of striation. These partially and fully supercontracted fibres never recovered their initial shape and capacity to contract.
So, to determine the glibenclamide effect during FAT2, 11 fibres were first fatigued under control conditions (FAT1-Con) and allowed to recover 30 min before adding 10 μm glibenclamide. A second fatigue bout in the presence of glibenclamide (FAT2-Gli) was then elicited after another 30 min (Fig. 1Ab). The initial increases and subsequent decreases in mean tetanic [Ca2+]i were both significantly less during FAT2-Gli than during FAT1-Gli (Fig. 1C). Furthermore, mean tetanic [Ca2+]i was not significantly different between FAT2-Con and FAT2-Gli. Finally, contrary to the observations during FAT1-Gli, none of the fibres supercontracted during FAT2-Gli.
Unstimulated [Ca2+]i
The unstimulated [Ca2+]i represented the [Ca2+]i while fibres were not stimulated and was measured 100 ms before a contraction was elicited as defined by Cifelli et al. (2007). During FAT1-Con, mean unstimulated [Ca2+]i increased from 16 nm to 117 nm in about 64 s. It then decreased to 91 nm by 180 s, a value that was still significantly above the pre-fatigue level. At the time the second fatigue bout (FAT2-Con) was elicited, mean unstimulated [Ca2+]i had returned to 28 nm (Time 0 for FAT2-Con in Fig. 2A). Unstimulated [Ca2+]i increased again during FAT2-Con, but the increases between the 50th and 140th second were less when compared to those during FAT1-Con.
Figure 2. Increases in unstimulated [Ca2+]i were less during a second fatigue bout (FAT2) than during a first bout (FAT1) in the presence of glibenclamide.
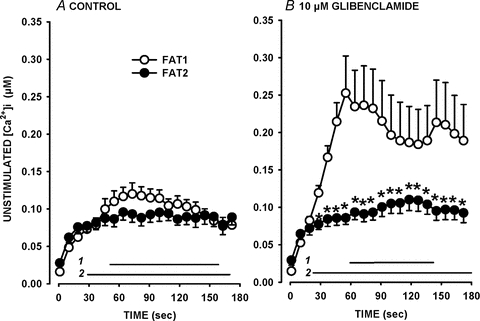
Fatigue protocols were as described in Fig. 1A. FAT1 (○) and FAT2 (•) were elicited under control conditions (Con) (A) or in the presence of 10 μm glibenclamide (Gli) (B). Unstimulated [Ca2+]i is defined as the [Ca2+]i just before a contraction was elicited. Vertical bars represent the s.e.m. of 11 fibres for all conditions except for FAT1-Gli with 19 fibres. Horizontal bars (with numbers indicating the fatigue bout number) represent the time period when mean unstimulated [Ca2+]i was significantly different from the value at time 0 s; *mean values between FAT1 and FAT2 were significantly different. ANOVA and LSD, P < 0.05.
When the first fatigue bout was elicited in the presence of 10 μm glibenclamide (FAT1-Gli), unstimulated [Ca2+]i sharply rose from 15 to 251 nm in 80 s (Fig. 2B). The increase in unstimulated [Ca2+]i was significantly less during FAT2-Gli than during FAT1-Gli. The increases in unstimulated [Ca2+]i during FAT2-Gli were actually similar to those during FAT2-Con. Therefore, increases in unstimulated [Ca2+]i and decreases in tetanic [Ca2+]i were slower during FAT2 elicited 60 min after FAT1, and the differences between the two fatigue bouts were strikingly evident in the presence of glibenclamide.
Tetanic force
The decrease in tetanic force during FAT1-Con occurred predominantly during the first 75 s as it reached 22% of the pre-fatigue force (Fig. 3B). Thereafter, tetanic force decreased very little, being 20% at 180 s. During the subsequent recovery, mean tetanic force returned to 90% of the pre-fatigue tetanic force (Time 0 min for FAT2-Con). During the first 15 s of FAT2-Con, mean tetanic force decreased by 8%, which was less than the 13% observed during FAT1-Con. Thereafter, the decreases in tetanic force were similar between FAT1-Con and FAT2-Con.
Figure 3. Decreases in tetanic force were significantly less during FAT2 than during FAT1 in the presence of 10 μm glibenclamide.
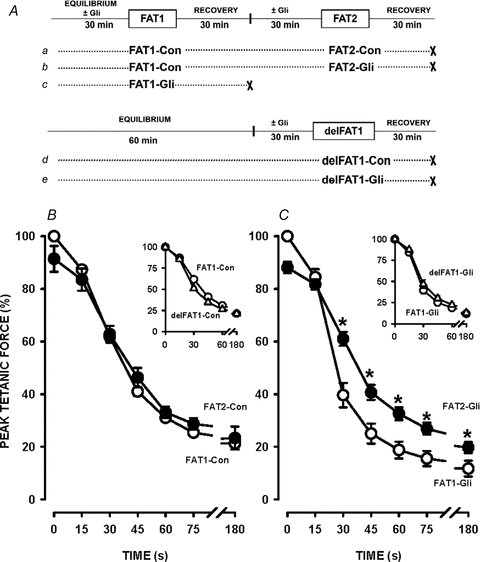
A, fatigue protocols. All fatigue bouts consisted of one tetanic contraction every second for 3 min. ‘×’ indicates the end of an experiment. B and C, FAT1 and FAT2 were elicited under control conditions (Con) (B) or in the presence of glibenclamide (Gli) (C). Tetanic force is expressed as a percentage of the pre-FAT1 tetanic force. Vertical bars represent the s.e.m. of 5 FDB bundles. *Tetanic force significantly different from FAT1, ANOVA and LSD, P < 0.05.
The decreases in tetanic force during FAT1-Gli were greater than during FAT1-Con. For example, at 30 s, tetanic force was 61% during FAT1-Con compared to 40% during FAT1-Gli. Since force recovery was largely incomplete following FAT1-Gli (Fig. 5B), the effects of glibenclamide during FAT2 were tested after FAT1 had been elicited under control conditions (i.e. FAT1-Con, Fig. 3Ab). Decreases in tetanic force during FAT2-Gli were much less than during FAT1-Gli (Fig. 3C). Also, the decreases in force between FAT2-Con and FAT2-Gli were not significantly different, contrary to the differences between FAT1-Con and FAT1-Gli.
Figure 5. Tetanic force recovery was greater following FAT2 than following FAT1 in the presence of 10 μm glibenclamide, but not in control conditions.
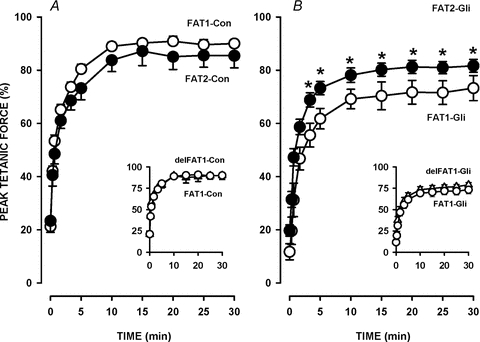
The fatigue protocols were as illustrated in Fig. 2A. FAT1 and FAT2 were elicited under control conditions (A) or in the presence of glibenclamide (B). Tetanic force was expressed as a percentage of the pre-FAT1 force. Vertical bars represent the s.e.m. of 5 FDB bundles. *Unstimulated force significantly different from FAT1, ANOVA and LSD, P < 0.05.
For these experiments, a third fatigue protocol was added in which the first fatigue bout was delayed a full hour (delFAT1), i.e. it was elicited at the same time as FAT2 (Fig. 3Ad and e) to control for possible changes in fatigue kinetics over time. The decreases in tetanic force during FAT1 and delFAT1 were not significantly different under control (Fig. 3B, inset) and glibenclamide conditions (Fig. 3C, inset).
Unstimulated force
Unstimulated force increased during fatigue as muscles failed to fully relax between contractions. During FAT1-Con, unstimulated force reached a maximum of 2% of the pre-fatigue tetanic force within 30 s and changed very little thereafter (Fig. 4A). Unstimulated force was lower during FAT2-Con, but only one time point was statistically different compared to FAT1. Glibenclamide-exposed FDB generated significantly more unstimulated force reaching 22% at 30 s during FAT1-Gli (Fig. 4B). However, there was no drastic increase in unstimulated force during FAT2-Gli. Unstimulated force increased progressively, but remained below 5% throughout the fatigue period, compared to 16% for FAT1-Gli. The increases in unstimulated force during delFAT1 were comparable to those observed during FAT1 for both control (Fig. 4B inset) and glibenclamide (Fig. 4B inset) conditions.
Figure 4. Increases in unstimulated force were significantly less during FAT2 than during FAT1 in the presence of 10 μm glibenclamide.
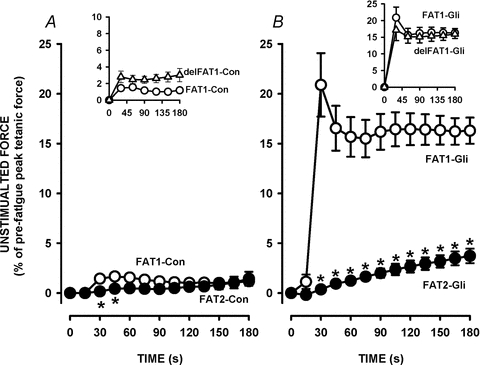
The fatigue protocols were as illustrated in Fig. 2A. FAT1 and FAT2 were elicited under control conditions (A) or in the presence of glibenclamide (B). Unstimulated force is expressed as a percentage of the pre-FAT1 tetanic force. Vertical bars represent the s.e.m. of 5 FDB bundles. *Unstimulated force significantly different from FAT1, ANOVA and LSD, P < 0.05.
Recovery of tetanic force
The recovery of tetanic force following FAT1 and delFAT1 under control conditions followed a similar time course where mean tetanic force reached a final value of 90–94% by 15 min (Fig. 5A). Mean tetanic force 30 min after FAT2-Con was 85% of pre-FAT1 force. Considering that at the beginning of FAT2-Con, mean tetanic force was 90%, this represented a 5% loss in force.
Tetanic forces after 30 min of recovery following FAT1 or delFAT1 in the presence of 10 μm glibenclamide were respectively 73% and 79% (Fig. 5B inset), values that were significantly less than those observed in control conditions. Interestingly, mean tetanic force 30 min after FAT2-Gli was 83%, a value not significantly different from the value observed after FAT2-Con. Thus, the presence of glibenclamide during FAT2 did not result in any further loss of force as it did during FAT1.
Thus, following a first bout of fatigue under control conditions (FAT1-Con), the decreases in tetanic [Ca2+]i were slower while the increases in unstimulated [Ca2+]i and force were less during a second bout of fatigue (FAT2), especially in the presence of glibenclamide. This suggests that a first bout of fatigue resulted in an acute increase in fatigue resistance and a decreased dependency on KATP channels to prevent contractile dysfunction.
Effects of FAT1 duration
Subsequently, we determined how long FAT1-Con must be in order to observe the FPC effects. Considering that the largest differences between FAT1 and FAT2 were in the presence of glibenclamide, the protocol here was to elicit FAT1 under control conditions with durations varying between 30 and 180 s, and FAT2 in the presence of 10 μm glibenclamide (using different FDB bundles for each FAT1 time period).
The decrease in mean tetanic force during FAT2-Gli became significantly less when FAT1-Con was just 30 s (Fig. 6A). At 30 s during FAT1-Gli (when there is no FPC), mean tetanic force was 40% of pre-fatigue force (mean at time 0 in Fig. 6A), while force was 45% during FAT2-Gli preceded by a 30 s FAT1-Con. After 60, 90 and 180 s long FAT1-Con, mean tetanic forces at 30 s during FAT2-Gli were 49%, 56% and 70%, respectively. Tetanic force at 60 s of FAT2-Gli increased from 16% to 37% as the duration of FAT1 was increased from 0 to 180 s.
Figure 6. A fatigue bout of just 30 s under control conditions (i.e. FAT1-Con) was sufficient to significantly trigger FPC.
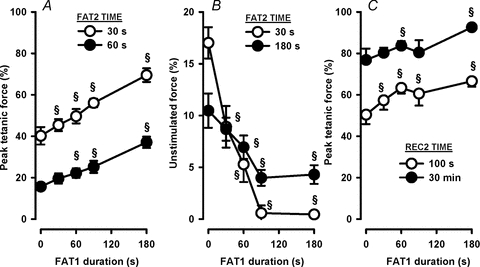
All FAT1 were elicited under control conditions with durations between 30 and 180 s. All FAT2 were elicited 60 min following FAT1 in the presence of 10 μm glibenclamide added 30 min prior to FAT2. Data are tetanic force at 30 and 60 s during FAT2 (A), unstimulated force at 30 and 180 s during FAT2 (B), and tetanic force after 100 s and 30 min of recovery following FAT2 (i.e. REC2) (C). The only exceptions are the data at 0 s FAT1 duration, which are from FAT1-Gli of Figs 2–4, i.e. when FPC is not triggered. All forces are expressed as a percentage of the pre-FAT1 tetanic force. Vertical bars represent the s.e.m. of 5 muscles. §Significantly different from 0 s, ANOVA and LSD, P < 0.05.
Unstimulated force at 30 s of FAT2-Gli was significantly reduced when the duration of FAT1-Con was 30–60 s, and was 0% at 90 s or longer (Fig. 6B). The unstimulated force at 180 s was also reduced when FAT1-Con duration was increased from 0 to 90 s. However, unstimulated force did not decrease further with a prolongation of FAT1-Con between 90 and 180 s. Recovery of tetanic force following FAT2-Gli also improved as the duration of FAT1-Con increased from 0 to 180 s (Fig. 6C). Thus, it appears that FPC is triggered with only a 30 s long fatigue bout with gradual increases in the extent of the phenomenon from 30 to 180 s.
Effects of the time interval between FAT1 and FAT2
We then determined the time interval between FAT1-Con and FAT2-Gli that maximizes the FPC effects. Here, FAT2-Gli was elicited between 15 min and 3 h after FAT1-Con. To ensure the differences between FAT1-Con and FAT2-Gli were not time dependent, paired FDB bundles were used in which delFAT1-Gli was elicited with one bundle at the same time as FAT2-Gli with another bundle.
When FAT2-Gli was elicited 15 min after FAT1-Con, mean tetanic force at 30 s was 44% of pre-fatigue force during both FAT2-Gli and delFAT1-Gli (Fig. 7A). When the interval was increased to 30 min, a significant difference of 9% was observed as the tetanic force during delFAT1-Gli was 39% compared to 48% during FAT2-Gli. The difference increased to 26% with a time interval of 1 h. At 2 and 3 h intervals, the mean force was not significantly different between FAT2-Gli and delFAT1-Gli. For unstimulated force, a large and significant difference was observed with a 30 min interval lasting for periods as long as 2 h (Fig. 7B). It thus appeared that FPC requires 15–30 min after a first 180 s fatigue bout to manifest itself and it lasted 2–3 h.
Figure 7. At least 30 min is required between FAT1 and FAT2 to trigger FPC.
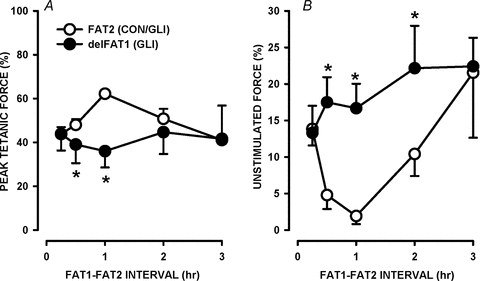
All fatigue bouts consisted of one tetanic contraction every second for 3 min. Paired FDB bundles were used. For one bundle, FAT1 was elicited under control conditions (data not shown for clarity). FAT2 was then elicited in the presence of 10 μm glibenclamide at different times following FAT1 as indicated. For the paired muscle, delFAT1 was elicited at the same time as FAT2. Glibenclamide was added 30 min prior to FAT2, except for the time interval of 15 min when glibenclamide was added 15 min before FAT2 or delFAT1. tetanic force and unstimulated force at 30 s during FAT2 are expressed as a percentage of the pre-FAT1 tetanic force. Vertical bars represent the s.e.m. of 5 muscles. *Tetanic forces or unstimulated forces were significantly different between FAT2-Gli and delFAT1-Gli, ANOVA and LSD, P < 0.05.
Mechanism of FPC
The lack of glibenclamide effects during FAT2 may either be because KATP channels are no longer necessary to prevent contractile dysfunction or because glibenclamide no longer blocks KATP channels, as has been reported during prolonged ischaemia in heart (Findlay, 1993). Furthermore, IPC is a well characterized response to short ischaemic periods that helps cells sustain prolonged and damaging ischaemia. Considering that ischaemia and fatigue impose a metabolic stress, we hypothesized that some of the factors involved in cardiac and skeletal muscle IPC are similarly involved in FPC. We therefore tested the possible role of the sKATP channel, mKATP channel, adenosine receptor, PKC and ROS in FPC.
Sarcolemmal KATP channel
To test whether glibenclamide failed to block sKATP channels during FAT2 and whether these channels are important in FPC, we used FDB bundles from Kir6.2−/− mice. As observed with glibenclamide-exposed wild-type FDB, Kir6.2−/− FDB generated a large amount of unstimulated force during fatigue (Fig. 8C) and had a lower capacity for force recovery following fatigue (data not shown) possibly due to excessive increases in unstimulated [Ca2+]i (Cifelli et al. 2007, 2008). These contractile dysfunctions are prevented when Kir6.2−/− FDB is fatigued in the presence of 1 μm verapamil to partially block L-type Ca2+ channels (Cifelli et al. 2008). Consequently, in this study, the second fatigue bout (FAT2-Con) was elicited following the first fatigue bout in the presence of verapamil (FAT1-Ver, Fig. 8Ab). The fatigue kinetics of FAT2-Con were compared with those of a first fatigue bout elicited under control conditions, either when FAT1 (FAT1-Con, Fig. 8Aa) or FAT2 (delFAT1, Fig. 8Ac) was elicited.
Figure 8. In Kir6.2−/− FDB, decreases in tetanic force and increases in unstimulated force were less during FAT2 than during FAT1.
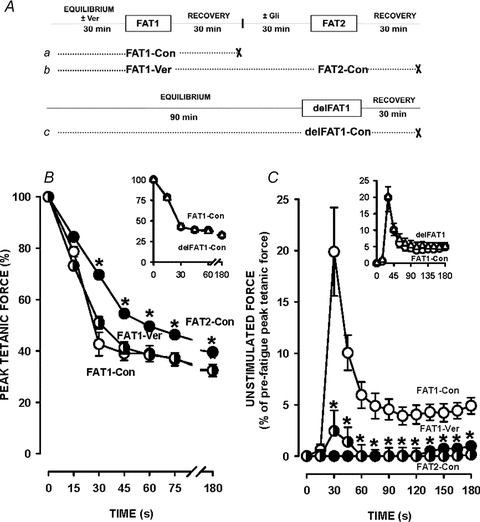
A, fatigue protocols. All fatigue bouts were elicited with one tetanic contraction every second for 3 min. ‘×’ indicates the end of an experiment. FAT1 and FAT2 were elicited under control conditions (Con) or in the presence of 1 μm verapamil (Ver) added 30 min prior to and removed immediately after FAT1-Ver. B and C, tetanic force(B) and, unstimulated force (C) are expressed as a percentage of the pre-FAT1 tetanic force. Vertical bars represent the s.e.m. of 5 FDB bundles. *Tetanic force and unstimulated force significantly different from FAT1, ANOVA and LSD, P < 0.05.
The decreases in tetanic force during FAT1-Con and FAT1-Ver were similar apart from a slight difference at 30 s (Fig. 8A), while the decreases during FAT2-Con were significantly less. As expected, the large 20% increase in unstimulated force during FAT1-Con was almost abolished by verapamil (Fig. 8C). Following FAT1-Ver, Kir6.2−/− FDB did not generate any unstimulated force during FAT2-Con. Finally, there was also no difference in the decrease in tetanic force and unstimulated force between FAT1-Con and delFAT1-Con (Fig. 8, insets).
Mitochondrial KATP channel
Next we tested whether mKATP channels are involved in FPC by testing the effect of 5-hydroxydecanoate (5-HD), a known inhibitor of this channel. For these experiments, FDB bundles were used in pairs. For both bundles, FAT2 was elicited in the presence of 10 μm glibenclamide while for FAT1 one muscle was under control conditions (FAT1-Con, Fig. 9Aa) while the other was in the presence of 100 μm 5-HD (FAT1-5-HD, Fig. 9Ab). 5-HD had no effect on the decreases in tetanic force and unstimulated force during FAT1 (Fig. 9B and C). More importantly, the smaller decreases in tetanic force and increases in unstimulated force during FAT2-Gli were not prevented by the presence of 5-HD during FAT1.
Figure 9. Blocking mKATP channels with 5-HD during FAT1 did not prevent FPC.
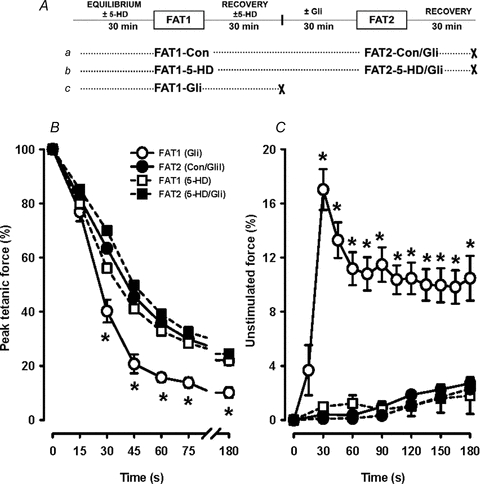
A, fatigue protocol. Paired FDB bundles were used. For one bundle (protocol a), FAT1 was elicited in control conditions (FAT1-Con) and FAT2 in the presence of 10 μm glibenclamide (FAT2-Con/Gli). For the paired bundle (protocol b), FAT1 was elicited in the presence of 300 μm 5-HD (FAT1-5-HD) and FAT2 in the absence of 5-HD but in the presence of 10 μm glibenclamide (FAT2-5-HD/Gli). 5-HD was added 30 min prior to FAT1 and removed 30 min after FAT1. B and C, tetanic force (B) and unstimulated force (C) are expressed as a percentage of the pre-FAT1 tetanic force. Data for FAT1-Con are not shown for clarity. Data for FAT1-Gli of Fig. 2A are shown for comparison. Vertical bars represent the s.e.m. of 5 FDB bundles. *Tetanic force and unstimulated force significantly different from FAT2, ANOVA and LSD, P < 0.05.
Adenosine receptor
Replacing FAT1-Con by an exposure to 100 μm R-PIA, an A1-adenosine receptor agonist, for 60 min did not induce FPC (Table 1). That is, FDB bundles had 35% less tetanic force and generated 24% more unstimulated force at 30 s during FAT2-Gli preceded by the R-PIA exposure than by FAT1-Con.
Table 1.
FPC was not affected by modulators of adenosine receptor, protein kinase C modulators and by ROS scavengers
| Fatigue conditions | Tetanic force (%) | Unstimulated force (%) | |||
|---|---|---|---|---|---|
| FAT1 | FAT2 | FAT1 | FAT2 | FAT1 | FAT2 |
| A. Control | Gli | 58.9 ± 0.6 | 63.4 ± 0.8 | 0.05 ± 0.33 | 0.40 ± 0.60 |
| B. 10 μm Gli | — | 40.2 ± 4.2§ | — | 17.0 ± 1.5§ | — |
| C. 1 μm R-PIA | Gli | — | −35.1 ± 11.3* | — | 24.67 ± 10.44* |
| 1 μm Chel | Gli | −5.2 ± 11.7 | −8.3 ± 5.7 | 2.06 ± 3.69 | 0.86 ± 2.16 |
| 1 mm 2-MPG | Gli | 0.6 ± 4.3 | −0.8 ± 4.2 | 0.61 ± 4.25 | 0.77 ± 4.14 |
| 10 mm NAC | Gli | 1.1 ± 4.0 | −0.7 ± 10.0 | 1.59 ± 1.24 | 0.21 ± 0.75 |
| 10 mm Tiron | Gli | −1.6 ± 9.2 | −4.0 ± 5.7 | 0.35 ± 0.84 | −0.27 ± 1.13 |
Fatigue protocols, using paired muscles, were as in Fig. 9, apart from (a) 5-HD during FAT1 was replaced by the modulators shown in the table and (b) in the case of R-PIA, FAT1 was not elicited but the muscle was exposed to R-PIA for 1 h and removed 30 min prior to FAT2. In A and B, tetanic force and unstimulated force at 30 s during the fatigue bout are expressed as a percentage of the pre-FAT1 force. In C, for each paired FDB, the percentage tetanic force and unstimulated force at 30 s during FAT1 of protocol Fig. 9Ab was subtracted from the values during FAT1 of protocol Fig. 9Aa. The same calculations were done for FAT2. So, a difference close to zero signifies that the modulators had no effect during FAT1 or FAT2. In the case of FAT2 it also means that FPC was observed.
Significantly different from FAT1-Con.
Significant differences between paired muscles, ANOVA and LSD P < 0.05. Chel, chelerythrine; 2-MPG, N-(2-mercaptopropionyl)glycine; NAC, N-acetyl-l-cysteine.
PKC and ROS
Eliciting FAT1 in the presence of 1 μm chelerythrine to inhibit PKC, or in the presence of three different ROS scavengers, 1 mmN-(2-mercaptopropionyl)glycine (2-MPG), 10 mmN-acetyl-l-cysteine (NAC) or tiron, did not prevent the occurrence of FPC (Table 1), i.e. FDB bundles had similar tetanic force and unstimulated force at 30 s during FAT2-Gli whether FAT1 was elicited in control conditions or in the presence of these compounds.
Discussion
During an initial fatigue bout (i.e. FAT1), the decreases in tetanic [Ca2+]i/force and the increases in unstimulated [Ca2+]i/force were much less in control FDB than in KATP channel deficient FDB, i.e. Kir6.2−/− and glibenclamide-exposed wild-type FDB. Furthermore, KATP channel deficient FDB recovered less force following FAT1 than control FDB. Finally, Kir6.2−/− FDB developed significantly less unstimulated force during FAT1 in the presence of 1 μm verapamil. All these results are in agreement with those previously reported by Cifelli et al. (2007, 2008) and will thus not be further discussed here.
This study reports for the first time a novel phenomenon, named fatigue pre-conditioning (FPC), in which the changes in tetanic [Ca2+]i/force and unstimulated [Ca2+]i/force were in most cases different between two successive fatigue bouts. Under control conditions, the differences between FAT1 and FAT2 were very small with very few significant differences at the level of a muscle bundle (force) or when the tetanic [Ca2+]i of all tested single fibres were averaged. Contrary to the situation under control conditions, the differences between FAT1 and FAT2 were most striking for all parameters in the presence of glibenclamide used to block KATP channels. Furthermore, while the lack of KATP channel activity caused major contractile dysfunctions during FAT1, it did not do so during FAT2. Finally, there were many significant differences between FAT1-Con and FAT1-Gli, whereas there was none between FAT2-Con and FAT2-Gli. So, FPC reduces the dependency of FDB on KATP channels to prevent contractile dysfunctions.
It is interesting to note that [Ca2+]i was measured in single fibres that were allowed to shorten while being completely surrounded by physiological solution. Tetanic force, on the other hand, was measured under isometric conditions from FDB bundles for which many fibres were not surrounded by physiological solution. Thus, the metabolic demand is expected to be different between the two preparations even when using the same fatigue protocol. The difference in metabolic demand prevents us from directly comparing the changes in [Ca2+]i and force. However, at the whole muscle level, when FPC was clearly observed (glibenclamide conditions) and when it was barely observed (control conditions), it was the same for both [Ca2+]i and force. This thus suggests that FPC can be triggered by different metabolic stresses.
When FAT1 was elicited in the presence of verapamil to prevent the development of contractile dysfunctions in Kir6.2−/− FDB bundles, FPC was still observed as muscle bundles did not develop the large unstimulated force during FAT2-Con seen during FAT1-Con. This result therefore suggests that the lack of contractile dysfunctions during FAT2-Gli in wild-type FDB is not due to a loss of glibenclamide efficiency to block KATP channels. Finally, it is unlikely that the differences in fatigue kinetics between FAT1 and FAT2 were due to prolonged in vitro incubation because delaying FAT1 in the presence of glibenclamide, so it is elicited at the same time as FAT2, gave rise to similar and a very large amount of unstimulated force when compared to FAT1-Gli elicited at the beginning of an experiment.
Thus, our results give strong evidence for an acute physiological process at 37°C, triggered after one fatigue bout that gives rise to an increased fatigue resistance and a decreased dependency on KATP channels to prevent contractile dysfunctions. We have called this phenomenon ‘fatigue pre-conditioning’ (FPC).
Time characteristic of FPC
The capacity for generating FPC was a function of FAT1 duration. A fatigue bout as short as 30 s was enough to trigger FPC. In regard to unstimulated force, it appears as if a maximum effect occurs when FAT1 duration reaches 90 s as there is no further decrease in unstimulated force for FAT1 duration from 90 to 180 s. However, tetanic force at 30 s during FAT2-Gli increased linearly with FAT1 duration from 30 to 180 s, and the same was observed for force recovery. Thus, FPC can be triggered with FAT1 being as short as 30 s and increases in amplitude for durations up to 180 s.
FPC did not appear immediately after the first fatigue bout as an interval of 15 min between FAT1 and FAT2 gave no evidence of FPC. At least 30 min following FAT1 is required to observe FPC. Interestingly, the maximum effect of FPC requires different time intervals between FAT1 and FAT2 for tetanic force and unstimulated force. For tetanic force, a small effect was observed after 30 min, while the maximum effect occurred after 1 h. For unstimulated force, a near maximal effect was observed after 30 min as there were only minor differences between the 30 and 60 min interval. Furthermore, the duration of FPC was different for the two parameters. For tetanic force, the effects of FPC were no longer observed after 2 h while it was still large for unstimulated force. It is not possible from our data to explain why differences exist between the two parameters. The decrease in force during fatigue is largely dependent on the decrease in Ca2+ release (Chin & Allen, 1997) while the increases in unstimulated [Ca2+]i/force in KATP channel deficient fibres are related to a large membrane depolarization that activates L-type Ca2+ channels (Cifelli et al. 2008). It therefore appears that FPC differentially affects Ca2+ release and the depolarization-induced activation of L-type Ca2+ channels.
Mechanism of FPC is different from IPC
Short bouts of ischaemia are known to increase the capacity of both cardiac and skeletal muscle to survive long and damaging ischaemic periods, a phenomenon known as ischaemic pre-conditioning or IPC (Pang & Forrest, 1995). As discussed by Cifelli et al. (2007), an anoxic core during fatigue at 37°C is expected to occur in small FDB bundles according to Barclay's modelling of O2 supply in isolated muscles (Barclay, 2005). It was therefore thought that the mechanisms responsible for IPC are also involved in FPC. One piece of evidence against this possibility is the fact that FPC is observed in single FDB muscle fibres for which a hypoxic core is not expected.
It is nevertheless possible that FPC and IPC share a common mechanism as they both involve metabolic stress. A1-adenosine receptors, sKATP and mKATP channels, PKC and ROS, have all been shown to play an important role in triggering IPC in skeletal muscle (Pang & Forrest, 1995; Murata et al. 2001; Garlid et al. 2009). However, activating A1-adenosine receptors with R-PIA for 1 h did not induce FPC and the production of fatigue in Kir6.2−/− FDB bundles in the presence of verapamil during FAT1 still did not result in a large amount of unstimulated force during FAT2-Con. Since Kir6.2−/− FDB are incapable of forming the pore of the KATP channel, our results suggest that this channel is not involved. Inhibiting mKATP channels with 5-HD and PKC with chelerythrine also failed to prevent FPC. Finally, FPC is still observed when FDB are exposed to three different ROS scavengers to lower ROS levels during FAT1.
Therefore, our results show that the mechanism and intracellular pathway for FPC is different from that for IPC, i.e. FPC and IPC are clearly two different phenomena. Perhaps the difference comes from the capacity of generating ATP. During fatigue, ATP production is not necessarily impaired as during ischaemia. Consequently, FPC may involve an improvement in ATP generation, a mechanism that would be different from IPC. It is also possible that FPC involves an improved efficiency in ATP utilization by the different ATPases. Together these mechanisms may improve the energy state of muscle fibres during FAT2 and consequently lower the need for KATP channels.
In conclusion, this study reports for the first time that FDB muscles have the capacity to acutely respond to a muscular activity so that inhibition of KATP channels no longer results in contractile dysfunctions. This novel phenomenon, called fatigue preconditioning, appears to be controlled by an intracellular signalling pathway that is very different from the pathway regulating ischaemic pre-conditioning.
Acknowledgments
This study was supported by a grant from the National Science and Engineering Research Council (NSERC) to J-M.R. The authors are grateful to Dr W. Staines for reading the manuscript.
Glossary
Abbreviations
- FAT1
first fatigue bout
- FAT2
second fatigue bout
- FDB
flexor digitorum brevis
- FPC
fatigue pre-conditioning
- IPC
ischaemic pre-conditioning
- ROS
reactive oxygen species
Author contributions
L.B.: FAT1 duration to elicit FPC and all experiments involving intracellular signalling pathways; C.C.: initial measurements of tetanic force during FAT1 and FAT2 under control and glibenclamide conditions; F.B.: measurements and discovery of the FPC phenomenon; K.S.: time interval between fatigue bout to elicit FPC; J-M.R. was the principal investigator. All co-authors contributed to the final writing of the manuscript.
References
- Allen DL, Harrison BC, Maass A, Bell ML, Byrnes WC, Leinwand LA. Cardiac and skeletal muscle adaptations to voluntary wheel running in the mouse. J Appl Physiol. 2001;90:1900–1908. doi: 10.1152/jappl.2001.90.5.1900. [DOI] [PubMed] [Google Scholar]
- Barclay CJ. Modeling diffusive O2 supply to isolated preparations of mammalian skeletal and cardiac muscle. J Muscle Res Cell Motil. 2005;26:225–235. doi: 10.1007/s10974-005-9013-x. [DOI] [PubMed] [Google Scholar]
- Barrett-Jolley R, Comtois A, Davies NW, Stanfield PR, Standen NB. Effect of adenosine and intracellular GTP on KATP channels of mammalian skeletal muscle. J Membr Biol. 1996;152:111–116. doi: 10.1007/s002329900090. [DOI] [PubMed] [Google Scholar]
- Chin ER, Allen DG. Effects of reduced muscle glycogen concentration on force, Ca2+ release and contractile protein function in intact mouse skeletal muscle. J Physiol. 1997;498:17–29. doi: 10.1113/jphysiol.1997.sp021838. [DOI] [PMC free article] [PubMed] [Google Scholar]
- Cifelli C, Boudreault L, Gong B, Bercier JP, Renaud JM. Contractile dysfunctions in KATP channel deficient mouse FDB during fatigue involve Ca2+ influx through L-type Ca2+ channels. Exp Physiol. 2008;93:1126–1138. doi: 10.1113/expphysiol.2008.042572. [DOI] [PubMed] [Google Scholar]
- Cifelli C, Bourassa F, Gariépy L, Banas K, Benkhalti M, Renaud JM. KATP channel deficiency in mouse FDB causes fibre damage and impairs Ca2+ release and force development during fatigue in vitro. J Physiol. 2007;582:843–857. doi: 10.1113/jphysiol.2007.130955. [DOI] [PMC free article] [PubMed] [Google Scholar]
- Davies NW, Standen NB, Stanfield PR. The effect of intracellular pH on ATP-dependent potassium channels of frog skeletal muscle. J Physiol. 1992;445:549–568. doi: 10.1113/jphysiol.1992.sp018939. [DOI] [PMC free article] [PubMed] [Google Scholar]
- Drummond GB. Reporting ethical matters in The Journal of Physiology: standards and advice. J Physiol. 2009;587:713–719. doi: 10.1113/jphysiol.2008.167387. [DOI] [PMC free article] [PubMed] [Google Scholar]
- Findlay I. Sulphonylurea drugs no longer inhibit ATP-sensitive K+ channels during metabolic stress in cardiac muscle. J Pharmacol Exp Ther. 1993;266:456–467. [PubMed] [Google Scholar]
- Garlid KD, Costa AD, Quinlan CL, Pierrre SV, Santos PD. Cardioprotective signaling to mitochondria. J Mol Cell Cardiol. 2009;46:858–859. doi: 10.1016/j.yjmcc.2008.11.019. [DOI] [PMC free article] [PubMed] [Google Scholar]
- Gong B, Legault D, Miki T, Seino S, Renaud JM. KATP channels depress force by reducing action potential amplitude in mouse EDL and soleus. Am J Physiol Cell Physiol. 2003;285:C1464–C1474. doi: 10.1152/ajpcell.00278.2003. [DOI] [PubMed] [Google Scholar]
- Kane GC, Behfar A, Yamada S, Perez-Terzic C, O’Cochlain F, Reyes S, Dzeja PP, Miki T, Seino S, Terzic A. ATP-sensitive K+ channel knockout compromises the metabolic benefit of exercise training, resulting in cardiac deficits. Diabetes. 2004;53:S169–S175. doi: 10.2337/diabetes.53.suppl_3.s169. [DOI] [PubMed] [Google Scholar]
- Li S, Zhengyan Z, Xielai Z, Suhang L. The effect of lead on intracellualr Ca2+ in mouse lymphocytes. Toxicol In Vitro. 2010;22:1815–1819. doi: 10.1016/j.tiv.2008.08.005. [DOI] [PubMed] [Google Scholar]
- Matar W, Nosek TM, Wong D, Renaud JM. Pinacidil suppresses contractility and preserves energy but glibenclamide has no effect during fatigue in skeletal muscle. Am J Physiol Cell Physiol. 2000;278:C404–C416. doi: 10.1152/ajpcell.2000.278.2.C404. [DOI] [PubMed] [Google Scholar]
- McKenna MJ, Bangsbo J, Renaud JM. Muscle K+, Na+, and Cl− disturbances and Na+-K+ pump inactivation: implications for fatigue. J Appl Physiol. 2008;104:288–295. doi: 10.1152/japplphysiol.01037.2007. [DOI] [PubMed] [Google Scholar]
- Miki T, Nagashima H, Tashiro F, Kotake K, Yoshitomi H, Tamamoto A, Gonoi T, Iwanaga T, Miyazaki J-I, Seino S. Defective insulin secretion and enhanced insulin action in KATP channel-deficient mice. Proc Natl Acad Sci U S A. 1998;95:10402–10406. doi: 10.1073/pnas.95.18.10402. [DOI] [PMC free article] [PubMed] [Google Scholar]
- Murata M, Akao M, O’Rourke B, Marban E. Mitochondrial ATP-sensitive potassium channels attenuate matrix Ca2+ overoad during simulated ischemia and reperfusion. Circ Res. 2001;89:891–898. doi: 10.1161/hh2201.100205. [DOI] [PubMed] [Google Scholar]
- Noma A. ATP-regulated K+ channels in cardiac muscle. Nature. 1983;305:147–148. doi: 10.1038/305147a0. [DOI] [PubMed] [Google Scholar]
- Pang CY, Forrest CR. Acute pharmacologic preconditioning as a nw concept and alternative approach for prevention of skeletal muscle ischemic necrosis. Biochem Pharmacol. 1995;49:1023–1034. doi: 10.1016/0006-2952(94)00467-z. [DOI] [PubMed] [Google Scholar]
- Pette D, Vrbová G. Adaptation of mammalian skeletal muscle fibers to chronic electrical stimulation. Rev Physiol Biochem Pharmacol. 1992;120:115–203. doi: 10.1007/BFb0036123. [DOI] [PubMed] [Google Scholar]
- Steel RGD, Torrie JH. Principles and Procedures of Statistics. A Biometrical Approach. New York: McGraw-Hill Book Company; 1980. [Google Scholar]
- Thabet M, Miki T, Seino S, Renaud JM. Treadmill running causes significant damage in skeletal of muscle KATP channel deficient mice. Physiol Gen. 2005;22:204–212. doi: 10.1152/physiolgenomics.00064.2005. [DOI] [PubMed] [Google Scholar]
- Vivaudou MB, Arnoult C, Villaz M. Skeletal muscle ATP-sensitive K+ channels recorded from sarcolemmal blebs of split fibers: ATP inhibition is reduced by magnesium and ADP. J Membr Biol. 1991;122:165–175. doi: 10.1007/BF01872639. [DOI] [PubMed] [Google Scholar]
- Westerblad H, Allen DG. Changes of myoplasmic calcium concentration during fatigue in single mouse muscle fibers. J Gen Physiol. 1991;98:615–635. doi: 10.1085/jgp.98.3.615. [DOI] [PMC free article] [PubMed] [Google Scholar]
- Zingman LV, Hodgson DM, Bast PH, Kane GC, Perez-Terzic C, Gumina RJ, Pucar D, Bienengraeber M, Dzeja PP, Miki T, Seino S, Alekseev AE, Trezic A. Kir6.2 is required for adaptation to stress. Proc Natl Acad Sci U S A. 2002;99:13278–13283. doi: 10.1073/pnas.212315199. [DOI] [PMC free article] [PubMed] [Google Scholar]


