

Abstract
With a remarkable plasticity, skeletal muscle adapts to an altered functional demand. Muscle angio-adaptation can either involve the growth or the regression of capillaries as respectively observed in response to endurance training or muscle unloading. Whereas the molecular mechanisms that regulate exercise-induced muscle angiogenesis have been extensively studied, understanding how muscle unloading can in contrast lead to capillary regression has received very little attention. Here we have investigated the consequences of a 9 day time course hindlimb unloading on both capillarization and expression of angio-adaptive molecules in two different rat skeletal muscles. Both soleus and plantaris muscles were atrophied similarly. In contrast, our results have shown different angio-adaptive patterns between these two muscles. Capillary regression occurred only in the soleus, a slow-twitch and oxidative postural muscle. Conversely, the level of capillarization was preserved in the plantaris, a fast-twitch and glycolytic muscle. We have also measured the time course protein expression of key pro- and anti-angiogenic signals (VEGF-A, VEGF-B, VEGF-R2, TSP-1). Our results have revealed that the angio-adaptive response to unloading was muscle-type specific, and that an integrated balance between pro- and anti-angiogenic signals plays a determinant role in regulating this process. In conclusion, we have brought new evidence that measuring the ratio between pro- and anti-angiogenic signals in order to evaluate muscle angio-adaptation was a more accurate approach than analysing the expression of molecular factors taken individually.
Introduction
In response to various physiological or pathological conditions, skeletal muscle responds to an altered functional demand with a remarkable plasticity (Booth & Thomason, 1991). This includes changes in muscle size, in myofibres’ contractile and metabolic phenotype, and also in the vasculature (Booth & Thomason, 1991; Hudlicka et al. 1992). Muscle angio-adaptation can either involve angiogenesis or capillary regression as respectively observed in response to exercise training or muscle unloading (Hudlicka et al. 1992; Egginton, 2009). Whereas the molecular mechanisms that regulate exercise-induced muscle angiogenesis have been extensively studied (Hudlicka et al. 1992; Prior et al. 2004; Breen, 2007; Olfert et al. 2009; Malek & Olfert, 2009; Hudlicka & Brown, 2009; Egginton, 2009), understanding how muscle unloading can in contrast lead to capillary regression has received very little attention.
Hindlimb unloading (HU) is a well-established rodent model of hypokinesia and hypodynamia, often used to study the effect of weightlessness on skeletal muscle (Morey-Holton & Globus, 2002). HU results in a strong reduction in skeletal muscle contractile activity and leads to myofibre atrophy, reduced muscle blood flow, and capillary regression (Desplanches et al. 1987; Morey-Holton & Globus, 2002; Machida & Booth, 2004).
Previous studies have focused mostly on the soleus, a weight-bearing skeletal muscle. After 5 weeks of HU, this muscle was atrophied by 50% and its level of capillarization was decreased by 40% (Desplanches et al. 1987). The process of capillary regression, however, started as early as the first week of HU (Kano et al. 2000; Däpp et al. 2004). Interestingly, soleus from Wistar rats and C57/bl6 mice underwent a similar 20% capillary regression after 1 week of HU despite strain-specific differences in their fibre-type composition (Kano et al. 2000; Däpp et al. 2004). In addition, Kano and collaborators (2000) have shown no additional capillary regression between 1 and 3 weeks of HU.
Muscle angio-adaptation is tightly regulated by a balance between pro- and anti-angiogenic signals. To date, the pro-angiogenic vascular endothelial growth factor-A (VEGF-A) and the anti-angiogenic thrombospondin-1 (TSP-1) are the most well characterized regulators of skeletal muscle angio-adaptation (Tang et al. 2004; Olfert et al. 2006, 2009; Malek & Olfert, 2009; Malek et al. 2010). Their functional importance has been well demonstrated in the context of exercise-induced muscle angiogenesis (Olfert et al. 2009; Malek & Olfert, 2009). Surprisingly, the molecular factors and mechanisms responsible for the loss of capillaries in response to HU remain largely unknown.
It was recently reported that VEGF-A mRNA expression was unaffected after 10 days of HU in mouse gastrocnemius muscle whereas VEGF receptor mRNA levels were decreased (Wagatsuma, 2008). Unfortunately, neither VEGF protein levels nor muscle capillarization were measured in this study. Moreover, mRNA levels were measured at one single time point only, where it is known that about 20% of capillary regression has already occurred (Kano et al. 2000; Däpp et al. 2004). Muscle angio-adaptation is a very dynamic biological process and the expression of angio-adaptive factors and their receptors can be very rapidly affected in skeletal muscle in response to physiological changes such as alterations in blood flow or contractile activity (Egginton, 2009; Hudlicka & Brown, 2009). No study has ever investigated the time course effect of HU simultaneously on both muscle capillarization and expression of angio-adaptive factors. Therefore, there is an important need to conduct dynamic studies in order to better understand the molecular mechanisms responsible for HU-induced capillary regression.
Here, we propose to revisit the concept of muscle capillary regression through a kinetic study in two rat skeletal muscles: the oxidative and slow-twitch soleus versus the glycolytic and fast-twitch plantaris. We have compared the time course changes in both capillarization and protein expression for key angio-adaptive molecules in response to HU. While both muscles atrophied similarly, our results have shown different angio-adaptive patterns between soleus and plantaris leading to capillary regression in the soleus only.
Methods
Animal care
The animal care and use were approved by the Institutional Animal Care Committee of Université Lyon 1 and was conducted accordingly to the directives of the Declaration of Helsinki for the use of laboratory animals.
Hindlimb unloading model
Forty-two female Wistar rats (mean body weight 200 g) were purchased from Charles River (L’Arbresles, France) and housed on a 12:12 h light–dark cycle, with water and food access ad libitum. After 1 week of acclimatization, animals were divided into seven groups corresponding to different durations of hindlimb unloading: 0, 0.5, 1, 3, 5, 7 and 9 days (n = 6/group). Hindlimb unloading was performed by tail suspension as previously described (Desplanches et al. 1987; Morey-Holton & Globus, 2002; Flück et al. 2005).
Killing and tissue processing
Rats were weighed and then anaesthetized by ketamine (80 mg kg−1)–xylazine (10 mg kg−1) intraperitoneal injection. Soleus and plantaris muscles were harvested, weighed and fast-frozen in liquid nitrogen. Killing was performed by exsanguinations and heart removal.
Immunohistochemistry
Frozen 8 μm transverse cross-sections were cut in the mid-belly of the muscle. Capillaries were visualized after a brief fixation in cold acetone followed by staining for alkaline phosphatase activity by incubation with 5-bromo-4-chloro-3-indolyl phosphate/nitro blue tetrazolium (FAST BCIP/NBT, Sigma-Aldrich, Oakville, ON, Canada) for 45 min at 37°C (Roudier et al. 2009). Pictures were acquired using an Axio-Imager (Zeiss, Jena, Germany) equipped with an AxioCam camera (Zeiss). Capillary density (CD) and capillary-to-fibre ratio (C/F) were determined after counting capillaries and myofibres on three to five cryosections from each muscle and in quintuplet on each of these cryosections. Mean fibre cross-sectional area (FCSA) was calculated from the total number of fibres divided by the total muscle area. As the soleus and the plantaris muscles are not homogeneous in their fibre-type composition, counting areas were randomly chosen all over the muscle cross-section in order to provide a global estimation of muscle C/F, CD and FCSA by muscle-type. An average of 120–180 fibres and 140–350 capillaries were counted on each counting area.
Western blotting
Proteins were extracted from 20–40 mg of frozen muscles using a RIPA lysis buffer containing 1 mg ml−1 PMSF, 1 mm Na3VO4, 1 mm NaF (Sigma-Aldrich), 1× protease inhibitors cocktail (Complete Mini and PhosStop, Roche Diagnostics, Laval, QC, Canada). Muscle lyses were performed in a Retsch MM400 tissue lyser (Retsch GmbH, Haan, Germany). Denatured samples were separated on SDS-PAGE and blotted onto either a PVDF membrane (Immun-Blot, Bio-Rad, Mississauga, ON, Canada) or 0.45 μm nitrocellulose membrane (Whatman Protran BA95, Sigma-Aldrich). After blocking with 5% fat-free milk, membranes were probed using antibodies against VEGF-A (1:500, sc-507, Santa-Cruz Biotechnology, Santa-Cruz, CA, USA), VEGF-B (1:500, H70, sc-13083, Santa-Cruz Biotechnology), TSP-1 (1:500, clone A6.1, no. 399300, Invitrogen, Burlington, ON, Canada), Flk-1 (1:500, C1158, sc-504, Cell Signaling, Pickering, ON, Canada), phospho-p53 (1:500, Ser15, no. 9284S, Cell Signaling), p53 (1:200, clone DO.1, sc-126, Santa-Cruz Biotechnology), Mdm2 (1:75, Clone 2A10, kindly provided by Dr Mary E. Perry, NCI-NIH, Frederick, MD, USA), β-tubulin (1:750, no. 2148, Cell Signaling), HRP-conjugated anti-mouse (1:1000, p0260, Dako, Mississauga, ON, Canada; or NA-931, GE Healthcare, Piscataway, NJ, USA) and HRP-conjugated anti-rabbit (1:1000, p0217, Dako). Proteins were visualized using an enhanced chemiluminescence procedure (Super Signal West Pico, Fisher Scientific, Markham, ON, Canada) on X-Ray film or using a Kodak Imaging station 4000MM Pro. Equal protein loading was verified before immunodetection by Ponceau S staining of the membrane and by immunodetection of β-tubulin as our loading control. All western blots were run in duplicate. Quantifications of protein expression levels were carried out using NIH Image 1.62 Software and expressed as densitometric arbitrary units (DAIs). The levels of expression for our proteins of interest (VEGF-A, VEGF-B, Flk-1, TSP-1, Mdm2, phospho-p53, and p53) were individually normalized to β-tubulin expression level, and ratios were compared between the different HU time points (day 0 to day 9).
Statistical analyses
Statistical analyses were performed with Prism5 for Mac OSX (v. 5.0, GraphPad Software Inc., La Jolla, CA, USA). One way ANOVA using a Newman–Keuls post hoc test was applied and results were considered to be statistically significant when P ≤ 0.05.
Results
Muscle-type differences in capillarization and angio-adaptive proteins
Figure 1 illustrates the differences in the percentage of capillarization and expression of angio-adaptive proteins between control (i.e. day 0) soleus and plantaris muscles. Protein levels were determined by Western blotting. The capillary-to-fibre ratio (C/F) was 24% lower in plantaris muscle than in the soleus (P ≤ 0.01). The plantaris muscle expressed less pro-angiogenic VEGF-A and VEGF-R2 signals and more anti-angiogenic TSP-1 than the soleus: −25% for VEGF-A (P ≤ 0.05), −33% for VEGF-R2 (P ≤ 0.001), and +287% for TSP-1 (P ≤ 0.001).
Figure 1. Muscle-type differences in capillarization and angio-adaptive proteins.
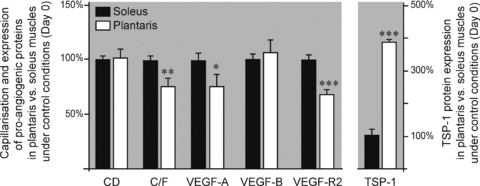
Relative levels of capillarization and angio-adaptive proteins in the plantaris muscle compared to the soleus muscle, under control conditions (i.e. day 0). Values have been normalized to soleus levels. Data are expressed as means ± s.e.m. (n = 6 rats/group). Significant difference between soleus and plantaris muscles: *P ≤ 0.05; **P ≤ 0.01; ***P ≤ 0.001.
Hindlimb unloading and skeletal muscle atrophy
Both soleus and plantaris muscles were atrophied to a similar extent in response to time course hindlimb unloading (HU, Table 1). The muscle weight relative to body weight was decreased at day 9 by respectively 22% and 20% in soleus and plantaris muscles when compared to day 0 (soleus: 0.31 ± 0.02 mg g−1 at day 9 vs. 0.40 ± 0.01 mg g−1 at day 0, P ≤ 0.001; plantaris: 0.78 ± 0.02 mg g−1 at day 9 vs. 0.98 ± 0.03 mg g−1 at day 0, P ≤ 0.01). The mean fibre cross-section area (FCSA) followed a similar pattern in soleus and plantaris muscles with a significant decrease starting at day 5 and reaching −26% at day 9 (soleus: 1833 ± 68 μm2 at day 5 and 1879 ± 105 μm2 at day 9 vs. 2532 ± 75 μm2 at day 0, P < 0.001; plantaris: 1518 ± 50 μm2 at day 5 and 1496 ± 58 μm2 at day 9 vs. 2027 ± 86 μm2 at day 0, P ≤ 0.05). Unexpectedly, the plantaris relative weight at day 1 was already significantly lower than at day 0 (−13%, 0.85 ± 0.04 mg g−1 at day 1 vs. 0.98 ± 0.03 mg g−1 at day 0, P ≤ 0.01).
Table 1.
Morphometric values in rats subjected to a 9 days time course hindlimb unloading
| Hindlimb unloading duration (days) | ||||||
|---|---|---|---|---|---|---|
| 0 | 1 | 3 | 5 | 7 | 9 | |
| Mean body weight (g) | 197 ± 4 | 203 ± 3 | 190 ± 6 | 190 ± 5 | 197 ± 4 | 195 ± 2 |
| Soleus weight (mg)/body weight (g) | 0.40 ± 0.01 | 0.41 ± 0.01 | 0.38 ± 0.02 | 0.36 ± 0.02 | 0.31 ± 0.01***,¶¶¶,†† | 0.31 ± 0.02***,¶¶¶,†† |
| Soleus mean FCSA (μm2) | 2532 ± 75 | 2437 ± 122 | 2397 ± 142 | 1833 ± 68***,¶¶,†† | 1621 ± 86***,¶¶¶,††† | 1879 ± 105***,¶¶,†† |
| Plantaris weight (mg)/body weight (g) | 0.98 ± 0.03 | 0.85 ± 0.04** | 0.87 ± 0.02** | 0.85 ± 0.03* | 0.84 ± 0.02** | 0.78 ± 0.02*** |
| Plantaris mean FCSA (μm2) | 2027 ± 86 | 2169 ± 236 | 1933 ± 71 | 1518 ± 50**,¶,† | 1578 ± 118**,¶,† | 1496 ± 58**,¶,† |
Both soleus and plantaris muscles atrophied to a similar extent after 9 days of hindlimb unloading. Based on relative muscle weight, the plantaris muscle was atrophied as early as day 1 (P ≤ 0.01). Atrophy was delayed in soleus, significantly occurring only at day 7 (P ≤ 0.001). Based on the mean fibre cross-sectional area (FCSA), atrophy presented similar kinetics and amplitude in both muscles. Significantly different from day 0:
P ≤ 0.05
P ≤ 0.01
P ≤ 0.001.
Significantly different from day 1
P ≤ 0.05
P ≤ 0.01
P ≤ 0.001.
Significantly different from day 3
P ≤ 0.05
P ≤ 0.01
P ≤ 0.001.
Data are expressed as means ± s.e.m. (n = 6 rats/group).
Skeletal muscle capillarization in reponse to hindlimb unloading
Figure 2A shows representative pictures of soleus (left panel) and plantaris (right panel) muscle cross-sections after alkaline phosphatase staining. The capillary density (CD) and the capillary-to-fibre ratio (C/F) were measured in both soleus and plantaris muscles (Fig. 2B–C). In response to HU-induced myofibre atrophy, CD was significantly increased after 5 days of HU in both muscles reaching at day 9 respectively +18% in soleus and +27% in plantaris (Fig. 2B; soleus: 994 ± 22 capillaries (cap.) mm−2 at day 9 vs. 836 ± 28 cap. mm−2 at day 0, P < 0.05; plantaris: 1087 ± 39 cap. mm−2 at day 9 vs. 852 ± 63 cap. mm−2 at day 0, P < 0.05).
Figure 2. Hindlimb unloading and skeletal muscle capillarization.
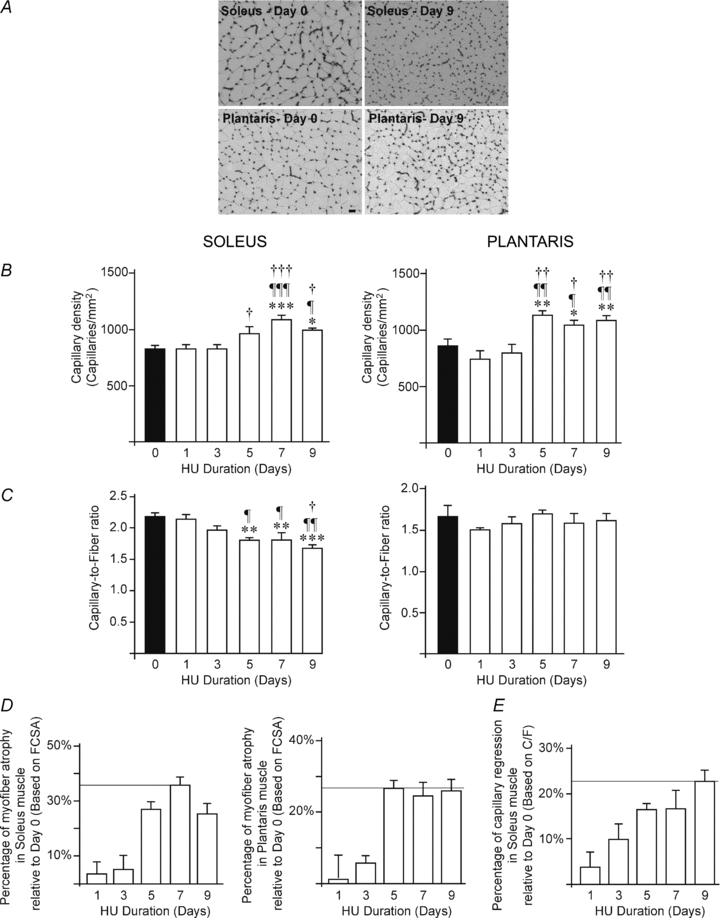
A, representative images of capillaries staining in soleus (left) and plantaris (right) muscles from control animals (day 0, top panel) and after 9 days of hindlimb unloading (day 9, bottom panel). Scale bar, 50 μm. B–C, quantitative measurement of capillary density (B) and capillary-to-fibre ratio (C) in soleus (left panel) and plantaris (right panel) muscles following time course hindlimb unloading (HU, from days 0 to 9). Data are expressed as means ± s.e.m. (n = 6 rats/group). Significantly different from day 0: *P ≤ 0.05; **P ≤ 0.01; ***P ≤ 0.001. Significantly different from day 1: ¶P ≤ 0.05; ¶¶P ≤ 0.01; ¶¶¶P ≤ 0.001. Significantly different from day 3: †P ≤ 0.05; ††P ≤ 0.01; †††P ≤ 0.001. Significantly different from day 5: #P ≤ 0.05. Percentage of muscle atrophy (D) and capillary regression (E) based on mean FCSA and C/F values, respectively. Data are expressed as means ± s.e.m. (n = 6 rats/group). FCSA, mean fibre cross-sectional area; C/F, capillary-to-fibre ratio.
However, capillary regression only occurred in the soleus muscle as reflected by a significant 17% decrease in C/F ratio after 5 days of HU, reaching −23% at day 9 (Fig. 2C, left panel: 1.81 ± 0.03 at day 5 and 1.68 ± 0.05 at day 9 vs. 2.17 ± 0.06 at day 0, respectively P < 0.01 and P < 0.001). Percentages of capillary regression (Fig. 2E) and myofibre atrophy (Fig. 2D) followed a similar profile in soleus muscle.
In contrast, the equipment in capillaries was preserved in plantaris muscle (Fig. 2C, right panel; C/F: 1.62 ± 0.08 at day 9 vs. 1.66 ± 0.14 at day 0).
Expression of pro-angiogenic proteins during hindlimb suspension
We investigated the time course expression of VEGF-A, VEGF-B and VEGF receptor 2 (VEGF-R2) proteins in response to muscle unloading.
In soleus muscle, VEGF-A protein expression was unaffected by HU (Fig. 3A, left panel). VEGF-B expression showed two peaks at respectively days 3 and 7 of HU where protein levels were increased in comparison to all other time point measurements (Fig. 3B, left panel: 1.01 ± 0.10 densitometry arbitrary units (DAI) at day 0 vs. 1.43 ± 0.12 DAI at day 3 (+50%), and vs. 1.30 ± 0.15 DAI at day 7 (+37%), P < 0.01). Interestingly, VEGF-R2 protein expression was progressively decreased by 50% over the 9-day HU time course period (Fig. 3C, left panel: 0.51 ± 0.03 DAI at day 0 vs. 0.25 ± 0.04 DAI at day 9, P < 0.05).
Figure 3. VEGF-A, VEGF-B and VEGF receptor-2 protein expression in response to hindlimb unloading.
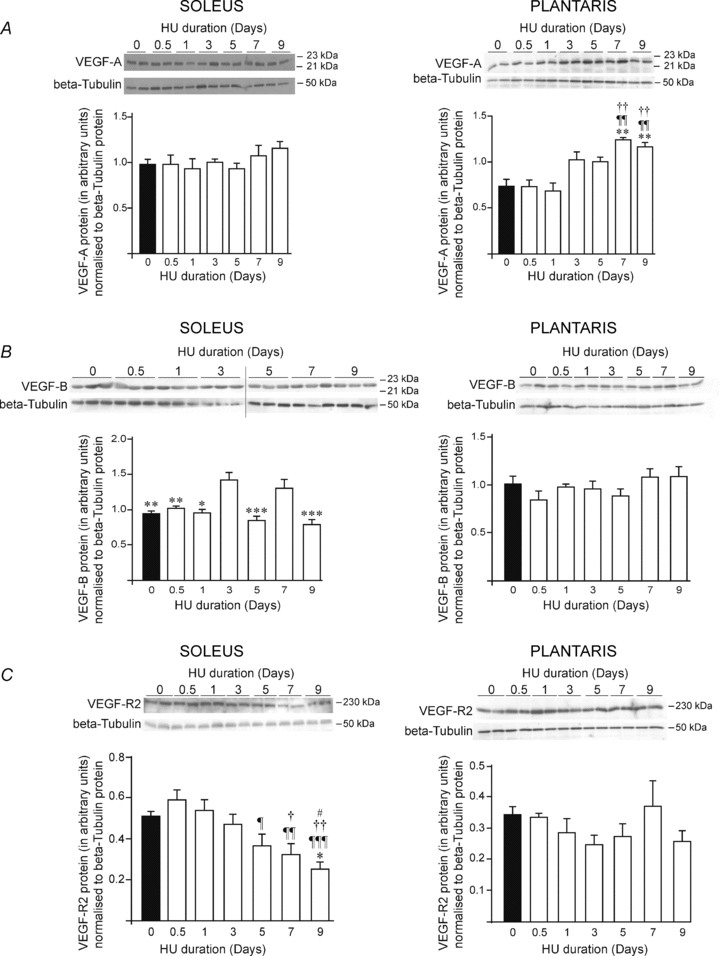
Animals were subjected to a 9-day time course hindlimb unloading. Protein levels were measured by western blotting in soleus and plantaris muscles, left and right panels respectively. β-Tubulin protein was used as a loading control. Top-panels of A, B and C show images of VEGF-A, VEGF-B and VEGF-R2 protein expressions, respectively. Bottom panels of A, B and C show densitometric analyses of VEGF-A, VEGF-B or VEGF-R2 proteins relative to β-tubulin. Densitometric analyses show means ± s.e.m. (n = 6 rats/group). Significant differences: vs. day 0 **P ≤ 0.01; ***P ≤ 0.001; vs. day 0.5: ¶P ≤ 0.05; ¶¶P ≤ 0.01; ¶¶¶P ≤ 0.001; vs. day 1: †P ≤ 0.05; ††P ≤ 0.01; †††P ≤ 0.001; vs. day 3 #P ≤ 0.05; ##P ≤ 0.01; ##P ≤ 0.001; vs. day 7 ‡‡P ≤ 0.01.
In plantaris muscle, VEGF-A protein expression was increased in response to HU by +68% and +57% after 7 and 9 days of HU, respectively (Fig. 3A, right panel: 1.24 ± 0.03 DAI at day 7 and 1.16 ± 0.06 DAI at day 9 vs. 0.74 ± 0.10 DAI at day 0, P < 0.01). In contrast, HU affected neither VEGF-B nor VEGF-R2 protein expression in plantaris muscle (Fig. 3B and C, right panels).
Thrombospondin-1, p53 and murine double minute-2 response to hindlimb unloading
In soleus muscle, thrombospondin-1 (TSP-1) protein expression was significantly increased by 137% after 5 days of unloading, reaching a maximum at day 7 (+258%), and remaining increased by 185% at day 9 (Fig. 4A, left panel. vs. day 0 (0.26 ± 0.05 densitometry arbitrary units, DAI): 0.61 ± 0.07 DAI at day 5, P < 0.05; 0.92 ± 0.14 DAI at day 7, P < 0.001; and 0.73 ± 0.11 DAI at day 9, P < 0.01). Expression of the transcription factor p53, which has been previously shown to regulate TSP-1 (Dameron et al. 1994), was increased in soleus in response to HU (Fig. 4B). An early and acute p53 response was observed 12 h after the onset of HU (+161%), and was then significantly increased between day 3 (+130%) and day 9 (+230%) (Fig. 4B: 0.49 ± 0.07 DAI at day 0 vs. 1.14 ± 0.08 DAI at days 5 and 7 (P < 0.01), and vs.1.63 ± 0.16 DAI at day 9, P < 0.001). The expression of murine double minute-2 (Mdm2), a well-described p53 downstream target, followed the same pattern as TSP-1 (Fig. 4C). Mdm2 protein level was significantly increased by 97% after 5 days of HU, reaching +132% at day 9 (Fig. 4C: 0.38 ± 0.05 DAI at day 0 vs. 0.74 ± 0.04 DAI at day 5, and vs. 0.87 ± 0.05 DAI at day 9, P < 0.01).
Figure 4. TSP-1, p53 and Mdm2 protein expressions in response to hindlimb unloading.
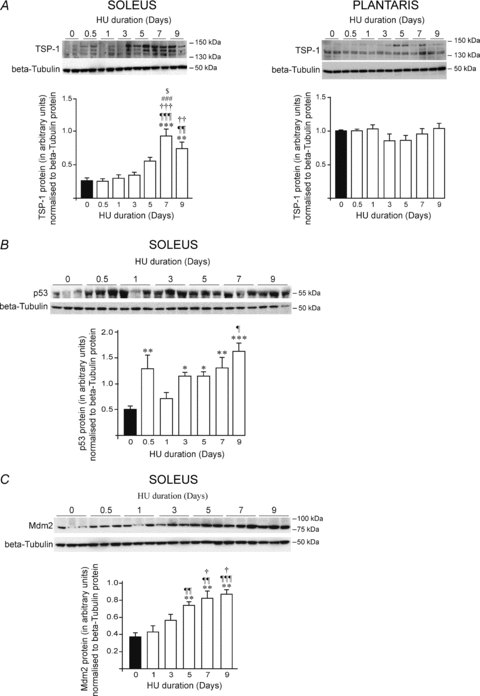
Animals were subjected to a 9 day time course hindlimb unloading. Protein levels were measured by Western blotting in soleus and plantaris muscles. β-Tubulin protein was used as a loading control. Top-panels of A, B and C show representative pictures of TSP-1, p53 and Mdm2 protein expressions, respectively. Bottom panels of A, B and C show densitometric analyses of TSP-1, p53 or Mdm2 proteins relative to β-tubulin. Data are means ± s.e.m. (n = 6 rats/group). Significant differences are vs. day 0 *P≤0.05; **P ≤ 0.01; ***P ≤ 0.001; vs. day 0.5 ¶P ≤ 0.05; ¶¶P ≤ 0.01; ¶¶¶P ≤ 0.001; vs. day 1 †P ≤ 0.05; ††P ≤ 0.01; †††P ≤ 0.001; vs. day 3 #P ≤ 0.05; ###P ≤ 0.001; and vs. day 5, $P ≤ 0.05.
In contrast, the protein level of TSP-1 remained unchanged in plantaris muscle at all HU time points (Fig. 4A, right panel).
Muscle type-specific regulation of the angioadaptive balance
We have calculated the ratio between the pro- (VEGF-A, VEGF-B, VEGF-2) and the anti-angiogenic (TSP-1) proteins in order to determine how the angio-adaptive balance was altered by HU in both skeletal muscles. The VEGF-A/TSP-1 balance was affected by HU in an opposite manner between soleus and plantaris muscles (Fig. 5A).
Figure 5. Hindlimb unloading and the angioadaptive balance in soleus and plantaris muscles.
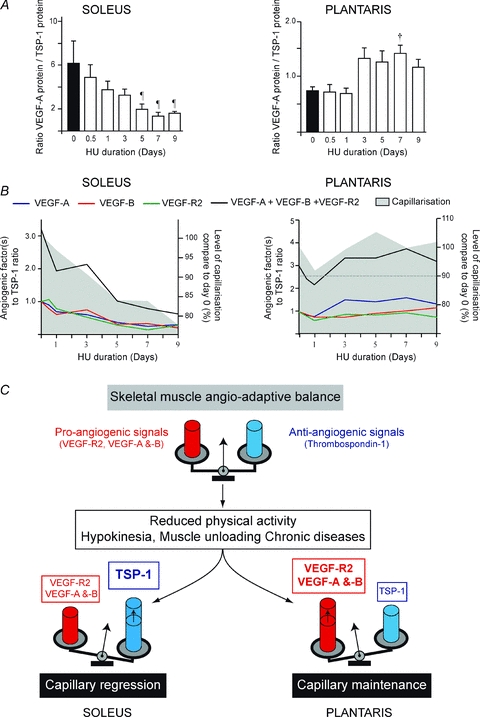
The ratios between the relative expression of pro-angiogenic proteins (VEGF-A, VEGF-B and VEGF-R2) and the anti-angiogenic TSP-1 proteins were calculated during the time course of hindlimb unloading. A shows VEGF-A to TSP-1 ratio over the time of hindlimb unloading in soleus and plantaris muscles (left and right panels, respectively). Data are means ± s.e.m. (n = 6 rats/group). Significant differences are vs. day 0.5, ¶P ≤ 0.05; and vs. day 1 †P ≤ 0.05. B illustrates the time course of changes in muscle capillarization and in the ratios VEGF-A, VEGF-B, VEGF-R2, or the sum of all pro-angiogenic proteins measured (VEGF-A+VEGF-B+VEGF-R2), relative to TSP-1 in soleus and plantaris (left and right panels, respectively). Ratios at different HU time points were normalized to day 0 (equal to 1.0 arbitrary unit). Muscle capillarization at different HU time points is expressed as a percentage of capillarization at day 0. C, schematic illustration of how the angio-adaptative balance is differently regulated between soleus and plantaris muscles in response to hindlimb unloading.
In soleus muscle, a significant decrease in VEGF-A/TSP-1 ratio was detected from day 5 to day 9 of HU when compared to day 0 (Fig. 5A, left panel: 6.13 ± 2.14 at day 0 vs. 2.00 ± 0.50 at day 5 (−63%), 1.35 ± 0.32 at day 7 (−78%), and 1.62 ± 0.16 at day 9 (−73%), P < 0.05).
In plantaris muscle, VEGF-A/TSP-1 ratio increased progressively over the HU time course, reaching significance at day 7 only (Fig. 5A, right panel: 0.75 ± 0.07 at day 0 vs. 1.41 ± 0.16 at day 7 (+88%), P < 0.05). The temporal relationship between changes in capillarization and in the ratios of individual pro-angiogenic proteins (VEGF-R2, VEGF-A, VEGF-B), as well as their sum, relative to TSP-1 are shown in Fig. 5B. In the soleus, all ratios followed the same pattern with a decrease over time (Fig. 5B, left panel). This suggests that the observed decrease in TSP-1 plays a determinant role in the angio-adaptive response to HU. In contrast, the VEGF-A/TSP-1 ratio and the ratio between all pro-angiogenic proteins and TSP-1 were increased over time in plantaris muscle (Fig. 5B, right panel).
All together, these results indicate that in both muscles the balance between all proangiogenic protein and TSP-1 perfectly matched the level of capillarization in the tissue.
Discussion
Here, we investigated in a time course manner and in two different muscle types the unloading-induced changes in both muscle capillarization and angio-adaptive molecule expression. The soleus muscle is a slow-twitch and very oxidative weight-bearing muscle, considerably affected by HU. The plantaris muscle is a fast-twitch and glycolytic muscle. Choosing a time course approach rather than one single time point measurement was crucial to be certain to overlap the dynamic molecular and tissue events known to occur within the first week of unloading (Kano et al. 2000; Däpp et al. 2004). We have also measured the expression of angio-adaptive molecules at the protein level rather than mRNA level since proteins would be more likely to be the key actors initiating and driving the capillary regression process.
Unloaded soleus and plantaris muscles undergo similar muscle atrophy but different angio-adaptation
Our results brought evidence that despite similar muscle atrophy, angio-adaptation was different between soleus and plantaris muscles. Soleus and plantaris muscles were both atrophied to a similar extent after 9 days of HU, consistent with previous studies focusing on 7 or 15 days of HU in rats (McDonald et al. 1992a,b; Kano et al. 2000; Fujino et al. 2005). Whereas relative muscle weight and FCSA both started to decrease significantly in soleus muscle after 5 days of HU, we observed an unexpected 13% decrease in the plantaris relative weight after day 1. However, this was not associated with any concomitant decrease in FCSA, which was decreased at day 5 as in the soleus muscle.
Capillary density (CD) was significantly increased to a similar level in soleus and plantaris muscles in response to HU, most likely as a result of myofibre atrophy. However, changes in CD do not strictly reflect any capillary loss or growth. Analysis of the capillary-to-fibre ratio (C/F) revealed that capillary regression occurred in soleus muscle after 5 days of HU, concomitantly with FCSA reduction and reaching a 23% decrease at day 9 consistent with the existing literature (Kano et al. 2000; Däpp et al. 2004; Fujino et al. 2005). Conversely, capillarization was preserved in plantaris muscle over the 9 days of HU despite similar myofibre atrophy as observed in the soleus.
Regulation of the angio-adaptive balance differs between soleus and plantaris muscles
Gene deletion of the pro-angiogenic vascular endothelial growth factor-A (VEGF-A) and of the anti-angiogenic thrombospondin-1 (TSP-1) respectively led to decreased and increased basal capillarization in mouse skeletal muscle (Tang et al. 2004; Olfert et al. 2009; Malek & Olfert, 2009). In consequence, animal exercise capacity was respectively decreased in VEGF-A deficient mice and increased in TSP-1 deficient ones (Olfert et al. 2009; Malek & Olfert, 2009). Here we showed that HU affected VEGF-A and TSP-1 protein expression in a muscle type-specific manner.
In the soleus, where capillaries regressed, the time course expression of VEGF-A protein was unaffected by HU, consistent with the study from Wagatsuma (2008), reporting no change in VEGF-A mRNA levels in gastrocnemius from CD1 mice subjected to 10 days of HU. In contrast, we found that VEGF-A protein expression was significantly increased after 7 and 9 days of HU in the plantaris muscle where capillarization was preserved.
Conversely to HU, muscle overload leads to myofibre hypertrophy and capillary growth. A 20% increase in C/F ratio was reported after 2 weeks of overload of the extensor digitorum longus muscle (Brown & Hudlicka, 2003; Williams et al. 2006a,b;). Interestingly, treating the animals with a VEGF-A Trap prevented this angiogenic response (Williams et al. 2006b). In their study, Degens et al. (2003) have reported increased expression of VEGF-A mRNA and protein in rat plantaris muscle overloaded for 2 weeks. Recently, Parvaresh et al. (2010) have compared VEGF-A expression in overloaded soleus and plantaris muscles. VEGF-A expression was transiently increased in the plantaris muscle after 3 days of overload, returning to the level of unloaded muscle after 7 days. Surprisingly, VEGF-A expression in overloaded soleus followed the opposite pattern: a transient decrease at day 3 and a return to unloaded values at day 7 (Parvaresh et al. 2010).
Altogether, these results from overloading experiments and from our unloading study support the idea that increased VEGF-A levels might determine the maintenance or the growth of muscle capillaries. Interestingly, Parvaresh et al. (2010) suggest that regulation of VEGF-A expression by MyoD might explain the contrasting response between overloaded soleus and plantaris. VEGF-A promoter indeed possesses some MyoD-specific consensus sites (Bryan et al. 2008). Microarray analysis from 3-day overloaded soleus have shown no change for MyoD expression whereas an increase was found in plantaris muscle after 2 and 3 days of overload (Mozdziak et al. 1998; Carson et al. 2002; Hyatt et al. 2008). In the context of muscle unloading, MyoD expression seems to be more affected by HU in plantaris than in soleus muscle from young rats (Alway et al. 2001). Whereas MyoD mRNA and protein were respectively increased by 235% and 1600% in the plantaris, only MyoD protein was increased in soleus muscle by 85% (Alway et al. 2001). This is an interesting observation that could explain why our HU data have shown no change in VEGF-A expression in the soleus but an increase in plantaris muscle.
In the soleus, the maintenance of VEGF-A alone is not sufficient to prevent the capillary regression observed in response to unloading. Angio-adaptation is fine-tuned by a balance between pro- and anti-angiogenic signals. We therefore measured protein expression levels for VEGF-B and VEGF receptor-2 (VEGF-R2).
VEGF-R2 has been described as mediating most of VEGF-A pro-angiogenic signalling (Milkiewicz et al. 2006; Olfert et al. 2009; Ferrara, 2009). Consistent with the results from Wagatsuma (2008) at the mRNA levels, VEGF-R2 protein expression was significantly decreased in our soleus samples after 5 days of HU, possibly contributing to an angio-adaptive balance in favour of some vascular destabilization and capillary regression.
VEGF-B is another member of the VEGF family expressed in skeletal muscle (Olofsson et al. 1996a,b;). Despite some contradictory results, most of the recent studies suggest that VEGF-B is more important for recovering angiogenesis in the ischaemic heart than in other tissues including ischaemic skeletal muscles (Bellomo et al. 2000; Silvestre et al. 2003; Claesson-Welsh, 2008; Li et al. 2008; Li, 2010; Hagberg et al. 2010). However, through its binding to VEGF receptor-1, VEGF-B could limit VEGF-A trapping by this receptor, thus making VEGF-A more available for the pro-angiogenic VEGF-R2 (Claesson-Welsh, 2008). In addition, VEGF-B was recently shown to mediate some anti-apoptotic effects in endothelial cells (Li et al. 2008). The biological function of VEGF-B in skeletal muscle remains, then, debatable and poorly understood. Here, we observed two unexpected peaks of expression for VEGF-B protein after 3 and 7 days of HU in soleus. It is, however, very unlikely that such transient variation could exert any notable effect on preventing capillary regression. In plantaris muscle, neither VEGF-B nor VEGF-R2 protein expression were affected by HU.
Protein expression of the anti-angiogenic TSP-1 was strongly increased after 5 days of HU in the soleus concomitantly with capillary regression. In contrast, no change in TSP-1 level was observed in plantaris muscle. The tumour suppressor protein p53 has been shown to regulate TSP-1 promoter activity although data in that field still remain controversial (reviewed in Ren et al. 2006). TSP-1 promoter regulation by p53 seems to be indirect and to involve co-factors and/or co-repressors (Su et al. 2010). p53 has also been shown to impair VEGF-A expression, either directly via p53 binding to VEGF-A promoter (Qin et al. 1994; Pal et al. 2001) or indirectly through p53-mediated proteasomal degradation of HIF-1a (An et al. 1998; Blagosklonny et al. 1998; Ravi et al. 2000). p53 expression was found to be increased in the cytoplasmic fraction of soleus muscle after 14 days of HU (Siu et al. 2006). Here, we observed a progressive increase in p53 protein expression in the soleus, starting at day 3 of HU and thus preceding TSP-1 up-regulation. We also measured murine double minute-2 (Mdm2) protein expression as a control p53 downstream target. p53 binds to Mdm2 promoter, enhances its activity, and leads to an increased Mdm2 protein expression (Vousden & Prives, 2009; Eischen & Lozano, 2009). We found that Mdm2 protein expression was increased in the soleus in response to HU with the same pattern as for TSP-1. All together, these results suggest that p53 could participate in the process of capillary regression in the soleus by up-regulating TSP-1 protein expression but does not seem to play a role in down-regulating VEGF-A protein expression in response to HU.
Since angio-adaptation is tightly regulated by a balance between stimulatory and inhibitory signals, we have determined the ratio between pro- and anti-angiogenic proteins in our samples. In the soleus, all ratios were decreased, reflecting a balance in favour of some capillary destabilization and regression. The opposite observation was made in the plantaris where increased ratios were likely to be required for the maintenance of muscle capillarization. Interestingly, muscle capillarization followed the same time course pattern as for the different pro-/anti-angiogenic ratios in each unloaded muscle. This concept of an integrated angio-adaptive balance is illustrated in Fig. 5C.
In conclusion, our study has illustrated for the first time that the angio-adaptive response to unloading was muscle type specific and that an integrated balance between pro- and anti-angiogenic signals plays an important role in regulating this process. We have also brought new evidence that measuring the ratio between pro- and anti-angiogenic signals in order to evaluate muscle angio-adaptation was a more accurate approach than analysing the expression of molecular factors taken individually.
Acknowledgments
This study was supported by funding from the Natural Sciences and Engineering Research Council of Canada (NSERC Individual Discovery Grant no. 341258 to O.B.).
Glossary
Abbreviations
- CD
capillary density
- C/F
capillary-to-fibre ratio
- FCSA
fibre cross-sectional area
- HU
hindlimb unloading
- Mdm2
murine double minute-2
- PVD
peripheral vascular diseases
- TSP-1
thrombospondin-1
- VEGF-A
vascular endothelial growth factor-A
- VEGF-B
vascular endothelial growth factor-B
- VEGF-R2
VEGF receptor-2
Author contributions
E.R. and O.B. contributed to the design of the study, performed experiments, analysed and interpreted data, and wrote the manuscript. C.G. performed animal conditioning, experiments, and analysed data. A.W. and K.D. performed Western blot analysis on Mdm2, p53, and VEGF-R2. D.D. contributed to animal conditioning. All authors contributed to the drafting and revision of the manuscript content and gave their final approval of the version to be published. Experiments were carried out at York University (Muscle Health Research Center) and Université Lyon 1 (UMR 5123).
References
- Alway SE, Lowe DA, Chen KD. The effects of age and hindlimb supension on the levels of expression of the myogenic regulatory factors MyoD and myogenin in rat fast and slow skeletal muscles. Exp Physiol. 2001;86:509–517. doi: 10.1113/eph8602235. [DOI] [PubMed] [Google Scholar]
- An WG, Kanekal M, Simon MC, Maltepe E, Blagosklonny MV, Neckers LM. Stabilization of wild-type p53 by hypoxia-inducible factor 1α. Nature. 1998;392:405–408. doi: 10.1038/32925. [DOI] [PubMed] [Google Scholar]
- Bellomo D, Headrick JP, Silins GU, Paterson CA, Thomas PS, Gartside M, Mould A, Cahill MM, Tonks ID, Grimmond SM, Townson S, Wells C, Little M, Cummings MC, Hayward NK, Kay GF. Mice lacking the vascular endothelial growth factor-B gene (Vegfb) have smaller hearts, dysfunctional coronary vasculature, and impaired recovery from cardiac ischemia. Circ Res. 2000;86:E29–35. doi: 10.1161/01.res.86.2.e29. [DOI] [PubMed] [Google Scholar]
- Blagosklonny MV, Giannakakou P, Wojtowicz M, Romanova LY, Ain KB, Bates SE, Fojo T. Effects of p53-expressing adenovirus on the chemosensitivity and differentiation of anaplastic thyroid cancer cells. J Clin Endocrinol Metab. 1998;83:2516–2522. doi: 10.1210/jcem.83.7.4984. [DOI] [PubMed] [Google Scholar]
- Booth FW, Thomason DB. Molecular and cellular adaptation of muscle in response to exercise: perspectives of various models. Physiol Rev. 1991;71:541–585. doi: 10.1152/physrev.1991.71.2.541. [DOI] [PubMed] [Google Scholar]
- Breen EC. VEGF in biological control. J Cell Biochem. 2007;102:1358–1367. doi: 10.1002/jcb.21579. [DOI] [PubMed] [Google Scholar]
- Brown MD, Hudlicka O. Modulation of physiological angiogenesis in skeletal muscle by mechanical forces: involvement of VEGF and metalloproteinases. Angiogenesis. 2003;6:1–14. doi: 10.1023/a:1025809808697. [DOI] [PubMed] [Google Scholar]
- Bryan BA, Walshe TE, Mitchell DC, Havumaki JS, Saint-Geniez M, Maharaj AS, Maldonado AE, D'Amore PA. Coordinated vascular endothelial growth factor expression and signaling during skeletal myogenic differentiation. Mol Biol Cell. 2008;19:994–1006. doi: 10.1091/mbc.E07-09-0856. [DOI] [PMC free article] [PubMed] [Google Scholar]
- Carson JA, Nettleton D, Reecy JM. Differential gene expression in the rat soleus muscle during early work overload-induced hypertrophy. FASEB J. 2002;16:207–209. doi: 10.1096/fj.01-0544fje. [DOI] [PubMed] [Google Scholar]
- Claesson-Welsh L. VEGF-B taken to our hearts: specific effect of VEGF-B in myocardial ischemia. Arterioscler Thromb Vasc Biol. 2008;28:1575–1576. doi: 10.1161/ATVBAHA.108.170878. [DOI] [PubMed] [Google Scholar]
- Dameron KM, Volpert OV, Tainsky MA, Bouck N. Control of angiogenesis in fibroblasts by p53 regulation of thrombospondin-1. Science. 1994;5178:1582–1584. doi: 10.1126/science.7521539. [DOI] [PubMed] [Google Scholar]
- Däpp C, Schmutz S, Hoppeler H, Flück M. Transcriptional reprogramming and ultrastructure during atrophy and recovery of mouse soleus muscle. Physiol Genomics. 2004;20:97–107. doi: 10.1152/physiolgenomics.00100.2004. [DOI] [PubMed] [Google Scholar]
- Degens H, Moore JA, Alway SE. Vascular endothelial growth factor, capillarization, and function of the rat plantaris muscle at the onset of hypertrophy. Jpn J Physiol. 2003;53:181–191. doi: 10.2170/jjphysiol.53.181. [DOI] [PubMed] [Google Scholar]
- Desplanches D, Mayet MH, Sempore B, Flandrois R. Structural and functional responses to prolonged hindlimb suspension in rat muscle. J Appl Physiol. 1987;63:558–563. doi: 10.1152/jappl.1987.63.2.558. [DOI] [PubMed] [Google Scholar]
- Egginton S. Invited review: activity-induced angiogenesis. Pflugers Arch. 2009;457:963–977. doi: 10.1007/s00424-008-0563-9. [DOI] [PubMed] [Google Scholar]
- Eischen CM, Lozano G. p53 and MDM2: antagonists or partners in crime? Cancer Cell. 2009;15:161–162. doi: 10.1016/j.ccr.2009.02.004. [DOI] [PubMed] [Google Scholar]
- Ferrara N. Vascular endothelial growth factor. Arterioscler Thromb Vasc Biol. 2009;29:789–791. doi: 10.1161/ATVBAHA.108.179663. [DOI] [PubMed] [Google Scholar]
- Flück M, Schmutz S, Wittwer M, Hoppeler H, Desplanches D. Transcriptional reprogramming during reloading of atrophied rat soleus muscle. Am J Physiol Regul Integr Comp Physiol. 2005;289:R4–14. doi: 10.1152/ajpregu.00833.2004. [DOI] [PubMed] [Google Scholar]
- Fujino H, Kohzuki H, Takeda I, Kiyooka T, Miyasaka T, Mohri S, Shimizu J, Kajiya F. Regression of capillary network in atrophied soleus muscle induced by hindlimb unweighting. J Appl Physiol. 2005;98:1407–1413. doi: 10.1152/japplphysiol.00961.2004. [DOI] [PubMed] [Google Scholar]
- Hagberg CE, Falkevall A, Wang X, Larsson E, Huusko J, Nilsson I, van Meeteren LA, Samen E, Lu L, Vanwildemeersch M, Klar J, Genove G, Pietras K, Stone-Elander S, Claesson-Welsh L, Ylä-Herttuala S, Lindahl P, Eriksson U. Vascular endothelial growth factor B controls endothelial fatty acid uptake. Nature. 2010;464:917–921. doi: 10.1038/nature08945. [DOI] [PubMed] [Google Scholar]
- Hudlicka O, Brown M, Egginton S. Angiogenesis in skeletal and cardiac muscle. Physiol Rev. 1992;72:369–417. doi: 10.1152/physrev.1992.72.2.369. [DOI] [PubMed] [Google Scholar]
- Hudlicka O, Brown MD. Adaptation of skeletal muscle microvasculature to increased or decreased blood flow: role of shear stress, nitric oxide and vascular endothelial growth factor. J Vasc Res. 2009;46:504–512. doi: 10.1159/000226127. [DOI] [PubMed] [Google Scholar]
- Hyatt JP, McCall GE, Kander EM, Zhong H, Roy RR, Huey KA. PAX3/7 expression coincides with MyoD during chronic skeletal muscle overload. Muscle Nerve. 2008;38:861–866. doi: 10.1002/mus.21006. [DOI] [PMC free article] [PubMed] [Google Scholar]
- Kano Y, Shimegi S, Takahashi H, Masuda K, Katsuta S. Changes in capillary luminal diameter in rat soleus muscle after hind-limb suspension. Acta Physiol Scand. 2000;169:271–276. doi: 10.1046/j.1365-201x.2000.00743.x. [DOI] [PubMed] [Google Scholar]
- Li X. VEGF-B: a thing of beauty. Cell Res. 2010;20:741–744. doi: 10.1038/cr.2010.77. [DOI] [PMC free article] [PubMed] [Google Scholar]
- Li Y, Zhang F, Nagai N, Tang Z, Zhang S, Scotney P, Lennartsson J, Zhu C, Qu Y, Fang C, Hua J, Matsuo O, Fong GH, Ding H, Cao Y, Becker KG, Nash A, Heldin CH, Li X. VEGF-B inhibits apoptosis via VEGFR-1-mediated suppression of the expression of BH3-only protein genes in mice and rats. J Clin Invest. 2008;118:913–923. doi: 10.1172/JCI33673. [DOI] [PMC free article] [PubMed] [Google Scholar]
- McDonald KS, Delp MD, Fitts RH. Fatigability and blood flow in the rat gastrocnemius-plantaris-soleus after hindlimb suspension. J Appl Physiol. 1992a;73:1135–1140. doi: 10.1152/jappl.1992.73.3.1135. [DOI] [PubMed] [Google Scholar]
- McDonald KS, Delp MD, Fitts RH. Effect of hindlimb unweighting on tissue blood flow in the rat. J Appl Physiol. 1992b;72:2210–2218. doi: 10.1152/jappl.1992.72.6.2210. [DOI] [PubMed] [Google Scholar]
- Machida S, Booth FW. Regrowth of skeletal muscle atrophied from inactivity. Med Sci Sports Exerc. 2004;36:52–59. doi: 10.1249/01.MSS.0000106175.24978.84. [DOI] [PubMed] [Google Scholar]
- Malek MH, Olfert IM. Global deletion of thrombospondin-1 increases cardiac and skeletal muscle capillarity and exercise capacity in mice. Exp Physiol. 2009;94:749–760. doi: 10.1113/expphysiol.2008.045989. [DOI] [PubMed] [Google Scholar]
- Malek MH, Olfert IM, Esposito F. Detraining losses of skeletal muscle capillarization are associated with vascular endothelial growth factor protein expression in rats. Exp Physiol. 2010;95:359–368. doi: 10.1113/expphysiol.2009.050369. [DOI] [PubMed] [Google Scholar]
- Milkiewicz M, Hudlicka O, Shiner R, Egginton S, Brown MD. Vascular endothelial growth factor mRNA and protein do not change in parallel during non-inflammatory skeletal muscle ischaemia in rat. J Physiol. 2006;577:671–678. doi: 10.1113/jphysiol.2006.113357. [DOI] [PMC free article] [PubMed] [Google Scholar]
- Morey-Holton ER, Globus RK. Hindlimb unloading rodent model: technical aspects. J Appl Physiol. 2002;92:1367–1377. doi: 10.1152/japplphysiol.00969.2001. [DOI] [PubMed] [Google Scholar]
- Mozdziak PE, Greaser ML, Schultz E. Myogenin, MyoD, and myosin expression after pharmacologically and surgically induced hypertrophy. J Appl Physiol. 1998;84:1359–1364. doi: 10.1152/jappl.1998.84.4.1359. [DOI] [PubMed] [Google Scholar]
- Olfert IM, Breen EC, Gavin TP, Wagner PD. Temporal thrombospondin-1 mRNA response in skeletal muscle exposed to acute and chronic exercise. Growth Factors. 2006;24:253–259. doi: 10.1080/08977190601000111. [DOI] [PubMed] [Google Scholar]
- Olfert IM, Howlett RA, Tang K, Dalton ND, Gu Y, Peterson KL, Wagner PD, Breen EC. Muscle-specific VEGF deficiency greatly reduces exercise endurance in mice. J Physiol. 2009;587:1755–1767. doi: 10.1113/jphysiol.2008.164384. [DOI] [PMC free article] [PubMed] [Google Scholar]
- Olofsson B, Pajusola K, Kaipainen A, von Euler G, Joukov V, Saksela O, Orpana A, Pettersson RF, Alitalo K, Eriksson U. Vascular endothelial growth factor B, a novel growth factor for endothelial cells. Proc Natl Acad Sci U S A. 1996a;93:2576–2581. doi: 10.1073/pnas.93.6.2576. [DOI] [PMC free article] [PubMed] [Google Scholar]
- Olofsson B, Pajusola K, von Euler G, Chilov D, Alitalo K, Eriksson U. Genomic organization of the mouse and human genes for vascular endothelial growth factor B (VEGF-B) and characterization of a second splice isoform. J Biol Chem. 1996b;271:19310–19317. doi: 10.1074/jbc.271.32.19310. [DOI] [PubMed] [Google Scholar]
- Pal S, Datta K, Mukhopadhyay D. Central role of p53 on regulation of vascular permeability factor/vascular endothelial growth factor (VPF/VEGF) expression in mammary carcinoma. Cancer Res. 2001;61:6952–6957. [PubMed] [Google Scholar]
- Parvaresh K, Huber A, Brochin R, Bacon P, McCall G, Huey K, Hyatt JP. Acute VEGF expression during hypertrophy is muscle phenotype-specific and localizes as a striated pattern within fibers. Exp Physiol. 2010 doi: 10.1113/expphysiol.2010.053959. in press. [DOI] [PubMed] [Google Scholar]
- Prior BM, Yang HT, Terjung RL. What makes vessels grow with exercise training. J Appl Physiol. 2004;97:1119–1128. doi: 10.1152/japplphysiol.00035.2004. [DOI] [PubMed] [Google Scholar]
- Qin XQ, Livingston DM, Kaelin WG, Jr, Adams PD. Deregulated transcription factor E2F-1 expression leads to S-phase entry and p53-mediated apoptosis. Proc Natl Acad Sci U S A. 1994;91:10918–10922. doi: 10.1073/pnas.91.23.10918. [DOI] [PMC free article] [PubMed] [Google Scholar]
- Ravi R, Mookerjee B, Bhujwalla ZM, Sutter CH, Artemov D, Zeng Q, Dillehay LE, Madan A, Semenza GL, Bedi A. Regulation of tumor angiogenesis by p53-induced degradation of hypoxia-inducible factor 1α. Genes Dev. 2000;14:34–44. [PMC free article] [PubMed] [Google Scholar]
- Ren B, Yee KO, Lawler J, Khosravi-Far R. Regulation of tumor angiogenesis by thrombospondin-1. Biochim Biophys Acta. 2006;1765:178–188. doi: 10.1016/j.bbcan.2005.11.002. [DOI] [PubMed] [Google Scholar]
- Roudier E, Chapados N, Decary S, Gineste C, Le Bel C, Lavoie JM, Bergeron R, Birot O. Angiomotin p80/p130 ratio: a new indicator of exercise-induced angiogenic activity in skeletal muscles from obese and non-obese rats. J Physiol. 2009;587:4105–4119. doi: 10.1113/jphysiol.2009.175554. [DOI] [PMC free article] [PubMed] [Google Scholar]
- Silvestre JS, Tamarat R, Ebrahimian TG, Le-Roux A, Clergue M, Emmanuel F, Duriez M, Schwartz B, Branellec D, Lévy BI. Vascular endothelial growth factor-B promotes in vivo angiogenesis. Circ Res. 2003;93:114–123. doi: 10.1161/01.RES.0000081594.21764.44. [DOI] [PubMed] [Google Scholar]
- Siu PM, Pistilli EE, Murlasits Z, Alway SE. Hindlimb unloading increases muscle content of cytosolic but not nuclear Id2 and p53 proteins in young adult and aged rats. J Appl Physiol. 2006;100:907–916. doi: 10.1152/japplphysiol.01012.2005. [DOI] [PubMed] [Google Scholar]
- Su F, Pascal LE, Xiao W, Wang Z. Tumor suppressor U19/EAF2 regulates thrombospondin-1 expression via p53. Oncogene. 2010;29:421–431. doi: 10.1038/onc.2009.326. [DOI] [PMC free article] [PubMed] [Google Scholar]
- Tang K, Breen EC, Gerber HP, Ferrara NM, Wagner PD. Capillary regression in vascular endothelial growth factor-deficient skeletal muscle. Physiol Genomics. 2004;18:63–69. doi: 10.1152/physiolgenomics.00023.2004. [DOI] [PubMed] [Google Scholar]
- Vousden KH, Prives C. Blinded by the light: The growing complexity of p53. Cell. 2009;137:413–431. doi: 10.1016/j.cell.2009.04.037. [DOI] [PubMed] [Google Scholar]
- Wagatsuma A. Effect of hindlimb unweighting on expression of hypoxia-inducible factor-1α vascular endothelial growth factor, angiopoietin, and their receptors in mouse skeletal muscle. Physiol Res. 2008;57:613–620. doi: 10.33549/physiolres.931288. [DOI] [PubMed] [Google Scholar]
- Williams JL, Weichert A, Zakrzewicz A, Da Silva-Azevedo L, Pries AR, Baum O, Egginton S. Differential gene and protein expression in abluminal sprouting and intraluminal splitting forms of angiogenesis. Clin Sci (Lond) 2006a;110:587–595. doi: 10.1042/CS20050185. [DOI] [PubMed] [Google Scholar]
- Williams JL, Cartland D, Rudge JS, Egginton S. VEGF trap abolishes shear stress- and overload-dependent angiogenesis in skeletal muscle. Microcirculation. 2006b;13:499–509. doi: 10.1080/10739680600785717. [DOI] [PubMed] [Google Scholar]