

Abstract
Chemoreceptors in the carotid bodies sense arterial oxygen tension and regulate respiration. Isolated carotid body glomus cells also sense glucose, and animal studies have shown the carotid bodies play a role in the counterregulatory response to hypoglycaemia. Thus, we hypothesized that glucose infusion rate would be augmented and neuro-hormonal counterregulation blunted during hypoglycaemia when the carotid bodies were desensitized by hyperoxia. Seven healthy adults (four male, three female) underwent two 180 min hyperinsulinaemic (2 mU (kg fat-free mass (FFM))−1 min−1), hypoglycaemic (3.33 mmol l−1) clamps 1 week apart, randomized to either normoxia (arterial  (
( ) 111 ± 6.3 mmHg) or hyperoxia (
 345 ± 80.6 mmHg) (P < 0.05). Plasma glucose concentrations were similar during normoxia and hyperoxia at baseline (5.52 ± 0.15 vs. 5.55 ± 0.13 μmol ml−1) and during the clamp (3.4 ± 0.05 vs. 3.3 ± 0.05 μmol ml−1). The glucose infusion rate was 44.2 ± 3.5% higher (P < 0.01) during hyperoxia than normoxia at steady state during the clamp (28.2 ± 0.15 vs. 42.7 ± 0.65 μmol (kg FFM)−1 min−1; P < 0.01). Area under the curve values (expressed as percentage normoxia response) for counterregulatory hormones during hypoglycaemia were significantly suppressed by hyperoxia (noradrenaline 50.7 ± 5.2%, adrenaline 62.6 ± 3.3%, cortisol 63.2 ± 2.1%, growth hormone 53.1 ± 2.7%, glucagon 48.6 ± 2.1%, all P < 0.05 vs. normoxia). These data support the idea that the carotid bodies respond to glucose and play a role in the counterregulatory response to hypoglycaemia in humans.
Introduction
The carotid body includes Type I glomus cells that secrete neurotransmitters and activate sensory afferents in response to reduced partial pressure of oxygen in arterial blood ( ). This secretory response also occurs during exposure to low glucose concentrations in vitro (Pardal & Lopez-Barneo, 2002). Additionally, the cellular response to low glucose is influenced by the local
  such that secretory response is augmented when
  is lower (Pardal & Lopez-Barneo, 2002). These observations raise the possibility that the carotid bodies play a role in sensing hypoglycaemia in vivo. Along these lines, carotid body resection in dogs drastically impairs the systemic counterregulatory responses to hypoglycaemia (Koyama et al. 2000).
One approach to study this topic in humans is to use hyperoxia to acutely desensitize the carotid bodies. In humans hyperoxia can depress minute ventilation (Downes & Lambertsen, 1966), and inhalation of 100% oxygen is thought to dramatically reduce peripheral chemoreceptor activity (Lahiri & DeLaney, 1975). Hyperoxia also suppresses afferent nerve traffic from the carotid bodies in animals (Fitzgerald & Lahiri, 1986).
With this information as a background, we sought to test the role of the carotid bodies in the systemic counterregulatory response to hypoglycaemia in humans by using hyperoxia to acutely desensitize the carotid bodies. On separate days we performed paired hyperinsulinaemic hypoglycaemic clamps in healthy humans exposed to normoxia or hyperoxia. We hypothesized that the glucose infusion rate would be augmented and neuro-hormonal counterregulation blunted during hypoglycaemia when the carotid bodies were desensitized by hyperoxia.
Methods
Ethical approval
All experiments and procedures were approved by the Institutional Review Board at Mayo Clinic. Informed consent was obtained in writing from all subjects prior to study enrollment and testing. The studies conformed to the Declaration of Helsinki.
Subjects
Subjects were healthy non-obese (BMI <28 kg m−2) persons between 21 and 35 years old. Exclusion criteria included fasting blood glucose >5.5 mmol l−1, hypertension (<140/90 mmHg), dyslipidaemia (low density lipoprotein ≥130 mg dl−1, high density lipoprotein <40 mg dl−1, triglycerides ≥200 mg dl−1), smoking, heart disease, diabetes, diagnosed autonomic disorders, and other conditions or medications that might alter metabolic regulation. Subjects who engaged in regular physical exercise programmes or were actively losing weight were excluded. Dietary advice was provided by the research dietician to ensure that subjects maintained constant body weight 2 weeks prior to study. Body composition was measured using dual energy x-ray absorptiometry (DEXA, Lunar iDXA software version 6.10, GE Healthcare Technologies, Madison, WI, USA). Due to the repeated measures design of the study it was not possible to control for menstrual cycle phase in the female subjects; however, counterregulation to hypoglycaemia is similar in the follicular and luteal phases of the menstrual cycle (Diamond et al. 1993).
Subject monitoring
Prior to starting the glucose clamp, a 20-gauge catheter for blood sampling and blood pressure monitoring was placed in a brachial artery under ultrasound guidance after local anaesthesia. Two intravenous catheters were placed in the arm opposite the brachial arterial catheter for infusions. For patient safety, heart rate was monitored with a five-lead electrocardiogram, respirations via a pneumobelt, and arterial oxygen saturation by a pulse oximeter.
Hypoglycaemic clamps
The experimental time-line is shown in Fig. 1. Subjects were admitted to the Clinical Research Unit (CRU) of the Mayo Clinic at 17.00 h on the evening prior to study. A standard 10 cal kg−1 meal (55% carbohydrate, 30% fat and 15% protein) was eaten between 18.00 and 18.30 h and the subject fasted thereafter until the end of the study. Sips of water were permitted during the night. In the morning, the brachial artery catheter and intravenous lines were placed as described above, intravenous insulin (Novolin, Novo Nordisk Inc., Princeton, NJ, USA) was infused at a constant rate of 2.0 mU (kg fat-free mass (FFM))−1 min−1 from protocol time (T) 0 to T180 minutes, and exogenous glucose (50% dextrose solution; Hospira, Inc., Lake Forest, IL, USA) was infused in amounts sufficient to maintain glucose concentrations at hypoglycaemic levels (∼3.3 mmol l−1; 60 mg dl−1) (Lecavalier et al. 1989). From T0 until the end of the study, subjects breathed either normoxic or hyperoxic gas via a face mask as described below. Plasma glucose was measured every 10 min at the bedside using a glucose oxidase method (Analox Instruments USA Inc., Lunenberg, MA, USA).
Figure 1. Experimental time-line.
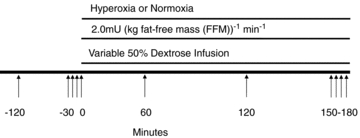
A detailed explanation for hypoglycaemic clamp is given in Methods. Arrows indicate blood draws.
Hyperoxia and normoxia
During hyperoxia trials subjects breathed 100% oxygen through a face mask connected to a non-rebreathing valve and large meteorological balloon which served as a volume reservoir. On the normoxia day, the identical set-up was used except the bag was filled with air (21% oxygen). Normoxia and hyperoxia trials occurred on different days separated by 1 week in random order. Arterial blood gases were measured at baseline and every hour during the clamp.
Analytical methods
Arterial blood was drawn for glucose and hormone measurements (insulin, C-peptide, glucagon, growth hormone, cortisol, adrenaline, dopamine and noradrenaline) at T –120, –30, –20, –10 and 0 min and during the glucose clamp at 60, 120, 150, 160, 170 and 180 min. All blood samples were immediately placed on ice and centrifuged at 4°C after which the plasma was removed and stored at −80°C until analysis. Plasma insulin was assessed using a two-site immunoenzymatic assay performed on the DxI automated immunoassay system (Beckman Instruments, Chaska, MN, USA). Cortisol was measured by a competitive binding immunoenzymatic assay on the DxI automated immunoassay system (Beckman Instruments). C-Peptide was measured by a two-site immunenzymatic sandwich assay on the Cobas e411 (Roche Diagnostics, Indianapolis, IN, USA). Glucagon was measured by radioimmunoassay (Linco Research, St Louis, MO, USA). Plasma catecholamines were measured with reverse phase high performance liquid chromatography with electrochaemical detection after extraction with activated alumina.
Data analysis and statistics
Glucose infusion rate (μmol (kg FFM)−1 min−1) was the primary endpoint measured. Each subject was assessed under both experimental conditions (normoxia and hyperoxia). In all cases, analyses were performed using mixed-effects linear models (repeated-measures analysis) taking into account the repeated measures study design. Time was a repeated factor for all analyses. Experimental condition was modelled as a repeated variable. The time-by-group interaction term was included in the model and supplemental analyses were performed to compare groups at each time period using Student's t test for paired data. For hormones, an area under the curve above baseline was calculated for each hormone in both conditions over time and expressed as a percentage of the normoxia response. Where relevant, baseline values were calculated as an average of T –30, –20, –10 and 0 min and clamp values as an average of T150, 160, 170 and 180 min. P values of <0.05 were considered statistically significant. SigmaStat 2.03 software (Systat Software Inc., San Jose, CA, USA) was used for analysis.
Results
Subject demographics
Seven healthy adults (four male, three female) were studied. Subject demographics and screening laboratory values are summarized in Table 1.
Table 1.
Subject Demographics and screening laboratory values
| Average ± s.d. | |
|---|---|
| Age (years) | 26.7 ± 2.8 |
| Height (m) | 1.7 ± 0.1 |
| Weight (kg) | 74.7 ± 12.2 |
| Lean Body Mass (kg) | 53.1 ± 11.2 |
| BMI (kg m−2) | 25.0 ± 2.2 |
| Heart Rate (bpm) | 60.9 ± 7.0 |
| Systolic Blood Pressure (mmHg) | 113.6 ± 14.2 |
| Diastolic Blood Pressure (mmHg) | 61.9 ± 8.3 |
| Respiration (rate min−1) | 15.7 ± 1.8 |
| Hemoglobin (g dL−1) | 14.3 ± 1.1 |
| Hematocrit (%) | 41.7 ± 3.2 |
| Fasting Plasma Glucose (mg dL−1) | 86.3 ± 4.6 |
| Cholesterol (mg dL−1) | 166.1 ± 33.0 |
| Triglycerides (mg dL−1) | 77.1 ± 34.0 |
| High Density Lipoprotein (mg dL−1) | 55.4 ± 11.8 |
| Low Density Lipoprotein, Calculated (mg dL−1) | 95.3 ± 32.3 |
Data represent mean values ± standard deviation (s.d.) from all subjects. n = 7.
Blood gases
 and
and  were measured using an automatic blood gas analyser (Radiometer ABL700, Westlake, OH, USA) every 60 min. The average
  during normoxia was 111 ± 6.3 mmHg and significantly elevated during hyperoxia to 345 ± 80.6 mmHg (P < 0.05, Fig. 2A). Similarly, oxygenated haemoglobin measures were significantly higher under hyperoxia conditions at each time point (P < 0.01 for all).
  was similar throughout both conditions (Fig. 2B, not significant (NS)).
Figure 2. Arterial oxygen tension is significantly elevated and arterial carbon dioxide tension are maintained during the hypoglycaemic clamp.
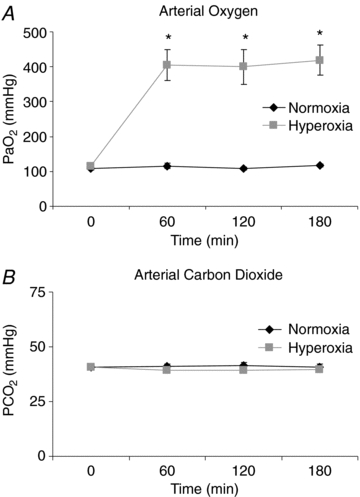
A, arterial oxygen time course; B, arterial carbon dioxide time course. Black symbols: normoxia, grey symbols: hyperoxia. Values are means ± s.e.m., n = 7.
Plasma glucose, insulin and C-peptide
Plasma glucose concentrations were similar during normoxia and hyperoxia at baseline (5.52 ± 0.15 vs. 5.55 ± 0.13 μmol ml−1) and during the clamp (3.4 ± 0.05 vs. 3.3 ± 0.05 μmol ml−1; Fig. 3A, NS). Baseline and clamp insulin concentrations were no different between subjects on normoxia and hyperoxia study days (baseline: 36.4 ± 6.7 vs. 32.3 ± 4.9 pmol l−1 and clamp: 944.2 ± 86.8 vs. 916.1 ± 75.9 pmol l−1; Fig. 3B, NS). Baseline C-peptide did not differ between study days (normoxia vs. hyperoxia 0.56 ± 0.04 vs. 0.56 ± 0.04 nmol l−1) and was completely suppressed during insulin infusion during both normoxia and hyperoxia (0.08 ± 0.0 vs. 0.04 ± 0.0 nmol l−1; NS) (Fig. 3C).
Figure 3. High dose insulin infusion reduced plasma glucose and C-peptide during normoxia and hyperoxia.
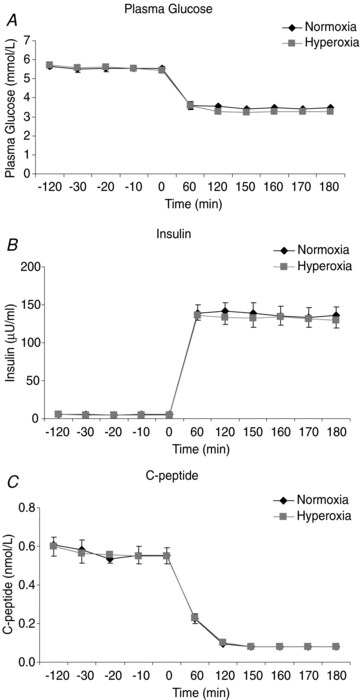
Plasma glucose (A), insulin (B) and C-peptide (C) during hypoglycaemic clamp with concurrent normoxia or hyperoxia. Normoxia: black symbols, hyperoxia: grey symbols. Points are means ± s.e.m., n = 7.
Glucose infusion rate
Despite similar plasma glucose concentrations during normoxia and hyperoxia, the glucose infusion rate required to maintain hypoglycaemia was significantly higher during hyperoxia compared to normoxia (42.7 ± 0.65 vs. 28.2 ± 0.15 μmol kg−1 min−1; P < 0.01) by 44.2 ± 3.5% (Fig. 4A). The higher glucose infusion rate on the hyperoxia study day was observed in all subjects (Fig. 4B).
Figure 4. Glucose infusion rate is significantly higher under hyperoxic conditions.
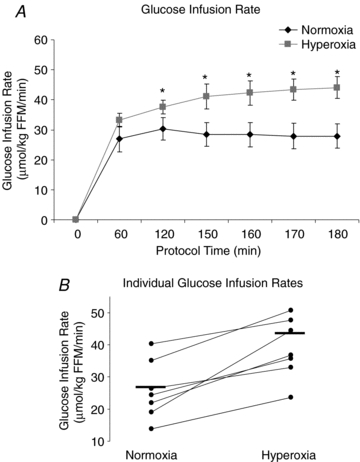
A, time course for glucose infusion rate under normoxia and hyperoxia. Normoxia: black symbols, hyperoxia: grey symbols. Values are means ± s.e.m. Significance denoted as *P < 0.05. B, glucose infusion rate at steady state during normoxia and hyperoxia for each subject. Mean values are indicated with a horizontal line. n = 7.
Counterregulatory hormones
Adrenaline (Fig. 5B), cortisol (Fig. 5D), glucagon (Fig. 5E), and growth hormone (Fig. 5F) concentrations in response to hypoglycaemia were significantly lower (P < 0.05) during hyperoxia vs. normoxia. Noradrenaline (Fig. 5A) tended to be lower during hyperoxia vs. normoxia, but only reached significance at the end of the study. In contrast, dopamine (Fig. 5C) concentrations did not differ on the two study days; therefore the area under the curve was not included for dopamine. The area under the curve values (Fig. 5G) for all other counterregulatory hormones were significantly lower during hyperoxia vs. normoxia (noradrenaline 50.7 ± 5.2%, adrenaline 62.6 ± 3.3%, cortisol 63.2 ± 2.1%, growth hormone 53.1 ± 2.7%, glucagon 48.6 ± 2.1%, all P < 0.05 vs. normoxia).
Figure 5. Counterregulatory hormone response to hypoglycaemia was blunted under hyperoxic conditions.
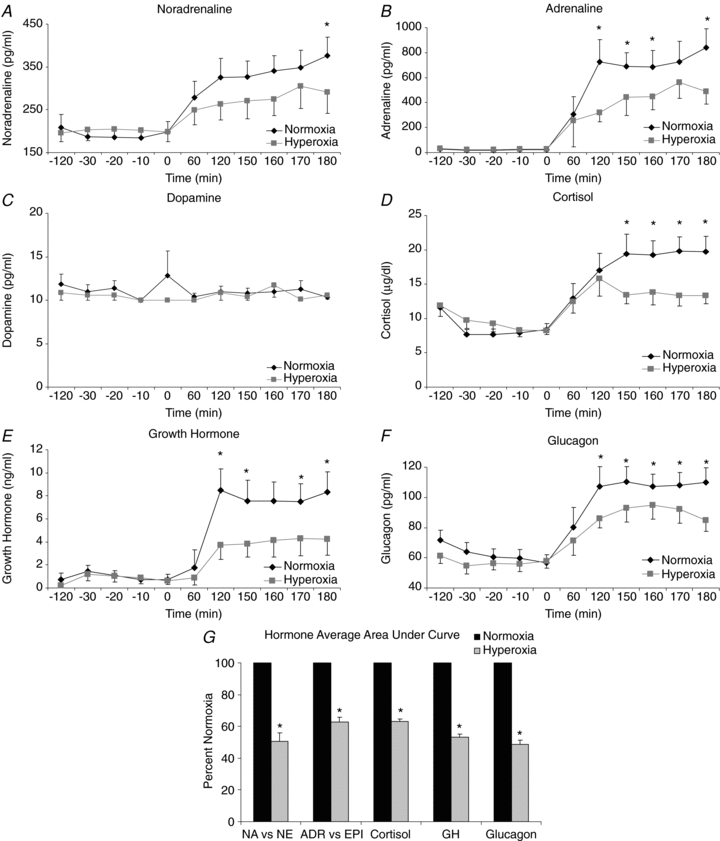
Time courses for counterregulatory hormones are shown. A, noradrenaline; B, adrenaline; C, dopamine; D, cortisol; E, growth hormone; and F, glucagon. Normoxia: black symbols, hyperoxia: grey symbols. Significance denoted as *P < 0.05 for differences between normoxia and hyperoxia. G area under the curve for counterregulatory hormones was calculated. Normoxia was normalized to 100% and hyperoxia is shown as a percentage of normoxia. Dopamine was not included in area under the curve calculations since there was no significant difference between normoxia and hyperoxia. Normoxia: black symbols, hyperoxia: grey symbols. Significance denoted as *P < 0.05 for differences between normoxia and hyperoxia. n = 7.
Discussion
Our study provides evidence that the carotid bodies play an important role in blood glucose homeostasis in humans. This is based on two novel findings: (1) the exogenous glucose infusion rate during the hyperinsulinaemic hypoglycaemic clamps was ∼50% higher during desensitization of the carotid bodies with hyperoxia, and (2) hyperoxia during hypoglycaemia resulted in a marked blunting of the counterregulatory hormone responses. These findings are consistent with cellular studies that show that Type I glomus cells in the carotid bodies are responsive to low glucose as well as oxygen (Pardal & Lopez-Barneo, 2002). Our data are also consistent with animal data showing the carotid bodies play an integral role in blood glucose homeostasis in vivo (Alvarez-Buylla et al. 1997; Koyama et al. 2000, 2001).
Using a similar approach to that described in the carotid body resected dog model (Koyama et al. 2000), we ‘inactivated’ the carotid bodies in humans by exposure to hyperoxia in conjunction with a hypoglycaemic clamp (see ‘Mechanisms’ below for further discussion). Hyperoxia results in a depression of minute ventilation (Downes & Lambertsen, 1966) consistent with the fact that afferent activity from the carotid sinus nerve is reduced by hyperoxia. Further, both the average neural activity and single fibre activity in cat carotid sinus nerves decreases with a rise in arterial oxygen tension and is essentially abolished when  exceeds 200 mmHg (Fitzgerald & Lahiri, 1986). Using a non-rebreathing valve with 100% oxygen we achieved an average
  of 345 mmHg, which is sufficient to cause attenuation of carotid sinus nerve traffic. Since the carotid body is also activated by carbon dioxide, it is important to note that there were no differences in
  between study days. Therefore, (1) subjects were normocapnic, and (2) there was no difference in
  .
.
The present data show that exposure to hyperoxia during hypoglycaemia blunted the release of numerous counterregulatory hormones, including the primary counterregulatory hormones to acute hypoglycaemia glucagon and adrenaline (Gerich et al. 1979). Hyperoxia also resulted in a dramatic increase in glucose infusion rate during the clamp. These findings are consistent with studies in carotid body resected dogs (Koyama et al. 2000, 2001) that showed that a significant increase in exogenous glucose infusion rate was required in carotid body denervated dogs during hypoglycaemic clamps. This was accompanied by an abolition of the glucagon response and a blunting of cortisol response to hypoglycaemia (Koyama et al. 2000).
Similar to our interpretation of the current data, the authors concluded that these responses indicated that normal counterregulatory hormonal responses to hypoglycaemia and the associated increases in endogenous glucose production are dependent in part on intact carotid chemoreceptors sensing the reduced blood glucose. In a related study, intact carotid bodies were also required for an appropriate neuroendocrine response to prolonged exercise and carotid body resected dogs did not show the normal exercise-induced increase in glucagon, noradrenaline, or cortisol (Koyama et al. 2001) during 150 min of treadmill running. Additionally, chemical stimulation of intact carotid bodies with sodium cyanide in an anaesthetized rat model resulted in glucose mobilization and hyperglycaemia (Alvarez-Buylla et al. 1997), further supporting the hypothesis that the carotid bodies play a role in glucose homeostasis.
In contrast to our data and the evidence cited above, there is a single report (Ward et al. 2009) in humans suggesting that the carotid bodies do not play a role in hypoglycaemic counterregulation and there are some conflicting reports in cell and animal studies as well (Bin-Jaliah et al. 2004; Conde et al. 2007) addressed below. Our results in humans are similar to those of Ward et al., who reported a ∼10% increase in total glucose infused with hyperoxia while we reported ∼45% increase in glucose infusion rate during hyperoxia. In contrast to our findings, Ward et al. did not find a blunted counterregulatory hormone response during hypoglycaemia with hyperoxia and concluded that their results were due to a small increase in insulin sensitivity and not due to a role for the carotid bodies in glucose regulation. In this context, there are key differences between Ward et al.'s report and our study. First, Ward et al. used 50% inspired oxygen and they noted that they may not have achieved appropriate suppression of the carotid bodies. We used 100% inspired oxygen and achieved sustained elevations in  that should have resulted in more complete carotid body desensitization. Second, we used a single step clamp and achieved target hypoglycaemic values within 60 min that were maintained for the duration of the study, while Ward et al. tapered blood glucose during a multi-step clamp. This is important because the rate of glucose decline influences release of counterregulatory hormones to hypoglycaemia (Fanelli et al. 2003). Therefore it is possible that differences in experimental design explain the disparate results.
Mechanisms
Although we did not directly test the mechanisms by which hypoglycaemia interacts with the carotid body glomus cells in humans, a discussion of potential mechanisms is appropriate. The carotid bodies are the main peripheral chemoreceptors and respond robustly to hypoxaemia both in vitro and in vivo, but their potential role as glucose sensors in vivo, while provocative, is less clear. Isolated Type I glomus cells from the carotid bodies release neurotransmitter in response to both decreased extracellular glucose and hypoxia (Pardal & Lopez-Barneo, 2002). This sensing of low glucose by Type I glomus cells involves the inhibition of voltage-dependent potassium channels leading to cellular depolarization, calcium influx, and secretion of a variety of neuropeptides and catecholamines that stimulate local afferents associated with the carotid sinus nerve. In addition, hypoglycaemia has been shown to activate a standing sodium current that depolarizes glomus cells in a dose-dependent manner (Garcia-Fernandez et al. 2007). Similar secretory responses occur in response to hypoxia (Nurse, 2005), and both low glucose and hypoxia induce transmitter release from a common pool of vesicles (Pardal & Lopez-Barneo, 2002). Using a different carotid body preparation (glomus cell–petrosal neuron synapse), it has also been shown that glomus cells depolarize to low glucose with an additive effect of low glucose and hypoxia (Zhang et al. 2007). These studies provide a powerful rationale for our overall hypothesis, our specific study design, and the interpretation of our data.
In this context, the proposed mechanism for our findings is that hyperoxia desensitized the carotid bodies limiting the ability of the carotid chemoreceptor cells to release neurotransmitter in response to hypoglycaemia. Therefore, carotid sinus nerve afferent activation to hypoglycaemia under hyperoxic conditions was reduced along with attenuated central activation in the nucleus tractus solitarii (de Campos Cruz et al. 2010). This sequence of events then leads to blunted counterregulatory hormonal responses. Importantly, this interpretation also explains the increased glucose infusion rate we observed during hyperoxic hypoglycaemia.
While exposure to low glucose has been reported to activate transmitter release from Type I glomus cells, it is not universally accepted that glucose per se is the direct stimulus to carotid glomus cells or that exposure to low glucose induces afferent activation. In rats, low glucose did not induce catecholamine or ATP release from the carotid body, nor did it result in activation of carotid sinus nerve afferents (Bin-Jaliah et al. 2004; Conde et al. 2007). As a technical note on these studies, the preparation used included the whole carotid body plus afferent nerve superfused via a bath solution rather than through the artery. Since the carotid body has several layers of dense connective tissue it is not known whether the hypoglycaemic solution reached the glomus cell membrane. Additionally, insulin-induced hypoglycaemia in rats results in increased ventilation suggestive of carotid body involvement in the response. There is no hypoglycaemia-induced ventilatory response in carotid body resected rats. This response in control rats was attributed to an increase in metabolic rate due to hypoglycaemia rather than the stimulatory effects of low glucose on the carotid bodies (Bin-Jaliah et al. 2004). Importantly, Bin-Jaliah et al. do not contend that these data are necessarily in disagreement with the denervated dog model presented by Koyama et al., only that the stimulus to carotid-body activation with hypoglycaemia is not low glucose per se.
We have presented hyperoxia-induced carotid body desensitization as analogous to the carotid body surgical resection approach used by Koyama et al. (2000). However, surgical resection of the carotid bodies may also result in denervation of the carotid baroreceptors which lie in close anatomical proximity (Timmers et al. 2003). In this context, activation of the sympathetic nervous system is in an important part of the response to hypoglycaemia and baroreceptor afferents are sympathoinhibitory so their removal/inactivation (denervation or reduced BP) should cause more sympathetic outflow and if anything augment endogenous glucose production and lower glucose infusion rate. Thus, any loss of baroreceptor input should work against the primary finding of Koyama et al. by enhancing sympathetic outflow. Since Koyama et al.'s study and our study show similar directional results, it is unclear if potential disruption of baroreceptors in the model used by Koyama et al. influenced the counterregulatory responses to hypoglycaemia in a major way.
Despite the conflicting evidence discussed above, there are a number of observations in humans consistent with our data and interpretation: (1) acute reductions in oxygen saturation in healthy subjects causes a significant decrease in glucose infusion rate during euglycaemic clamp (Oltmanns et al. 2004); (2) in chronic obstructive pulmonary disease (COPD) patients, chronic hypoxia is associated with impaired glucose tolerance while COPD patients with more normoxic blood gases have normal responses to oral glucose tolerance testing (Hjalmarsen et al. 1996); (3) hypoxic COPD patients acutely placed on supplemental oxygen have an immediate improvement in glucose tolerance and insulin sensitivity during euglycaemic glucose clamps (Jakobsson & Jorfeldt, 2006); (4) 2 days of treatment with continuous positive airway pressure improves glucose tolerance and insulin resistance in metabolic syndrome patients with sleep apnoea (Czupryniak et al. 2005; Dorkova et al. 2008); (5) diabetic patients receiving insulin and exposed to hyperbaric oxygen for treatment of diabetic ulcers frequently experience unexpected reductions in blood glucose and/or hypoglycaemia during treatment (Al-Waili et al. 2006); and (6) hypoglycaemia can stimulate the hypoxic ventilatory response in humans (Ward et al. 2007). Taken together these observations are consistent with the concept that altering  can affect blood glucose homeostasis via altering how carotid chemoreceptors sense and respond to blood glucose.
Limitations
Since hypoglycaemia increases sympathetic outflow in humans (Fagius et al. 1986), one limitation to our study is that steady state hyperoxia (presumably acting via the carotid bodies) can suppress sympathetic nerve traffic (Seals et al. 1991) and therefore the sympathetic neural responses to a number of physiological stimuli. Thus, the effects of hyperoxia during hypoglycaemia might have been due to a general non-specific sympathoinhibition induced by hyperoxia. Hyperoxia during hypoglycaemia reduced noradrenaline and adrenaline consistent with an attenuation of sympathetic outflow and the release of both glucagon and cortisol are partially mediated by sympathetic activation (for review, Hoffman, 2007). However, hyperoxia also blunted growth hormone, indicating that non-sympathetic counterregulatory responses were also blunted by inactivation of the carotid bodies.
Since elevated oxygen tension has complex and widespread effects our assumption that the primary role of hyperoxia in this study was to desensitize the carotid bodies is confounded by several other possibilities. First, the responses observed in this study could also be centrally mediated rather than related to suppression of transmitter release from Type I carotid body glomus cells and subsequent carotid sinus nerve afferent activation. Hyperoxia is known to increase oxygen delivery and augment cerebral blood flow (Shin et al. 2007) which may have effects on brain glucose utilization and central chemoreceptors. Second, hyperoxia directly, or indirectly via a reduction in limb blood flow, may have caused a change in glucose disposal or insulin sensitivity in muscles, a shift in the glycolytic processes in muscle, changes in mitochondrial respiration and/or an alteration in overall metabolic rate. However, based on the supportive cellular and animal studies discussed above, these possible explanations seem less likely to have confounded our findings and interpretations.
Conclusion
We have provided evidence consistent with the idea that the carotid bodies play a role in the counterregulatory responses to hypoglycaemia in humans. This interpretation is supported by data from studies in both isolated cells and animal models. Additionally, it is tempting to speculate that altered carotid body sensing or control of blood glucose might have implications for clinical conditions associated with altered regulation of blood glucose including sleep apnoea, Type II diabetes and also hypoglycaemia unawareness in Type I diabetes.
Acknowledgments
The authors wish to acknowledge the contributions of nursing and technical staff to this study: Barbara Norby, Shelly Roberts, Karen Krucker, Jean Knutson, Betty Ann Dicke, Pamela Reich, Nancy Meyer, Pam Engrav and Christopher Johnson of Mayo Clinic. In addition, we thank the Clinical Research Unit staff at Mayo Clinic, the Immunocytochaemical Core Laboratory at Mayo Clinic, in particular Hilary Blair, and our research subjects. There is no conflict of interest to disclose. Funding sources: NIH NS32352 (MJJ), NIH T32 DK07352 (EAW), NIH F32 DK84624-01A1 (EAW), NIH 1 UL1 RR024150(Mayo Clinic CTSA, MJJ), NIH DK29953 (RB, RAR), NIH DK 082424 (TBC), Mayo Clinic Research Early Career Development Supplement (TBC).
Glossary
Abbreviations
- COPD
chronic obstructive pulmonary disease
- DEXA
dual energy x-ray absorptiometry
- FFM
fat-free mass
- T
protocol time
Author contributions
E.A.W., R.B., A.B., T.B.C., R.A.R., and M.J.J. contributed to the conception and design of the experiments and contributed to the collection, analysis and interpretation of data. All authors contributed to the drafting the article or revising it critically for important intellectual content. All authors approved the final version of the manuscript.
References
- Al-Waili NS, Butler GJ, Beale J, Abdullah MS, Finkelstein M, Merrow M, Rivera R, Petrillo R, Carrey Z, Lee B, Allen M. Influences of hyperbaric oxygen on blood pressure, heart rate and blood glucose levels in patients with diabetes mellitus and hypertension. Arch Med Res. 2006;37:991–997. doi: 10.1016/j.arcmed.2006.05.009. [DOI] [PubMed] [Google Scholar]
- Alvarez-Buylla R, Alvarez-Buylla E, Mendoza H, Montero SA, Alvarez-Buylla A. Pituitary and adrenals are required for hyperglycemic reflex initiated by stimulation of CBR with cyanide. Am J Physiol Regul Integr Comp Physiol. 1997;272:R392–399. doi: 10.1152/ajpregu.1997.272.1.R392. [DOI] [PubMed] [Google Scholar]
- Bin-Jaliah I, Maskell PD, Kumar P. Indirect sensing of insulin-induced hypoglycaemia by the carotid body in the rat. J Physiol. 2004;556:255–266. doi: 10.1113/jphysiol.2003.058321. [DOI] [PMC free article] [PubMed] [Google Scholar]
- Conde SV, Obeso A, Gonzalez C. Low glucose effects on rat carotid body chemoreceptor cells’ secretory responses and action potential frequency in the carotid sinus nerve. J Physiol. 2007;585:721–730. doi: 10.1113/jphysiol.2007.144261. [DOI] [PMC free article] [PubMed] [Google Scholar]
- Czupryniak L, Loba J, Pawlowski M, Nowak D, Bialasiewicz P. Treatment with continuous positive airway pressure may affect blood glucose levels in nondiabetic patients with obstructive sleep apnea syndrome. Sleep. 2005;28:601–603. doi: 10.1093/sleep/28.5.601. [DOI] [PubMed] [Google Scholar]
- de Campos Cruz J, Bonagamba LG, Stern JE, Machado BH. Fos expression in the NTS in response to peripheral chemoreflex activation in awake rats. Auton Neurosci. 2010;152:27–34. doi: 10.1016/j.autneu.2009.08.016. [DOI] [PubMed] [Google Scholar]
- Diamond MP, Grainger DA, Rossi G, Connolly-Diamond M, Sherwin RS. Counter-regulatory response to hypoglycemia in the follicular and luteal phases of the menstrual cycle. Fertil Steril. 1993;60:988–993. [PubMed] [Google Scholar]
- Dorkova Z, Petrasova D, Molcanyiova A, Popovnakova M, Tkacova R. Effects of CPAP on cardiovascular risk profile in patients with severe obstructive sleep apnea and metabolic syndrome. Chest. 2008;134:686–692. doi: 10.1378/chest.08-0556. [DOI] [PubMed] [Google Scholar]
- Downes JJ, Lambertsen CJ. Dynamic characteristics of ventilatory depression in man on abrupt administration of O. J Appl Physiol. 1966;21:447–453. doi: 10.1152/jappl.1966.21.2.447. [DOI] [PubMed] [Google Scholar]
- Fagius J, Niklasson F, Berne C. Sympathetic outflow in human muscle nerves increases during hypoglycemia. Diabetes. 1986;35:1124–1129. doi: 10.2337/diab.35.10.1124. [DOI] [PubMed] [Google Scholar]
- Fanelli CG, Pampanelli S, Porcellati F, Bartocci L, Scionti L, Rossetti P, Bolli GB. Rate of fall of blood glucose and physiological responses of counterregulatory hormones, clinical symptoms and cognitive function to hypoglycaemia in Type I diabetes mellitus in the postprandial state. Diabetologia. 2003;46:53–64. doi: 10.1007/s00125-002-0948-9. [DOI] [PubMed] [Google Scholar]
- Fitzgerald R, Lahiri S. Reflex responses to chemoreceptor stimulation. In: Fishman AP, Cherniack NS, Widdicombe JG, Geiger SR, editors. Handbook of Physiology, section 3, The Respiratory System, vol II, Control of Breathing. Bethesda: American Physiological Society; 1986. pp. 313–362. chapter 1010. [Google Scholar]
- Garcia-Fernandez M, Ortega-Saenz P, Castellano A, Lopez-Barneo J. Mechanisms of low-glucose sensitivity in carotid body glomus cells. Diabetes. 2007;56:2893–2900. doi: 10.2337/db07-0122. [DOI] [PubMed] [Google Scholar]
- Gerich J, Davis J, Lorenzi M, Rizza R, Bohannon N, Karam J, Lewis S, Kaplan R, Schultz T, Cryer P. Hormonal mechanisms of recovery from insulin-induced hypoglycemia in man. Am J Physiol Endocrinol Metab. 1979;236:E380–385. doi: 10.1152/ajpendo.1979.236.4.E380. [DOI] [PubMed] [Google Scholar]
- Hjalmarsen A, Aasebo U, Birkeland K, Sager G, Jorde R. Impaired glucose tolerance in patients with chronic hypoxic pulmonary disease. Diabetes Metab. 1996;22:37–42. [PubMed] [Google Scholar]
- Hoffman RP. Sympathetic mechanisms of hypoglycemic counterregulation. Curr Diabetes Rev. 2007;3:185–193. doi: 10.2174/157339907781368995. [DOI] [PubMed] [Google Scholar]
- Jakobsson P, Jorfeldt L. Oxygen supplementation increases glucose tolerance during euglycaemic hyperinsulinaemic glucose clamp procedure in patients with severe COPD and chronic hypoxaemia. Clin Physiol Funct Imaging. 2006;26:271–274. doi: 10.1111/j.1475-097X.2006.00686.x. [DOI] [PubMed] [Google Scholar]
- Koyama Y, Coker RH, Denny JC, Lacy DB, Jabbour K, Williams PE, Wasserman DH. Role of carotid bodies in control of the neuroendocrine response to exercise. Am J Physiol Endocrinol Metab. 2001;281:E742–748. doi: 10.1152/ajpendo.2001.281.4.E742. [DOI] [PubMed] [Google Scholar]
- Koyama Y, Coker RH, Stone EE, Lacy DB, Jabbour K, Williams PE, Wasserman DH. Evidence that carotid bodies play an important role in glucoregulation in vivo. Diabetes. 2000;49:1434–1442. doi: 10.2337/diabetes.49.9.1434. [DOI] [PubMed] [Google Scholar]
- Lahiri S, DeLaney RG. Relationship between carotid chemoreceptor activity and ventilation in the cat. Respir Physiol. 1975;24:267–286. doi: 10.1016/0034-5687(75)90018-3. [DOI] [PubMed] [Google Scholar]
- Lecavalier L, Bolli G, Cryer P, Gerich J. Contributions of gluconeogenesis and glycogenolysis during glucose counterregulation in normal humans. Am J Physiol Endocrinol Metab. 1989;256:E844–851. doi: 10.1152/ajpendo.1989.256.6.E844. [DOI] [PubMed] [Google Scholar]
- Nurse CA. Neurotransmission and neuromodulation in the chemosensory carotid body. Auton Neurosci. 2005;120:1–9. doi: 10.1016/j.autneu.2005.04.008. [DOI] [PubMed] [Google Scholar]
- Oltmanns KM, Gehring H, Rudolf S, Schultes B, Rook S, Schweiger U, Born J, Fehm HL, Peters A. Hypoxia causes glucose intolerance in humans. Am J Respir Crit Care Med. 2004;169:1231–1237. doi: 10.1164/rccm.200308-1200OC. [DOI] [PubMed] [Google Scholar]
- Pardal R, Lopez-Barneo J. Low glucose-sensing cells in the carotid body. Nat Neurosci. 2002;5:197–198. doi: 10.1038/nn812. [DOI] [PubMed] [Google Scholar]
- Seals DR, Johnson DG, Fregosi RF. Hyperoxia lowers sympathetic activity at rest but not during exercise in humans. Am J Physiol Regul Integr Comp Physiol. 1991;260:R873–878. doi: 10.1152/ajpregu.1991.260.5.R873. [DOI] [PubMed] [Google Scholar]
- Shin HK, Dunn AK, Jones PB, Boas DA, Lo EH, Moskowitz MA, Ayata C. Normobaric hyperoxia improves cerebral blood flow and oxygenation, and inhibits peri-infarct depolarizations in experimental focal ischaemia. Brain. 2007;130:1631–1642. doi: 10.1093/brain/awm071. [DOI] [PMC free article] [PubMed] [Google Scholar]
- Timmers HJ, Karemaker JM, Wieling W, Marres HA, Folgering HT, Lenders JW. Baroreflex and chemoreflex function after bilateral carotid body tumor resection. J Hypertens. 2003;21:591–599. doi: 10.1097/00004872-200303000-00026. [DOI] [PubMed] [Google Scholar]
- Ward DS, Voter WA, Karan S. The effects of hypo- and hyperglycaemia on the hypoxic ventilatory response in humans. J Physiol. 2007;582:859–869. doi: 10.1113/jphysiol.2007.130112. [DOI] [PMC free article] [PubMed] [Google Scholar]
- Ward DS, Voter WA, Karan S. The role of the carotid bodies in the counter-regulatory response to hypoglycemia. Adv Exp Med Biol. 2009;648:273–280. doi: 10.1007/978-90-481-2259-2_31. [DOI] [PubMed] [Google Scholar]
- Zhang M, Buttigieg J, Nurse CA. Neurotransmitter mechanisms mediating low-glucose signalling in cocultures and fresh tissue slices of rat carotid body. J Physiol. 2007;578:735–750. doi: 10.1113/jphysiol.2006.121871. [DOI] [PMC free article] [PubMed] [Google Scholar]